比特币行情分析
价格趋势与支撑阻力
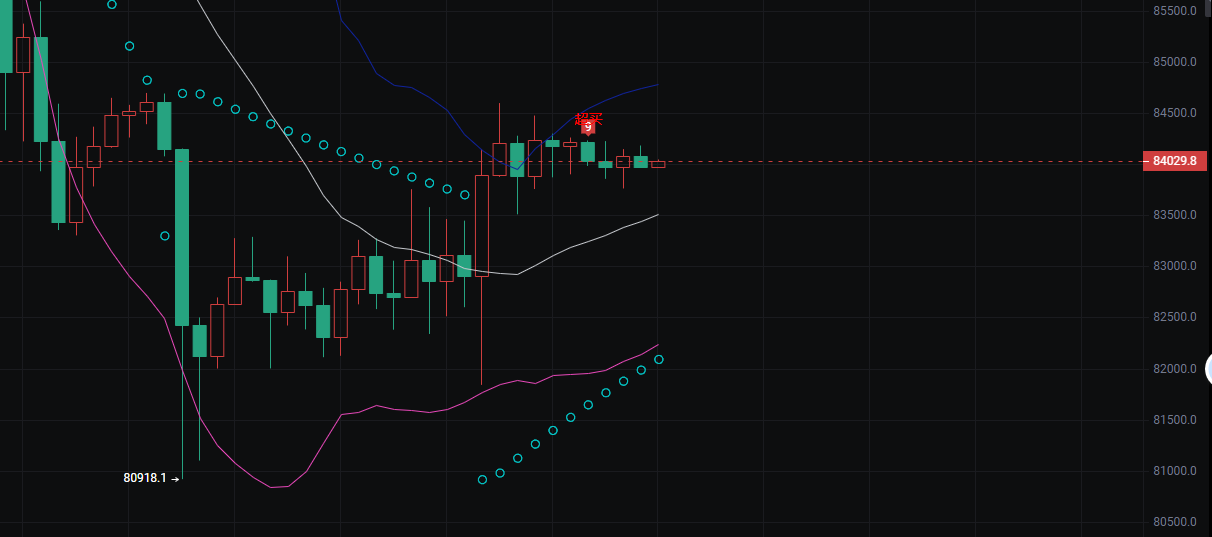
当前价格在 84000 附近横盘整理,这个位置是近期的一个多空平衡点。
下方的 81437.9 是近期的重要支撑位,之前价格从这里触底反弹。
上方 85000 是明显的压力位,价格多次尝试突破都未能站稳。
均线系统信号
短期均线(白色)呈现向上拐头的态势,而长期均线(蓝色)则是走平状态,这表明短期的多头力量正在逐步积累,但中期趋势还没有完全明朗。
更下方的粉色均线持续向上,说明本轮从低位的反弹结构目前还没有被破坏。
动能与形态
从 K 线形态来看,价格在经历一波快速下探后进入了震荡修复阶段,近期的红绿 K 线实体都比较小,说明多空双方的力量暂时处于僵持状态。
图中的点状指标也跟随价格逐步走高,反映出短期的买盘动能是在温和释放的。
后续关键观察点
向上突破:如果价格能够放量站稳 84500-85000 区间,那么大概率会打开新的上涨空间。
向下回踩:如果回落到 83000 下方,就要考验 81437.9 这个支撑位的强度,一旦失守,反弹趋势可能会面临反转风险。
📊 关键价位交易计划
1. 多头触发条件
入场信号:价格放量突破 84500,并且站稳在 85000 上方。
止损位:设置在 83800(突破前的震荡区间下沿)。
目标位:第一目标看 86000,第二目标看 88000(前期压力位)。
2. 空头触发条件
入场信号:价格有效跌破 83000,并且回踩确认 81437.9 支撑失败。
止损位:设置在 83500(跌破前的震荡区间上沿)。
目标位:第一目标看 80000 整数关口,第二目标看前期低点 79000。
3. 震荡区间应对策略
当前价格在 83000-84500 区间内震荡时,建议以观望为主,或者进行高抛低吸的短线操作。
高抛:在接近 84500 时卖出,止损设置在 84800。
低吸:在接近 83000 时买入,止损设置在 82700。
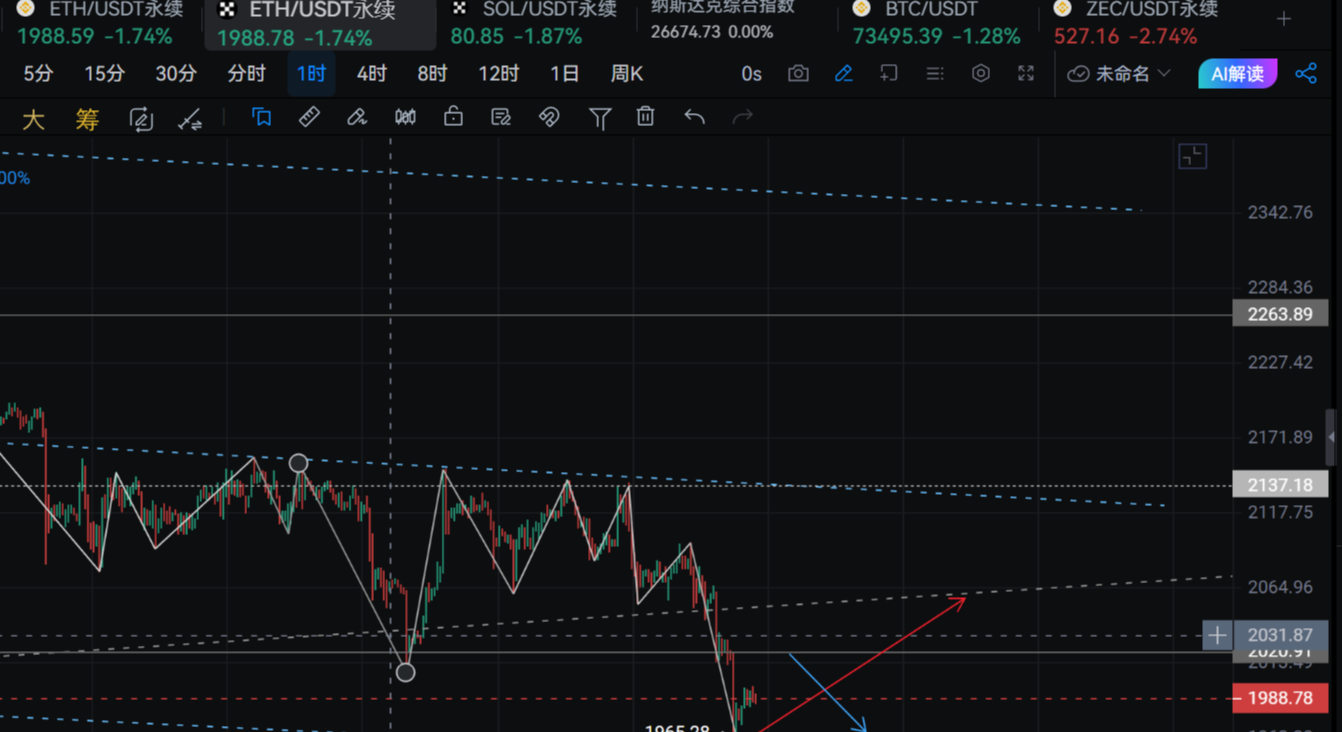
以太坊行情分析:
趋势与阶段
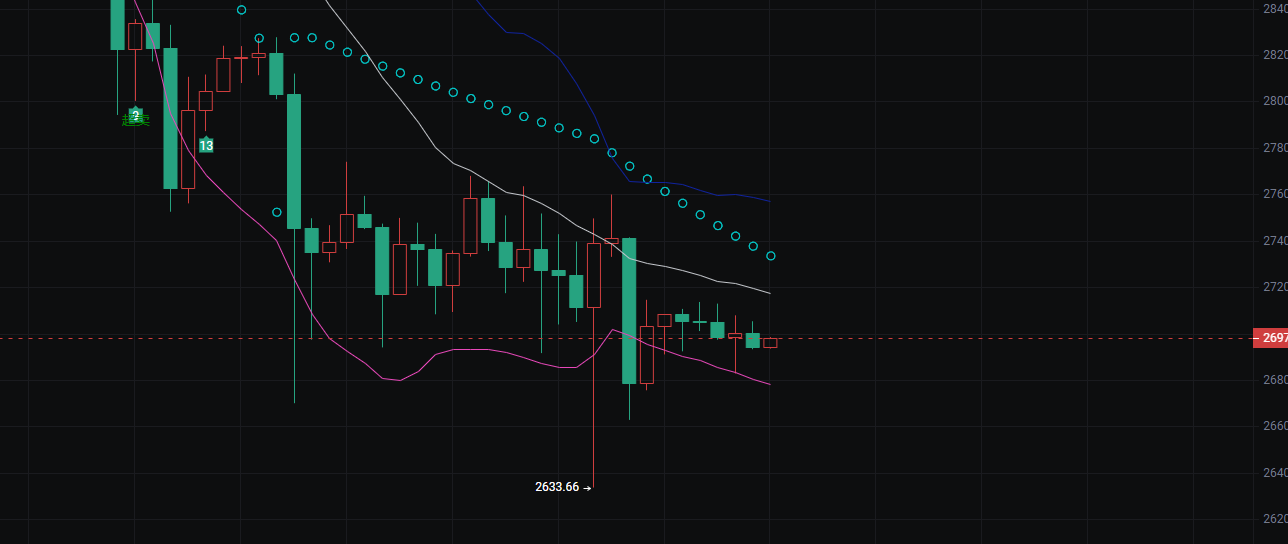
这是一个典型的中期下跌 + 短期超跌反弹走势。价格从 2860 附近一路下行,最低触及 2633.66 后开始企稳。
当前价格在 2700 附近整理,处于超跌后的修复阶段,但中期的下跌趋势尚未被完全扭转。
均线系统信号
长期均线(蓝色)和短期均线(白色)都呈现向下的态势,说明中期的空头力量依然主导市场。
下方的粉色均线在触底后有走平迹象,反映短期超跌后买盘开始小幅入场,但动能还比较弱。
图中的点状指标跟随价格下行后也出现了低位拐头,印证了短期的反弹需求。
支撑与阻力
关键支撑:2633.66 是近期的最低点,是多头的重要防守位;其次是 2680 整数关口。
关键阻力:上方最近的压力位是 2720-2740 区间(前期震荡平台下沿),更强的阻力在 2760(均线压制位)。
后续关键观察点
向上修复:若价格能放量突破 2740,则反弹空间有望打开,下一步可看 2760-2780。
再次探底:若无法站稳 2700,则可能回踩 2633.66 支撑,甚至创出新低。
📊 2700 关口交易计划
1. 多头触发条件
入场信号:价格放量突破 2720,并站稳在 2740 上方。
止损位:设置在 2690(2700 整数关口下方)。
目标位:第一目标看 2760(均线压力位),第二目标看 2780(前期平台位)。
2. 空头触发条件
入场信号:价格有效跌破 2690,并回踩确认 2680 支撑失败。
止损位:设置在 2710(2700 整数关口上方)。
目标位:第一目标看 2650(前期低点附近),第二目标看 2633.66(历史低点)。
3. 震荡区间应对策略
当前价格在 2690-2720 区间内震荡时,建议以观望为主,或进行高抛低吸的短线操作。
高抛:在接近 2720 时卖出,止损设置在 2730。
低吸:在接近 2690 时买入,止损设置在 2680。

(注:📣 由于公开平台的信息时效性和深度有限,市场瞬息万变,关键拐点、精准操作策略、突发风险提示,等内容需在(公众号号——比特熊)第一时间同步。在这里,你能获得: 实时策略推送,深度分析支持、互动答疑,针对个人持仓提供风险预警和优化建议。 🚨 谨记:市场永远奖励行动更快、信息更准的人!做少数派的赢家。)
免责声明:本文章仅代表作者个人观点,不代表本平台的立场和观点。本文章仅供信息分享,不构成对任何人的任何投资建议。用户与作者之间的任何争议,与本平台无关。如网页中刊载的文章或图片涉及侵权,请提供相关的权利证明和身份证明发送邮件到support@aicoin.com,本平台相关工作人员将会进行核查。