Good evening everyone, I am your old friend Qinglan.
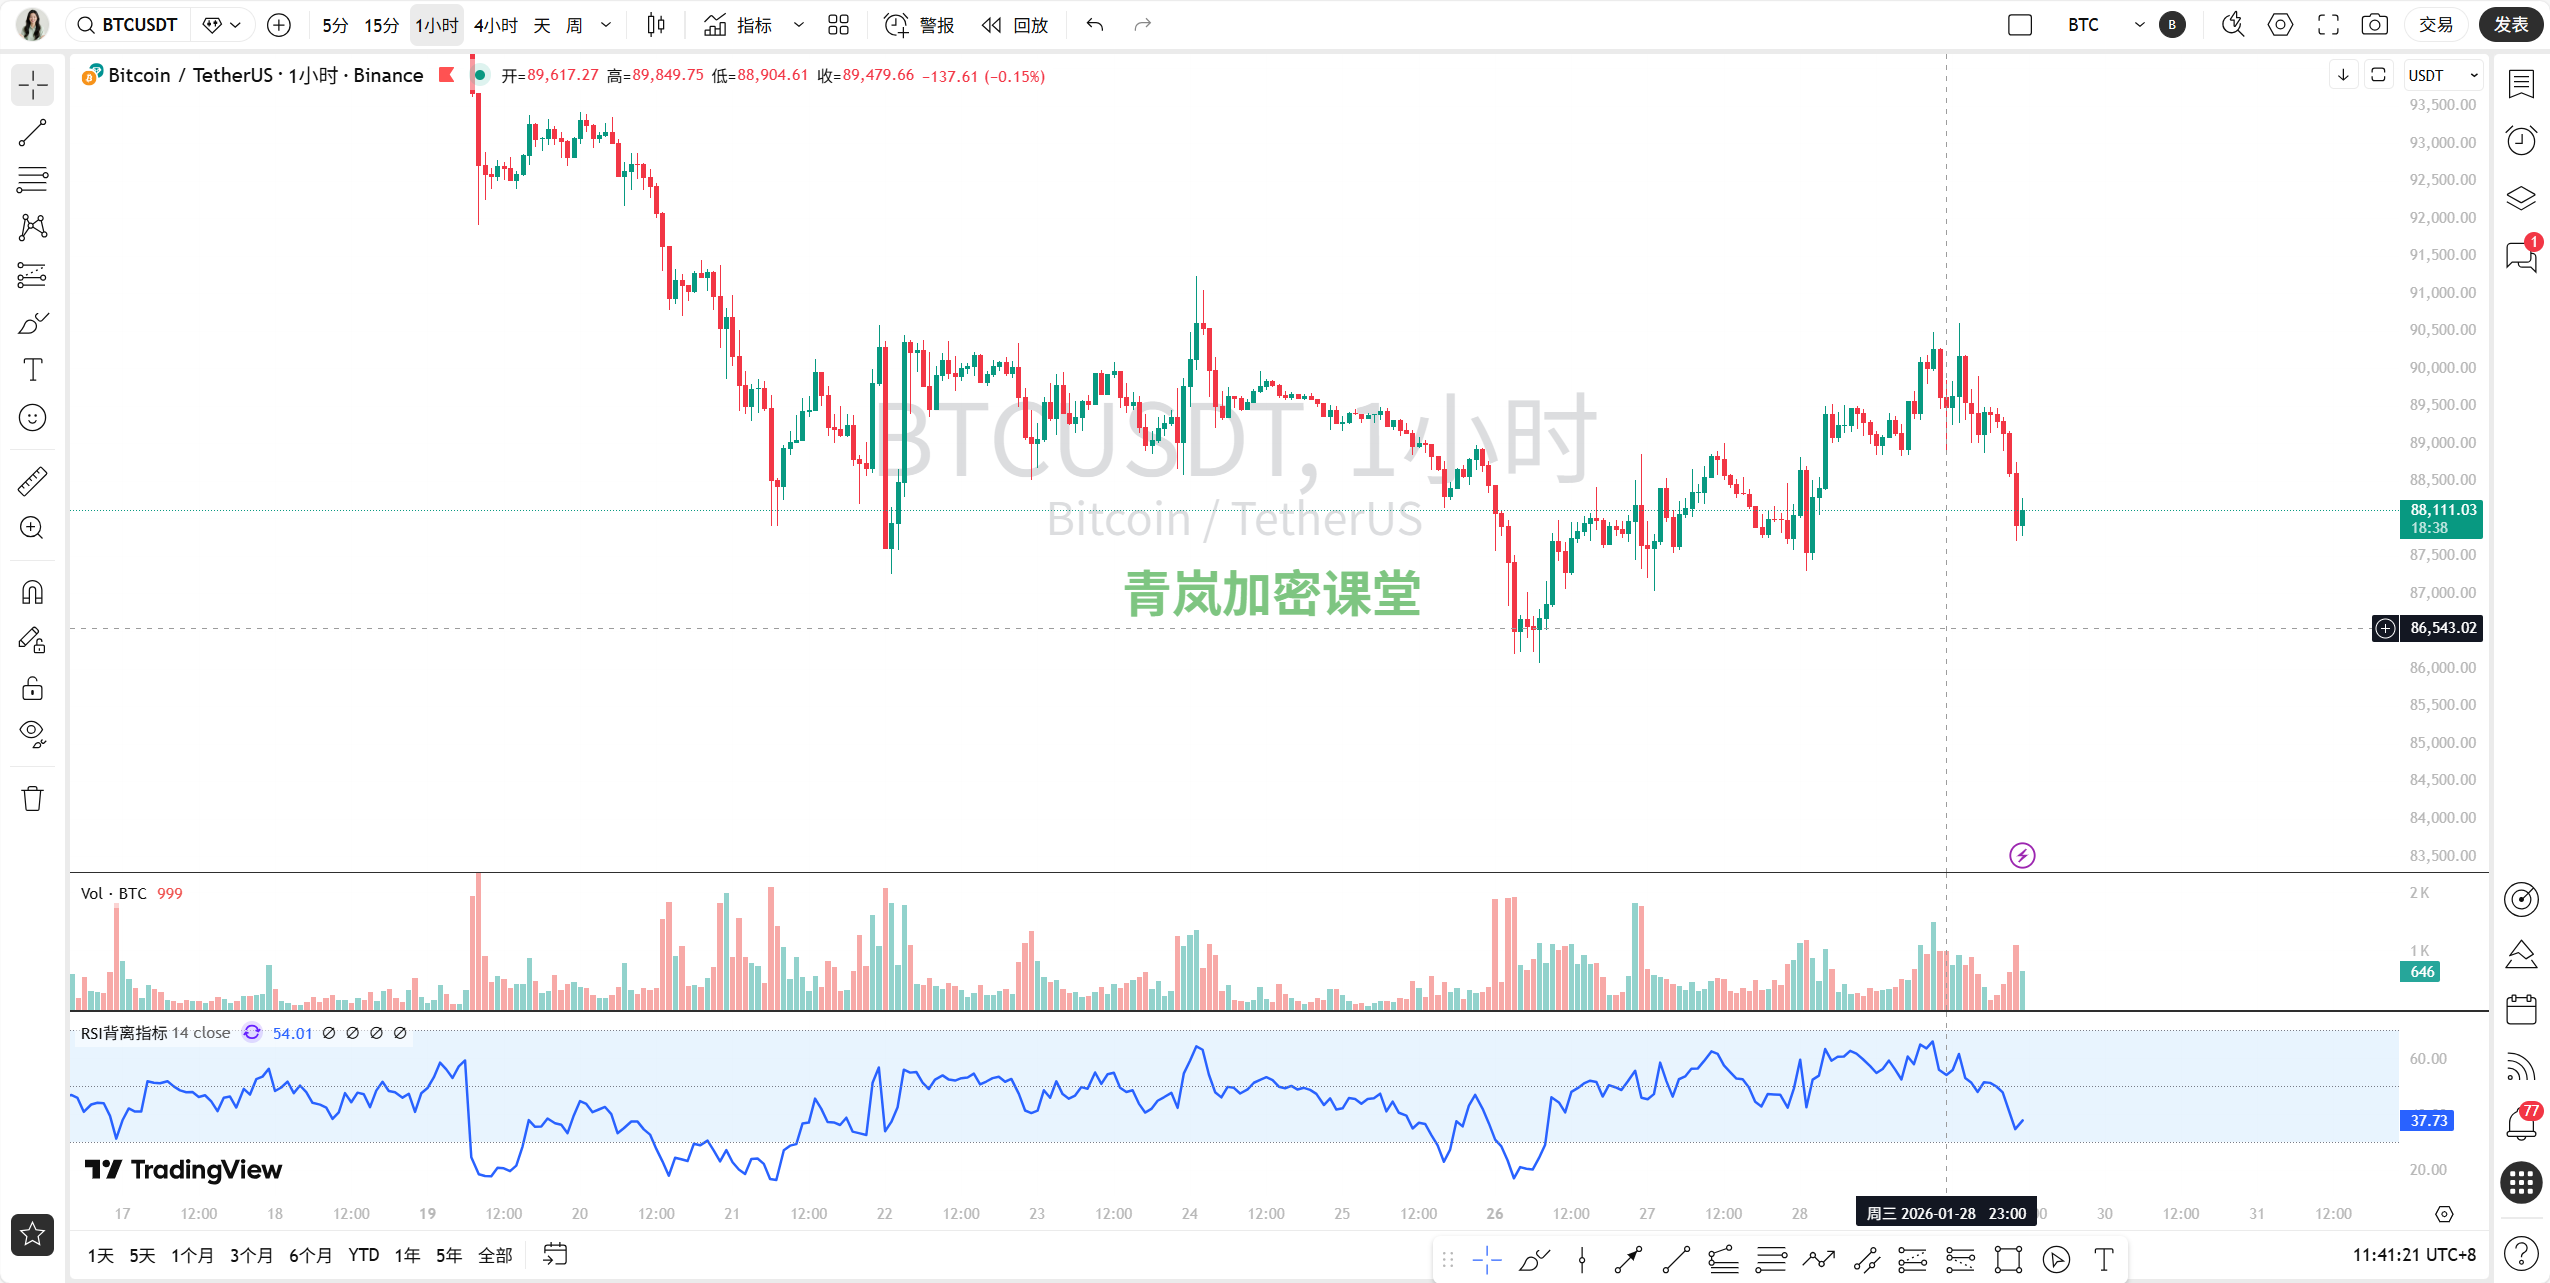
Did everyone see last night's market? Bitcoin plummeted directly from above 90,000, dropping over 2,000 dollars in just a few hours. Many friends in the group asked: "Sister Qinglan, is the bull market over?" "Can we buy the dip now?"
We won't talk nonsense in our class, let's get straight to the point. Today's decline is essentially a precise strike from both the "macro" and "technical" perspectives.
First, let's look at the "macro" aspect — the Federal Reserve dealt a heavy blow.
The most important event last night was the speech by Federal Reserve Chairman Powell. His core message was simple: Interest rate cuts? Not urgent! The market shouldn't get too "carried away"! This somewhat "hawkish" statement directly extinguished the market's expectations for easing.
Remember an ironclad rule: under the expectation of the Federal Reserve tightening liquidity, all risk assets (stocks, cryptocurrencies) will come under pressure, while traditional safe-haven assets (like gold) will rise. Did you see gold hitting a new high last night? This is capital "seeking safety," flowing from high-risk areas to safe havens. Bitcoin, as the "vanguard" of risk assets, naturally takes the first hit.
Second, let's look at the "technical" aspect — all cycles are "flashing red lights."
Let’s quickly review the situation, and you'll see how dangerous it is now:
15-minute chart (ultra-short term): The moving averages are cascading down like a waterfall, a typical "death cross." The MACD green bars have turned red and are still extending, indicating that the "accelerator" for the decline hasn't been released. The RSI has dropped below 30, signaling that the market is "oversold," but be aware, in a bear market, "oversold" can become "even more oversold."
1-hour chart (short term): The rebound didn't even touch the MA20 moving average before being pushed down again. The MACD just crossed below the zero line and quickly plunged below it, indicating very strong bearish momentum.
4-hour chart (medium term): Most critical! It has just broken below the "88,000-90,500 dollar fluctuation platform" that had been maintained for over a week. You can think of this platform as a "castle in the air," and now that the floor has been breached, the price will naturally seek support at the next platform below.
Daily chart (long term): The most concerning signal has appeared — the MA5, MA10, and MA20 moving averages have formed a "death cross." In trend trading, this is called a confirmation signal for a "trend reversal." The red bars of the daily MACD have also started to emerge.
Qinglan's key takeaway: The technical patterns across all four cycles, from short to long, point towards a "downward trend." This is not a minor adjustment; traders across all time dimensions (from high-frequency traders to long-term holders) are synchronously selling or standing by.
Third, Qinglan's practical strategy for you
Now is not the time to be stubborn; the strategy must be clear:
Core idea: Give up fantasies, recognize reality. The current main trend is "downward." Until the death cross on the daily moving averages is repaired, any rise should be viewed as a "rebound" rather than a "reversal."
Key positions:
Resistance level (selling zone): 88,200-89,000 dollars. This is the lower edge of the platform that was just broken, and it has now become a strong resistance. If the price rebounds to this level and fails to rise further, it provides a second opportunity for those who didn't exit earlier to reduce their positions, and it's also a point where aggressive traders might consider lightly "shorting."
Support level (observation zone): 87,000 dollars → 86,000-86,500 dollars. 87,000 is the recent low; if it breaks, the next important defense line is at 86,000-86,500, which is a dense trading area where last year's market started, and it will provide relatively strong support.
Under what circumstances can we consider buying the dip?
Remember Qinglan's three conditions, which must be met simultaneously:Price: Drops to the strong support zone of 86,000-86,500 or even lower.
Pattern: A clear reversal candlestick (such as a long lower shadow or bullish engulfing) appears in the support zone, and it does not make new lows for several consecutive days.
Indicators: A bullish divergence appears in the 4-hour or daily MACD (new price low, but the indicator does not make a new low).
Before these three conditions are met, hold your hands, watch more, and act less. Cash in hand means opportunities will always be there.
Finally, Qinglan's heartfelt words:
The market will not only rise without falling; deep corrections in a bull market are meant to wash out weak hands, allowing it to go further. But this process is very brutal and will eliminate countless impatient dip buyers. True investment experts do not blindly catch falling knives during a decline; they accurately enter when the trend strengthens again.
Stay patient, keep learning. The market will always be here, but your capital may not be. Tonight's class ends here; let's observe the changes and wait for the right moment.
For more quantitative breakdowns of how real-time news affects market sentiment, check out my Qinglan Crypto Classroom at www.qinglan.org. Lastly, Qinglan's reminder in one sentence: Don't stubbornly resist when the trend breaks, reducing positions during rebounds is the best strategy; don't act until you see the rabbit, preserve your capital until dawn.
免责声明:本文章仅代表作者个人观点,不代表本平台的立场和观点。本文章仅供信息分享,不构成对任何人的任何投资建议。用户与作者之间的任何争议,与本平台无关。如网页中刊载的文章或图片涉及侵权,请提供相关的权利证明和身份证明发送邮件到support@aicoin.com,本平台相关工作人员将会进行核查。


