From the daily chart, bitcoin appears to be recovering from a recent pullback, forming a V-shaped bounce between $84,398 and the recent high of $94,792. Currently hovering around $90,500, price action is marked by small-bodied candles—indicative of market hesitation, or as some might say, a whole lot of “meh.”
With support lying strong between $84,500 and $85,000 and resistance at $94,500 to $95,000, traders are watching for a potential pushback from the bulls—if they can shake off the weekend hangover. Volume is easing, which could mean the market is gearing up for its next move or just taking a breather after a sprint.
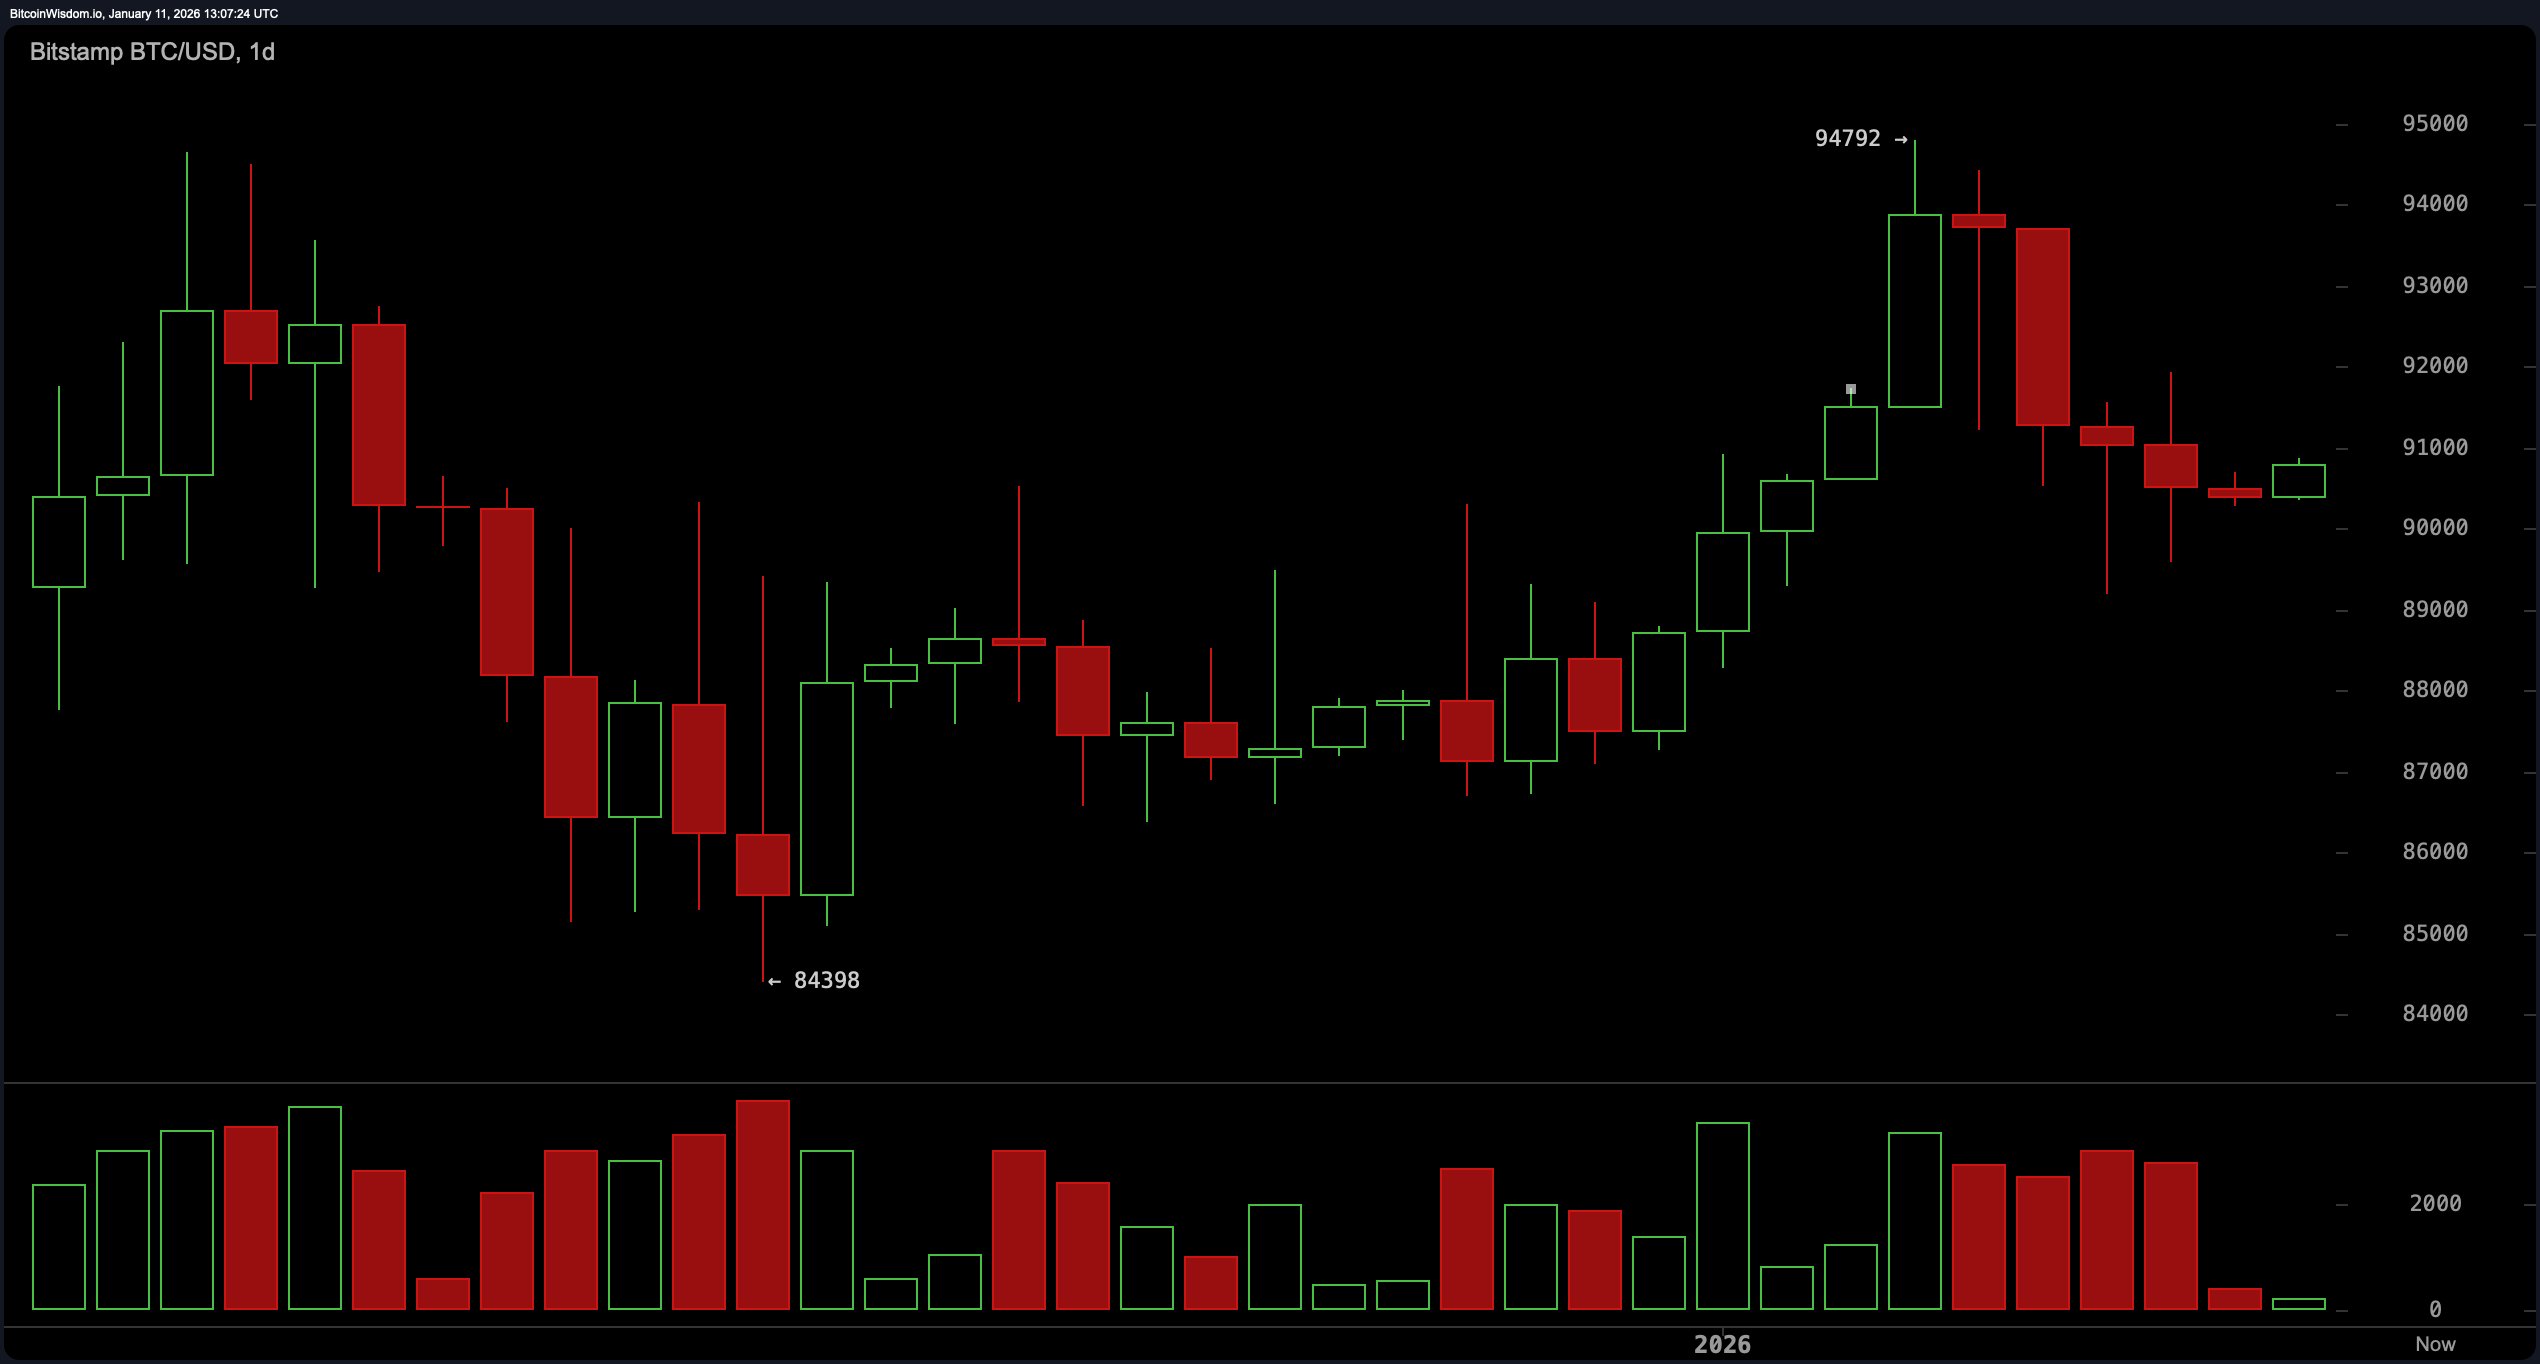
BTC/USD 1-day chart via Bitstamp on Jan. 11, 2026.
On the 4-hour chart, things are as sideways as a crab on roller skates. Bitcoin’s recent slide found footing at $89,199, where a bottoming tail hinted at a flicker of buying interest. Since then, the price has slipped into a consolidation phase inside a descending channel that’s beginning to level out. Volume is trickling lower—always a sign that neither side is itching for a showdown. But the next spark could be a breakout above $91,000, which would indicate that bulls have found their courage (and maybe a double shot of espresso).
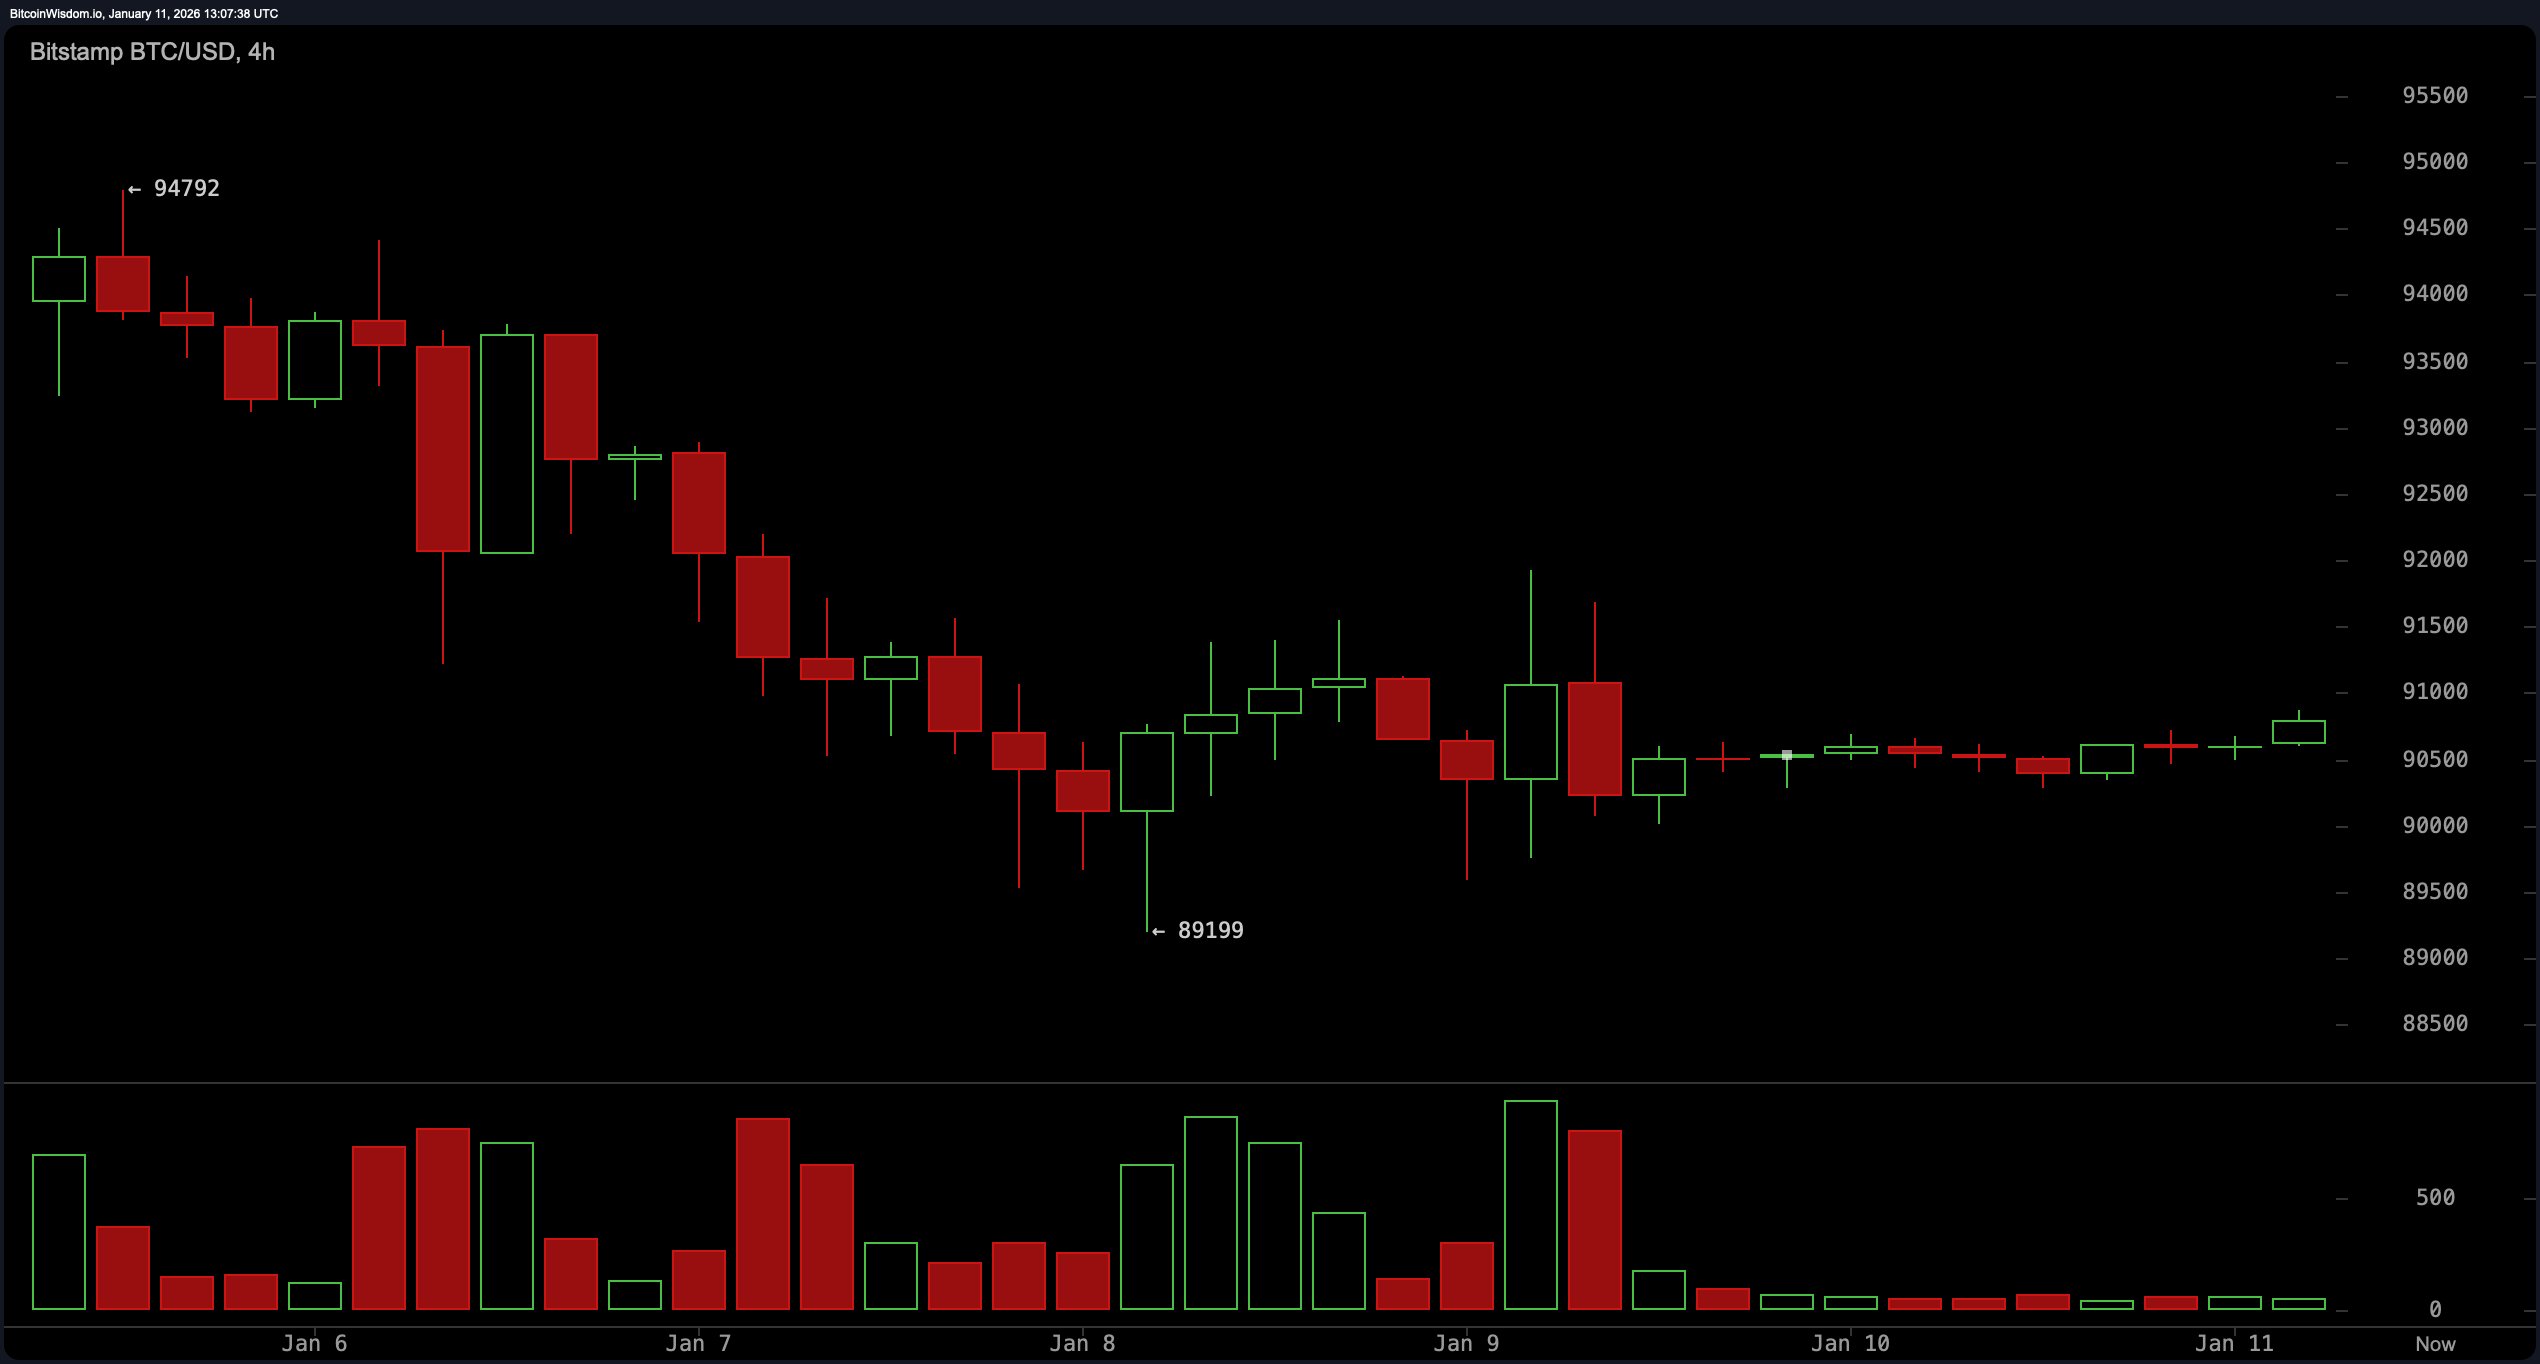
BTC/USD 4-hour chart via Bitstamp on Jan. 11, 2026.
Zooming into the 1-hour chart, bitcoin is nestled in a tight $600 range. A recent bounce up to $90,867, paired with a volume spike, suggests a potential short-term reversal. Still, without a breakout above $91,000 supported by strong volume, this could be just another tease. A rounding bottom pattern might be in play, hinting at accumulation—but confirmation is key. Scalpers are watching for a clean move above $90,900, but if the volume fizzles, the rally could deflate faster than a party balloon in January.
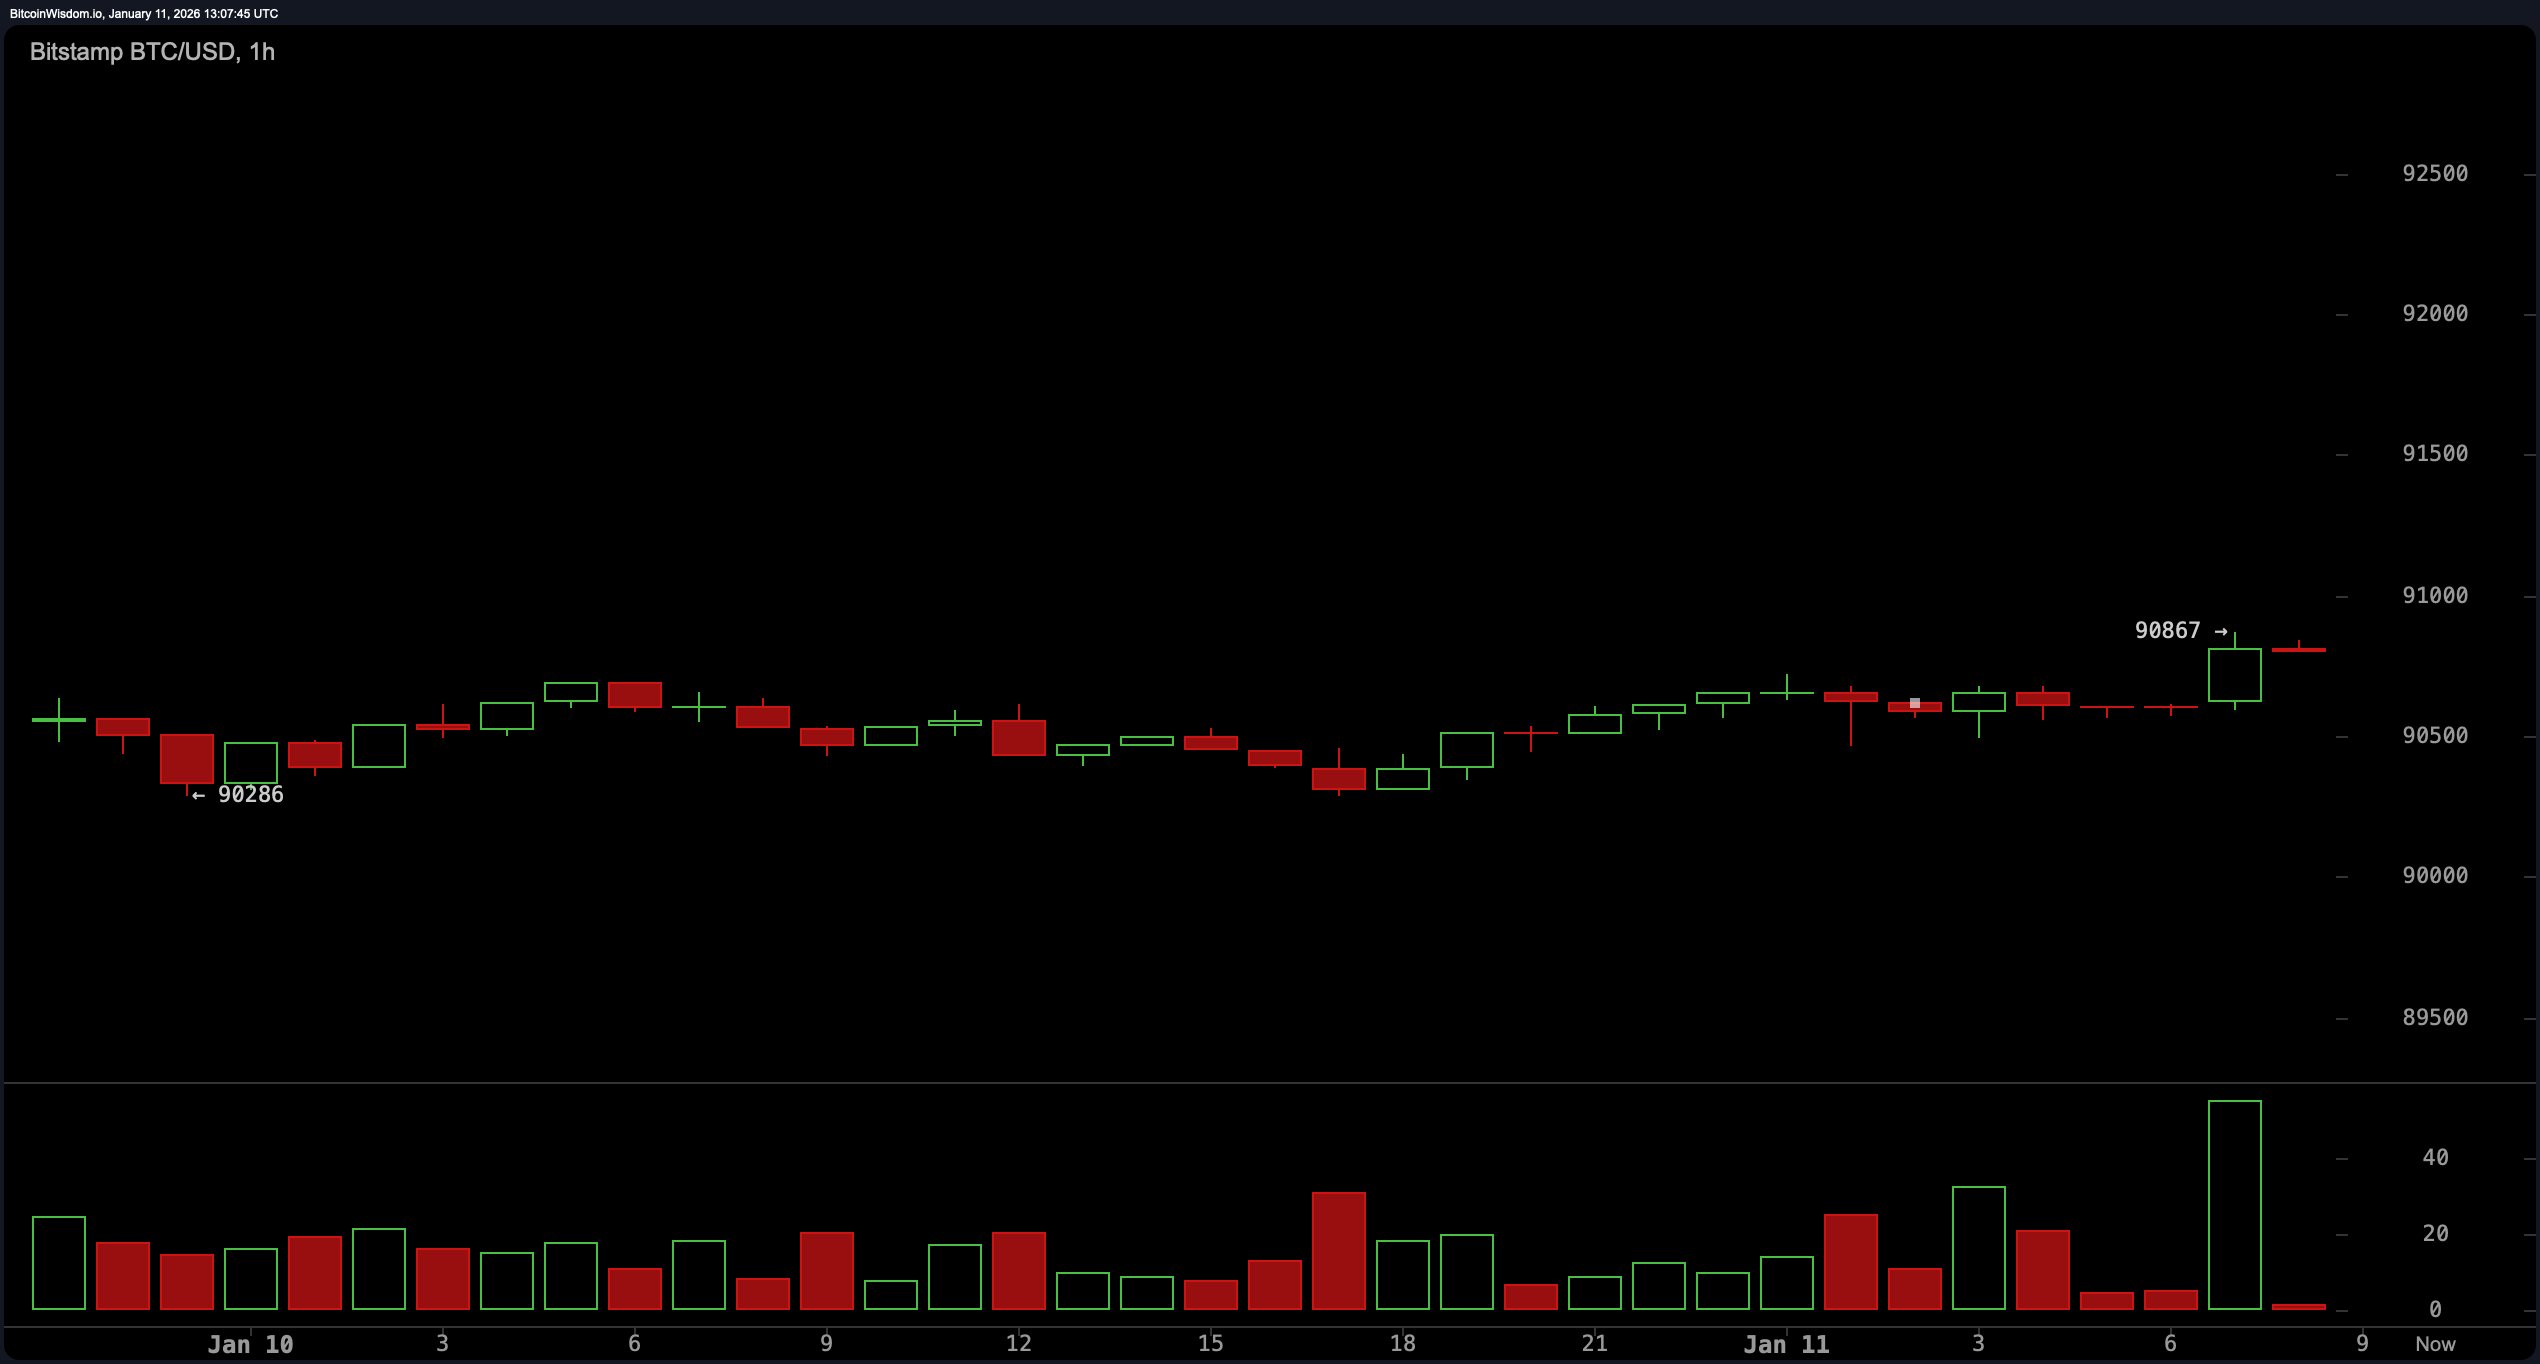
BTC/USD 1-hour chart via Bitstamp on Jan. 11, 2026.
The oscillators aren’t exactly cheering from the sidelines. The relative strength index ( RSI) is at 53, signaling neutrality, and the Stochastic oscillator rests at 48—also neutral. The commodity channel index (CCI) is holding at 46, while the average directional index (ADX) shows a value of 25, reflecting low trend strength. Momentum is sliding at 2,078, throwing shade with a bearish indication, while the moving average convergence divergence ( MACD) level is at 475, whispering a bit of bullish optimism into the mix. Overall, the mood among oscillators is: “We’ll get back to you.”
Looking at the moving averages (MAs), it’s a mixed bag of signals and sass. The short-term exponential moving average (EMA) for 10 periods supports further upside at 90,740, while the simple moving average (SMA) for the same period at 91,363 leans bearish. From the 20 to 50-period zone, the majority of moving averages lean bullish, including EMA (20) at 90,189 and SMA (20) at 89,527. However, further out, things turn sour. The 100-period EMA and SMA at 96,084 and 98,210, respectively, alongside the 200-period EMA and SMA at 99,744 and 106,258, are all on the bearish side, implying that the long-term outlook is less pop and more fizzle—at least for now.
In sum, bitcoin is playing it cool with a slight bullish undertone across intraday charts, but traders should keep an eye on the $89,000 floor and the $91,000 ceiling. A breakout in either direction could set the tone for the next leg. Until then, this sideways stroll continues, with market sentiment best described as cautiously curious.
Bull Verdict:
If bitcoin can muster the strength to break above the $91,000 resistance with convincing volume, this could mark the start of a fresh leg upward. With the majority of short- to mid-term moving averages aligning in support and oscillators leaning cautiously optimistic, the setup favors those looking for continuation—assuming the bulls can stay caffeinated. The path to $94,000–$95,000 isn’t guaranteed, but it’s certainly on the radar.
Bear Verdict:
Failure to hold the $89,000–$90,000 zone could see bitcoin tumble back toward the $85,000 support region, or worse, revisit the $84,000 handle. With long-term moving averages flashing red and momentum losing steam, any significant drop in volume could open the door to further downside. The bears aren’t in full control—but they’re circling, waiting for a slip.
- What is the current price of bitcoin?
Bitcoin is trading at $90,828 as of January 11, 2026. - What is bitcoin’s intraday price range today?
Bitcoin’s 24-hour range is between $90,291 and $90,850. - Is bitcoin trending up or down right now?
Bitcoin is consolidating with a slight bullish bias across short-term charts. - What key levels should traders watch?
Watch support at $89,000 and resistance near $91,000 for the next breakout.
免责声明:本文章仅代表作者个人观点,不代表本平台的立场和观点。本文章仅供信息分享,不构成对任何人的任何投资建议。用户与作者之间的任何争议,与本平台无关。如网页中刊载的文章或图片涉及侵权,请提供相关的权利证明和身份证明发送邮件到support@aicoin.com,本平台相关工作人员将会进行核查。


