Btcparser.com 的第一个版本追踪了超过 60,000 个所谓的“沉睡比特币”钱包,通常被称为休眠持有。该平台跟踪的地址来自于 2009 年至 2017 年间专门创建的钱包。与 2024 年相比,2009 年的钱包没有记录支出,2010 年的钱包活动较少,而 2011 年的钱包则出现了一系列的分配。
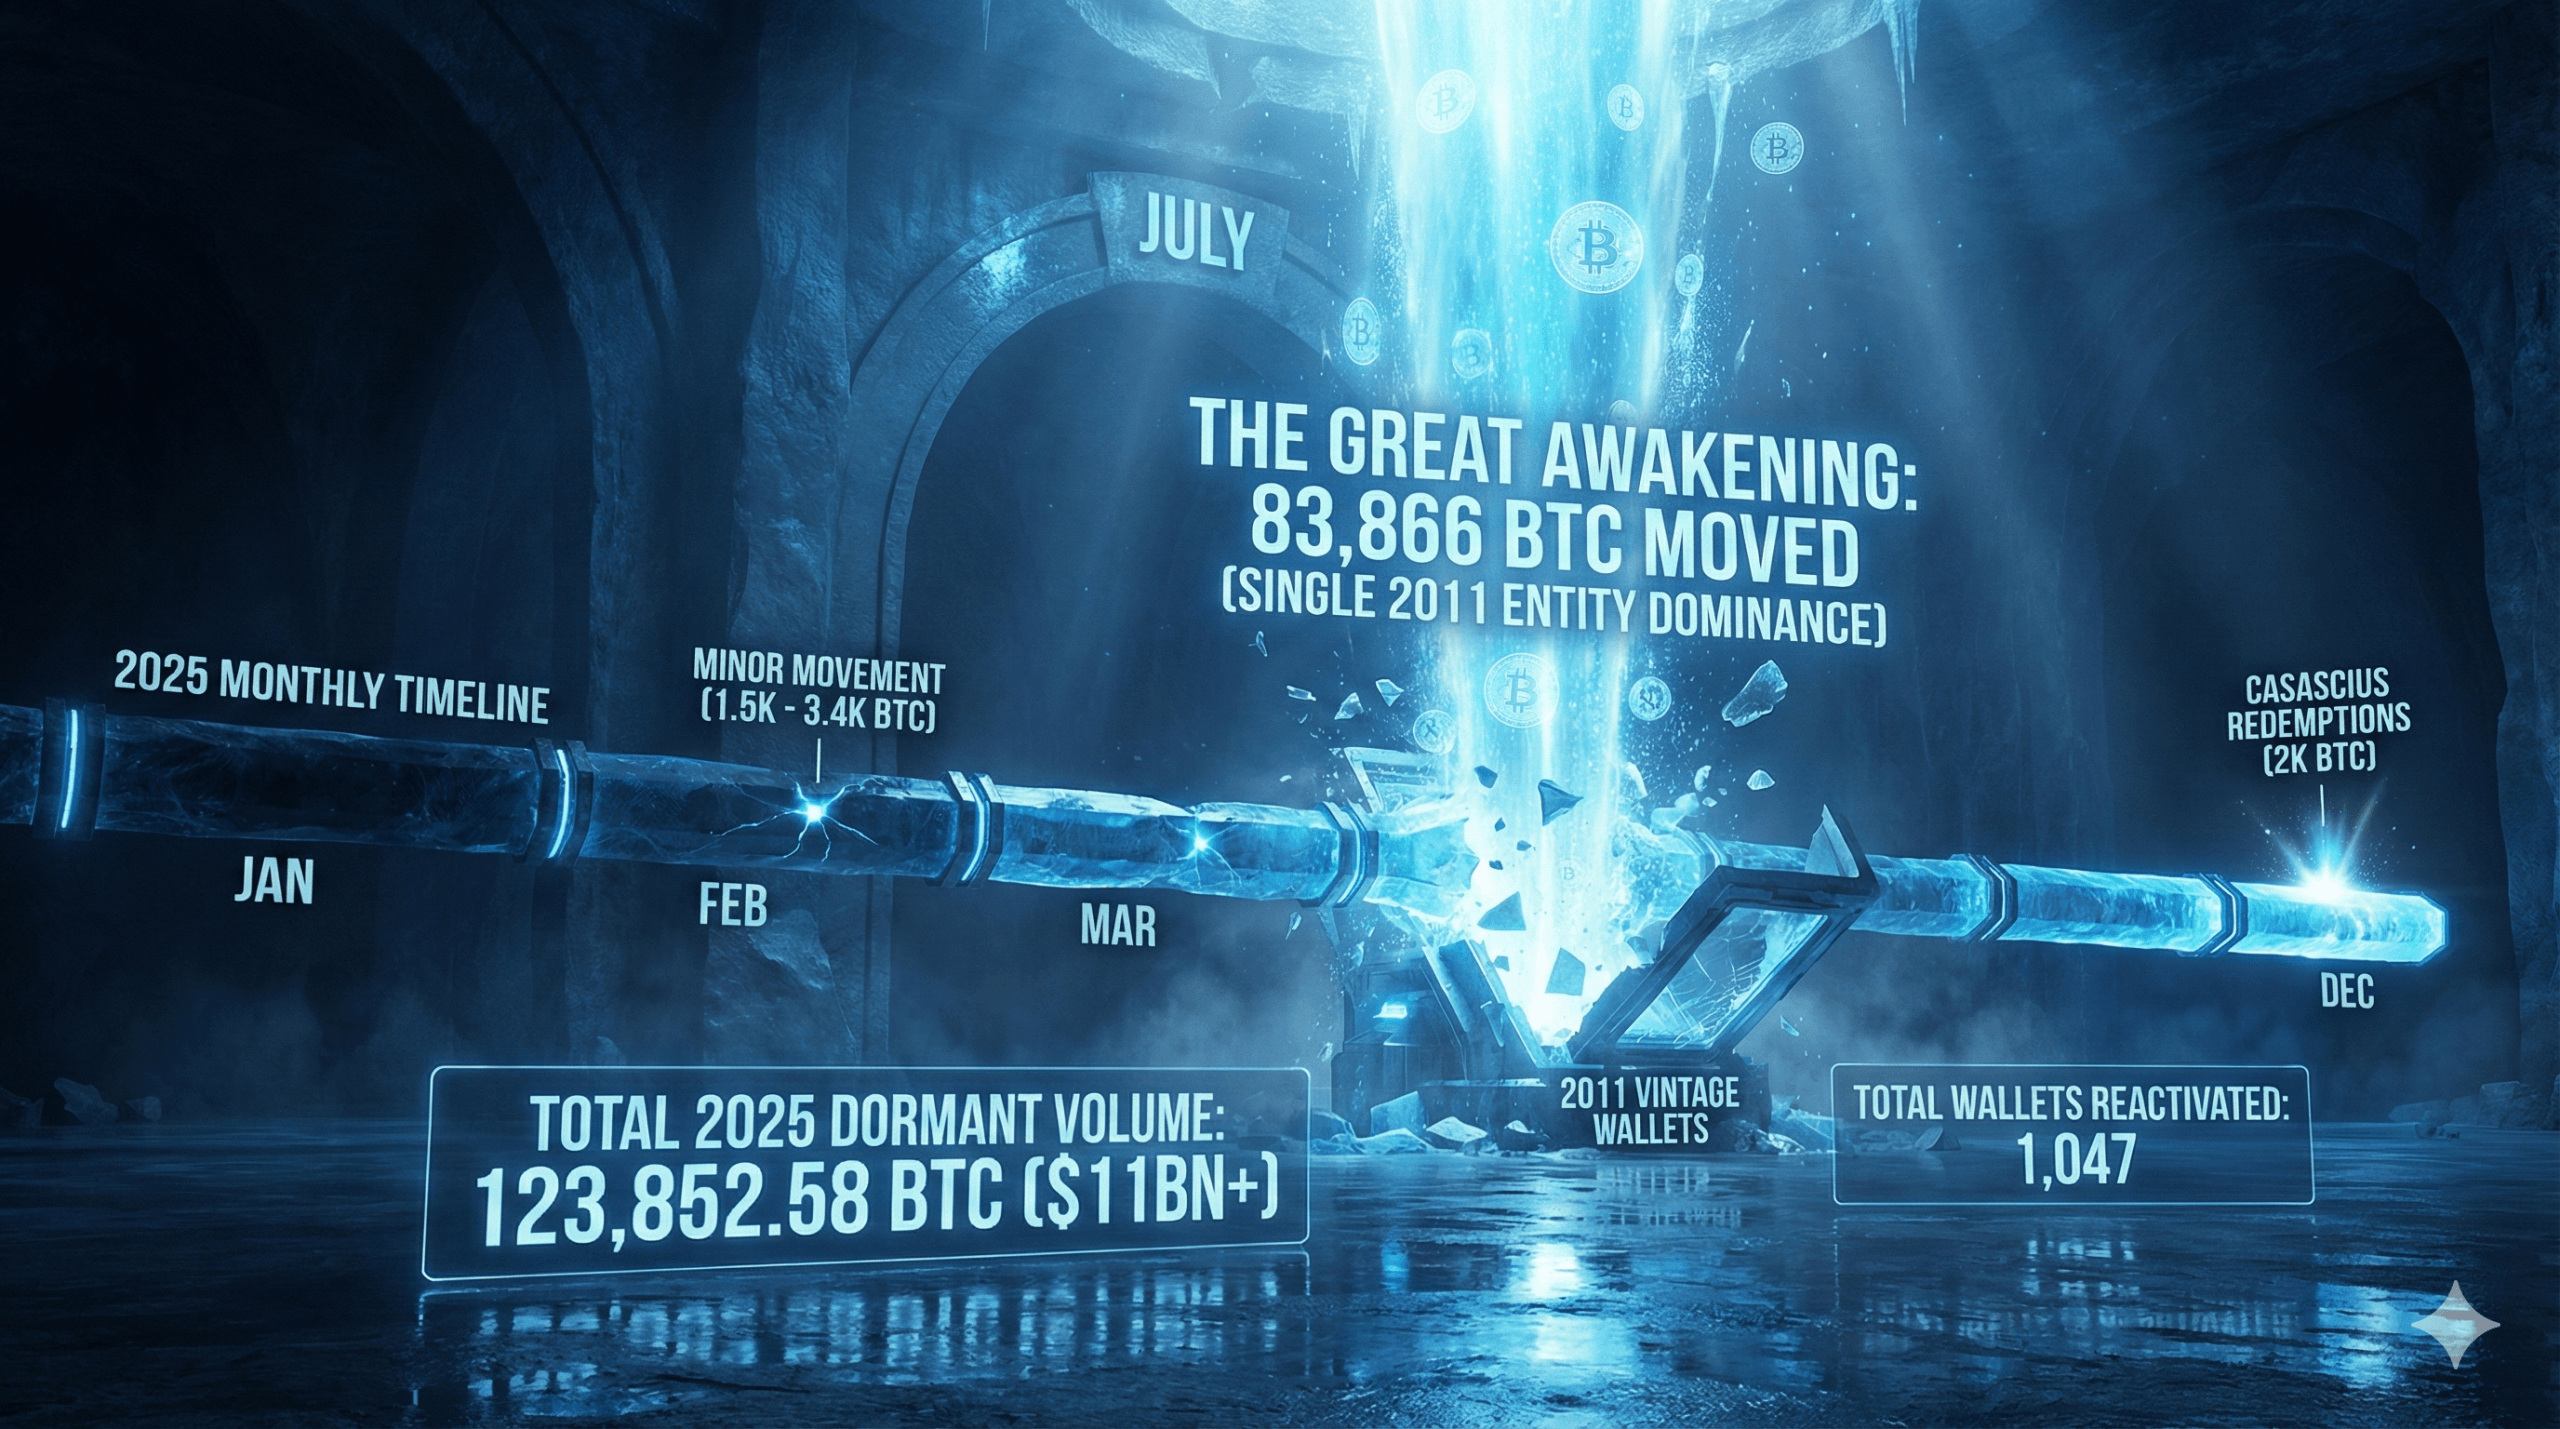
确实,最引人注目的活动发生在 7 月,当时一小群 2011 年创建的钱包转移了超过 80,000 BTC,使这个月成为明显的异常,并占据了 2025 年所有休眠地址支出的约三分之二。后来得知,这一转移源于一位早期采用者,他与 Galaxy Digital 合作,出售曾价值 90 亿美元但现在仅值超过 70 亿美元的持有。
觉醒的比特币供应年
我们对 2025 年的分析基于每月的 Btcparser 记录,这些记录追踪自创建以来一直处于非活动状态的地址所支出的比特币。这些休眠地址的定义是,在出现在数据集中之前从未移动过资金。
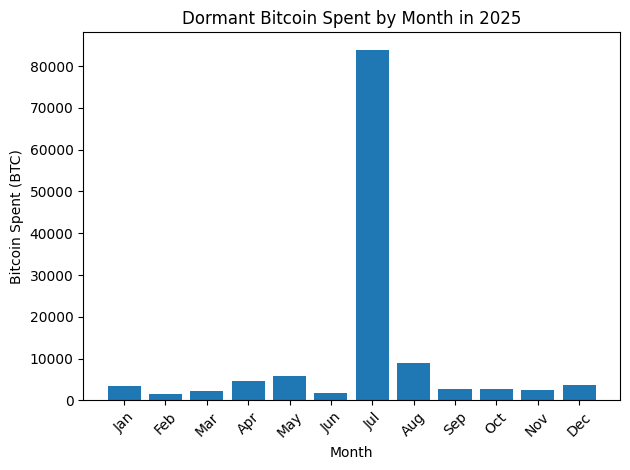
在 2025 年的 12 个月中,解析器识别出 1,047 个变为活跃的休眠钱包,共计支出近 124,000 BTC。每月的总支出差异很大,大多数月份的休眠地址支出在 1,500 BTC 到 6,000 BTC 之间,排除 7 月的异常激增。
1 月以 88 个休眠地址支出的 3,412.52 BTC 开局,而 2 月的活动较低,66 个钱包支出了 1,549.41 BTC。3 月则有 67 个地址支出 2,145.06 BTC,继续保持相对稳定的第一季度模式。
年中加速 culminates in July Spike
4 月和 5 月的活动有所增加,休眠钱包分别支出了 4,681.14 BTC 和 5,798.34 BTC。4 月记录了 100 个重新激活的钱包,而 5 月则有 93 个地址苏醒,支出大部分来自于 2013 年至 2015 年间创建的钱包。
6 月标志着短暂的放缓,43 个休眠地址支出了 1,671.45 BTC。随后是 7 月的前所未有的激增,当时 2010 年至 2017 年间创建的休眠钱包支出了 83,865.75 BTC——超过前六个月的总和。
仅 13 个 2011 年创建的钱包在 7 月就支出了超过 80,056 BTC。其中几个钱包转移的金额在 10,000 BTC 的范围内,极大地扭曲了年度分配。已知的信息有限:一个实体重新配置了大约 80,000 BTC,源自这些 2011 年的钱包,而 Galaxy 促进了这笔交易。
早期钱包主导支出总额
在 2025 年,2011 年至 2014 年间创建的钱包始终占据休眠地址支出最大份额。虽然后来的群体——如 2016 年和 2017 年创建的钱包——定期对每月总额做出贡献,但它们的单笔转移金额通常较小。
2010 年和 2012 年的一些钱包在这一年中也表现突出。2 月,一个 2010 年创建的钱包支出了一个 coinbase 奖励,而 7 月则有五个 2010 年的钱包共同转移了五个价值 250 BTC 的 coinbase 奖励。12 月包括两个 Casascius 时代的实物比特币钱包,通过赎回基础数字资产转移了正好 2,000 BTC。
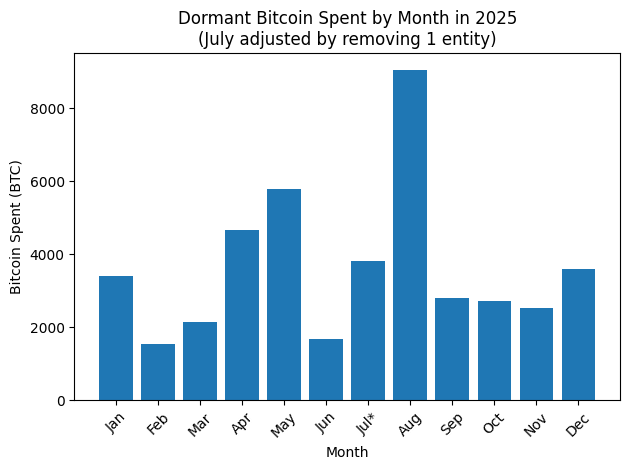
如果那一个支出超过 80,000 BTC 的实体被移除,2025 年的休眠比特币支出将会是什么样子。
这些孤立但大额的转移表明,尽管较新的钱包参与了重新激活事件,但休眠供应在早期比特币采用者中仍然高度集中。
7 月后的活动回归典型范围
在 7 月的异常活动之后,休眠地址的支出回归到更熟悉的水平。8 月记录了 157 个钱包支出的 9,062.74 BTC,这是 2025 年任何月份中重新激活地址的最高数量。
9 月至 11 月,每个月的支出在 2,500 BTC 到 2,800 BTC 之间,60 到 98 个休眠地址变得活跃。10 月的活动因其在创建年份上的相对均匀分布而显得特别,包括来自 2016 年和 2017 年的钱包。
12 月以 60 个休眠钱包支出的 3,607.62 BTC 结束了这一年。最后一个月包括来自早期群体的重要转移,包括两个 Casascius 的赎回。
另请阅读: 比特币能否在 1 月底前重返 10 万美元?8 个 AI 聊天机器人提供截然不同的预测
群体模式揭示不均匀影响
尽管全年有数百个休眠钱包苏醒,但支出模式高度不均。在许多月份,数十个钱包共同贡献了适度的金额,而一个早期钱包则占据了总支出的不成比例份额。
7 月的数据最清楚地说明了这种不平衡,但类似的动态在全年中也出现过,每当 2010 年至 2012 年间创建的钱包变得活跃时。这些群体的偶尔重新激活实质性地改变了每月的总额。
长期休眠的供应仍然是市场因素
去年收集的数据确认,比特币长期休眠的供应中有相当一部分仍然完好无损——并且在移动时能够影响链上活动。尽管重新激活的钱包数量在全年中相对均匀分布,但支出量主要由一小部分遗留地址驱动。
随着比特币的不断老化,这些早期钱包代表了一种独特的供应类别:很少活跃、高度集中,并且在重新出现时能够重塑每月指标。
研究结果强调,即使在十多年后,早期比特币持有者仍对链上支出模式保持显著影响,特别是在休眠供应重新进入流通的时期。
- 什么是休眠比特币地址?休眠比特币地址是指自创建以来从未支出资金,直到再次变得活跃的钱包。
- 2025 年休眠钱包支出了多少比特币?休眠钱包在这一年共支出了 123,852.58 BTC。
- 哪个月份的休眠比特币支出最高?7 月记录了最高总额,支出为 83,865.75 BTC。
- 哪个钱包创建年份主导了支出?2011 年至 2014 年创建的钱包占据了休眠地址支出最大份额。
免责声明:本文章仅代表作者个人观点,不代表本平台的立场和观点。本文章仅供信息分享,不构成对任何人的任何投资建议。用户与作者之间的任何争议,与本平台无关。如网页中刊载的文章或图片涉及侵权,请提供相关的权利证明和身份证明发送邮件到support@aicoin.com,本平台相关工作人员将会进行核查。


