融资利率正在失去增长势头
过去一周,比特币的短期走势已从积极转为明显疲软,而资金费率的变化最能体现这一转变。乍看之下,资金费率仍略微为正——7 天期资金费率为 0.1008%,为期一天 0.0144%,以及当前阅读滑动到 0.0048%通常情况下,这表明多头头寸仍然占据主导地位。然而,趋势比静态快照更为重要。每个时间框架都显示出明显的减速,表明看涨情绪正在减弱而非增强。
这种动能变化并不一定意味着市场转为熊市;相反,它表明多头力量有所减弱,而空头积极性并未相应上升。要了解这种热情下降是结构性的还是暂时的,就必须关注第二个主要指标:未平仓合约量。
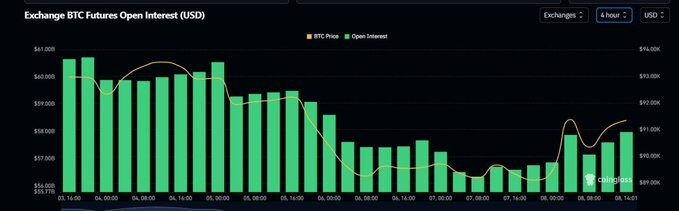
未平仓合约显示市场缺乏方向
未平仓合约量 (OI) 直接反映了市场中仍有多少资金处于活跃状态,无论是多头头寸还是空头头寸。近期图表显示,随着多空双方逐步平仓,未平仓合约量呈下降趋势。在最近一次下跌之后,仓位仅出现轻微补充,远未达到发出新的方向性押注信号。
这种模式类似于一个市场,它既没有足够的信心追逐上涨,也同样不确定是否要承担新的下跌风险。当双方的行动没有明显的区别时,几乎不可能分辨出谁在主导市场。
这种犹豫不决正是开放式投资所反映的:市场在等待催化剂,不愿做出承诺,目前选择降低风险而不是承担风险。
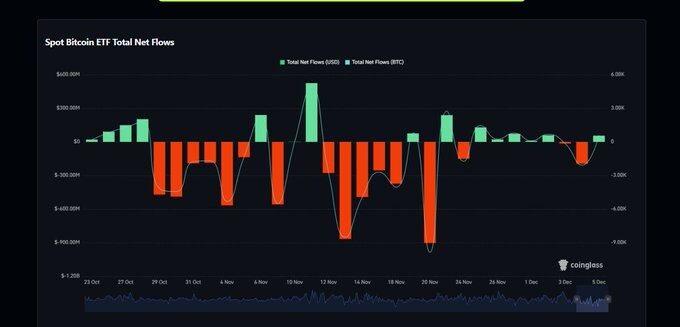
ETF 资金流动未能提供支撑
如果说有什么指标能够改变短期走势,那非 ETF 资金流动莫属。这些产品一直以来都在影响着比特币的中期趋势,而每日净流入和净流出往往是反应灵敏的短期信号。
然而,过去一周的数据显示,ETF 资金流动几乎为零。尽管技术上资金流入仍为正值,但规模太小,几乎无法构成真正的支撑。实际上,ETF 并未参与价格形成过程。
在市场方向性判断不明朗的时期,新增需求的缺乏尤为重要。当资金减少、未平仓合约停滞不前、ETF 退出市场时,价格走势将主要受订单簿而非新增资金的影响。这种转变解释了为何日内价格波动越来越类似于流动性驱动的波动,而非趋势驱动的上涨行情。
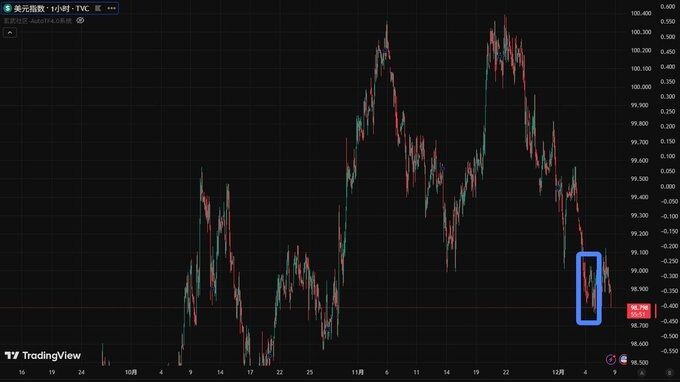
DXY 提供支持,但力度不够
美元指数 (DXY) 近期的走势通常对比特币有利。当美元走弱或在低位盘整时,比特币往往会受益于这种反向关系。事实上,比特币本周早些时候的坚挺部分原因就在于此。
然而,即便美元走强也无法抵消加密货币相关指标的内部疲软。12 月 5 日之后,美元指数(DXY)进入震荡阶段,削弱了反向信号的清晰度。与此同时,资金、持仓和 ETF 资金流动的恶化对市场情绪的影响,远超宏观经济环境带来的任何微弱利好。
因此,虽然美元指数解释了为什么比特币没有大幅下跌,但它本身并不能扭转这种越来越倾向于短期温和疲软的结构。
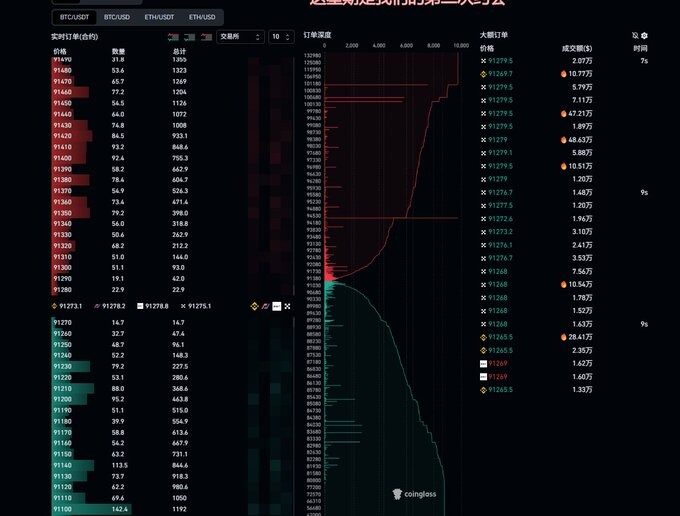
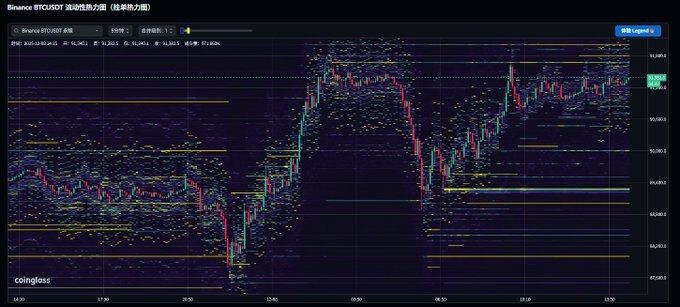
订单簿流动性显示抛售压力过大
下一个关键信息来自订单簿动态。实时流动性显示,买方深度相对较弱;目前价位上没有明显的强买盘集群提供有效支撑。与此同时,卖方压力则更为显著。
在热图数据中,这种不平衡现象更加明显。91,800 和 92,200 密集的卖盘流动性区域构成了一道明显的上方障碍。相比之下,买盘兴趣最集中的区域则明显更低——大约在……附近。89,400 此处出现一道巨大的流动性障碍。
这种形态形成了一个清晰的交易通道:上方是阻力位,下方是支撑位,如果没有新的资金注入,市场几乎没有动力突破这两个边界。由于多头资金正在减少,ETF 也没有介入,向上突破的可能性降低。相反,89400 点附近的强劲流动性增加了需求吸收的可能性,如果价格走低,短期内可能会出现反弹。
短期结构:多头疲软,空头被动
综合所有信号——资金、未平仓合约量、ETF 资金流动、美元指数、订单簿深度和热力图位置——比特币目前的走势结构可以概括为:
“上行压力受限,下行支撑,但短期内仍偏向看跌。”
这并非崩盘,也不像是趋势急剧反转的开始。相反,它反映出市场难以延续涨势。多头力量不足以推高价格,空头力量也不足以引发决定性的崩盘。ETF 资金流入的缺失尤为重要,因为在本轮周期中,可持续的上涨行情几乎总是需要机构需求的持续推动。
换句话说,市场疲软、犹豫不决,而且越来越机械化——驱动力不是叙事或资本流动,而是流动性缺口和被动订单行为。
为什么下一个宏观催化剂至关重要
即将召开的降息会议可能会给比特币带来一些短期波动,但即使是其潜在的上涨影响也应谨慎解读。流动性依然紧张,市场情绪似乎有些疲软。
即使鸽派信号带来暂时的缓解,整体环境也不会在一夜之间发生转变;结构性需求仍需重新发挥作用。更有意思的情况是,如果市场认为结果令人失望。在这种情况下,市场情绪可能会迅速转变,打破当前的僵局,并带来更清晰的走向——或许是向下,因为目前阻力最小的方向正是向下。
矛盾的是,一个失败的“好消息”事件可能恰恰会结束近期的横盘整理局面。
构建结构化评级模型
鉴于当前信号的分散性,构建一个针对短期、中期和长期指标的系统性评分模型变得越来越重要。每个指标——融资利率、未平仓合约量、ETF 资金流动、宏观因素、流动性集中度、热力图水平——都根据时间跨度的不同而具有不同的权重。
在 7 天展望中,短期结构指标,例如热力图流动性或日内未平仓合约变动,应占据更重要的权重。中期分析则必须更多地依赖 ETF 持仓和宏观趋势。长期预测则需要考虑结构性需求、监管政策的清晰度以及供应侧因素,例如减半和更广泛的应用。
通过合理的评分分布,比特币的行为可以从主观解读转变为量化分析。目前的配置在短期尺度上得分略低:并非完全看跌,但由于多头兴趣减弱、ETF 参与度极低以及流动性阻力明显,整体趋势略微下行。
免责声明:本文章仅代表作者个人观点,不代表本平台的立场和观点。本文章仅供信息分享,不构成对任何人的任何投资建议。用户与作者之间的任何争议,与本平台无关。如网页中刊载的文章或图片涉及侵权,请提供相关的权利证明和身份证明发送邮件到support@aicoin.com,本平台相关工作人员将会进行核查。


