As a seasoned individual in the cryptocurrency space, I have been deeply involved in this captivating and challenging industry for many years. Having experienced the numerous ups and downs of the crypto market and witnessed the rise and fall of countless cryptocurrencies, I have accumulated rich practical experience and unique market insights. Investing is a long-term practice, and this is especially true in the cryptocurrency space. Continuous learning and enhancing one's cognitive and judgment abilities are essential to navigate this challenging field steadily.
Currently, the price of Bitcoin is reported at $90,150. As of 9 AM Beijing time, the market has been consolidating for the entire day. Since breaking below the $100,000 mark, the volatility has significantly narrowed, and it is expected to oscillate back and forth over the next week, returning to a normal trend overall.
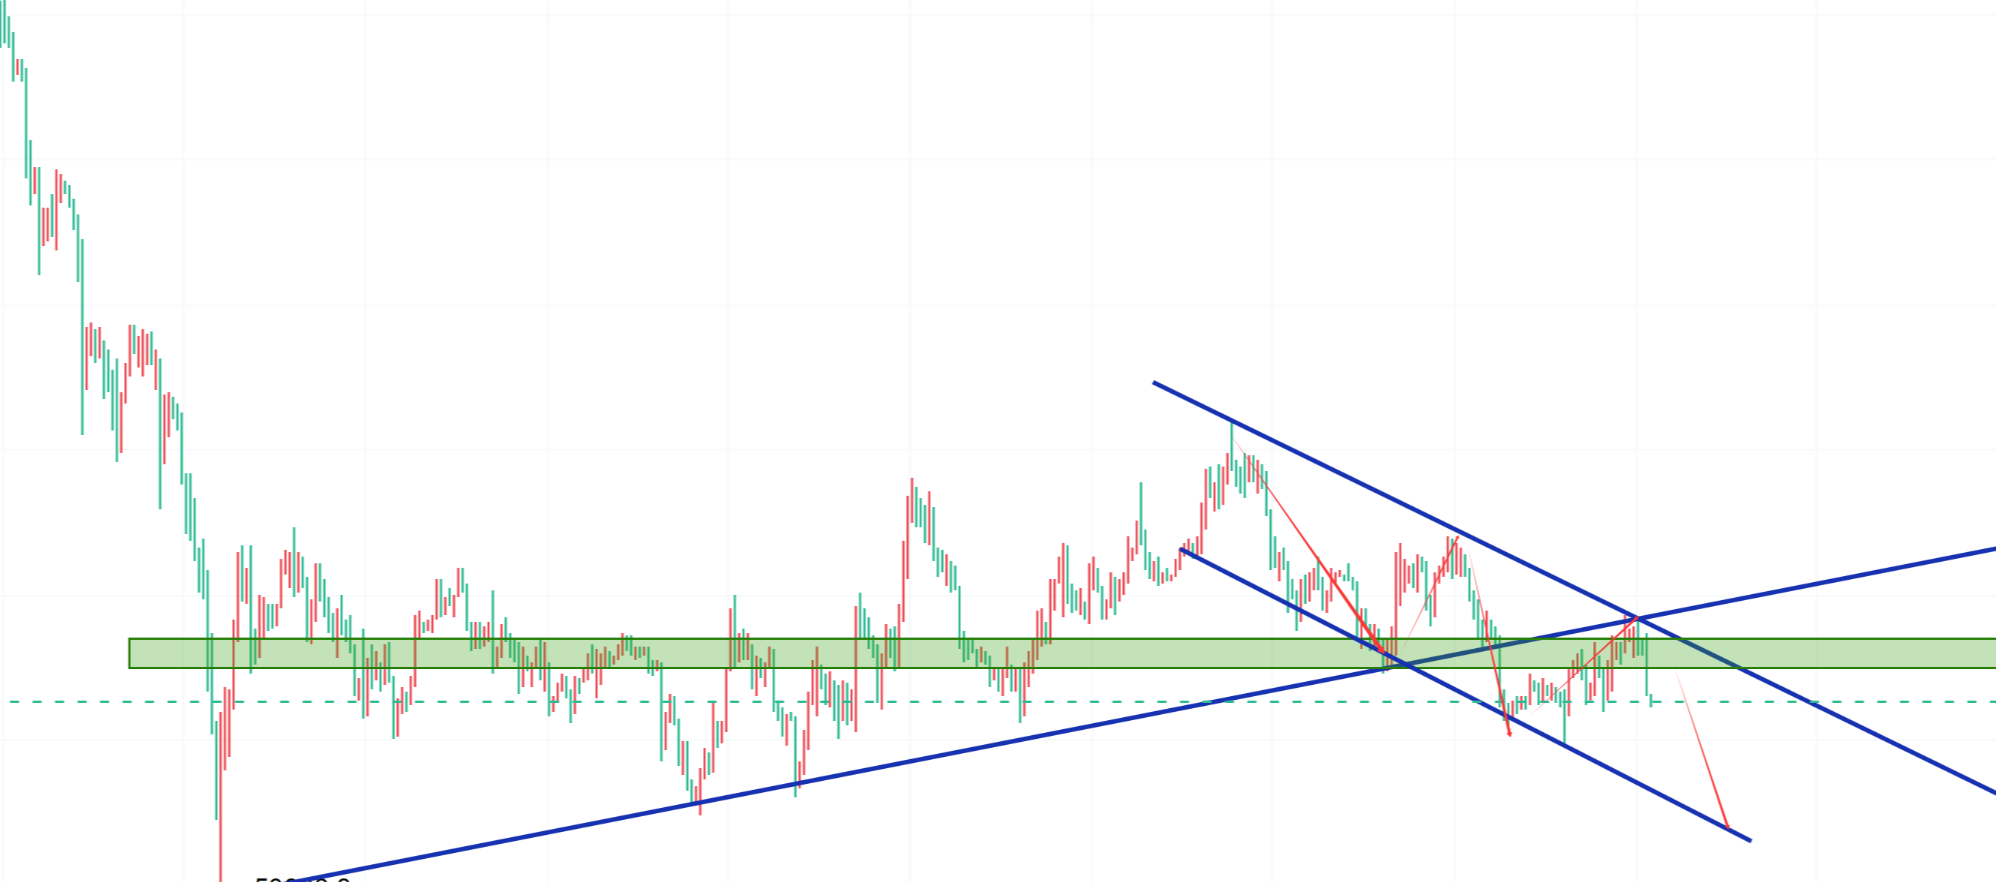
On the daily K-line chart, the highest price before publication reached $88,200, while the lowest dipped to $86,260. The EMA trend indicator continues to point downward, and the bearish pattern remains unchanged. The MACD indicator shows a bottom divergence, with the volume gradually easing. The K-line pattern is contracting, and the DIF and DEA lines are narrowing, indicating potential signs of a golden cross; the lower Bollinger Band is still moving downward, and the main force has yet to clarify its directional choice.
The four-hour K-line shows a symmetrical triangle contraction pattern, with the EMA15 and EMA30 moving averages continuously converging around the $87,200 level; the MACD indicator's volume continues to decrease, with the DIF and DEA lines hovering near the zero axis, potentially leading to an upward trend at any moment; the Bollinger Band has contracted to a very narrow range, with upper resistance focusing around $90,000 and lower support concentrating at the $85,200 position, indicating a clear pressure situation in the oscillation range.
Short-term trading reference for Bitcoin:
Long position layout: Go long in the range of $86,000 to $85,500, with a stop loss of 500 points, targeting $87,000 to $87,500 and $88,500.
Short position layout: Go short in the range of $91,000 to $91,500, with a stop loss of 500 points, targeting $90,000, $89,000, and $88,000.
Short-term trading reference for Ethereum:
Short position layout: Go short in the range of $3,030 to $3,080, with a stop loss of 50 points, targeting $2,970, $2,920, and $2,820.
Long position layout: Go long in the range of $2,820 to $2,770, with a stop loss of 50 points, targeting $2,880, $2,940, and $3,040.
Disclaimer: The above analysis represents the author's personal views and does not constitute specific trading advice. Trading based on this information is at your own risk. Investment involves risks; please proceed with caution.

Friendly reminder: The above content is solely created by the author of the public account. The advertisements at the end of the article and in the comments section are unrelated to the author. Please discern carefully. Thank you for reading.
免责声明:本文章仅代表作者个人观点,不代表本平台的立场和观点。本文章仅供信息分享,不构成对任何人的任何投资建议。用户与作者之间的任何争议,与本平台无关。如网页中刊载的文章或图片涉及侵权,请提供相关的权利证明和身份证明发送邮件到support@aicoin.com,本平台相关工作人员将会进行核查。