In the past three weeks, the cryptocurrency market has been experiencing a silent liquidity crisis. The Coinbase premium index is deeply negative, Bitcoin ETFs are facing the largest capital outflow in history, and exchange reserves continue to decline—these three key indicators are all flashing red, revealing the harsh reality that institutional funds in the U.S. are withdrawing on a large scale.

1. Alarm Raised: Three Key Indicators Deteriorate Simultaneously
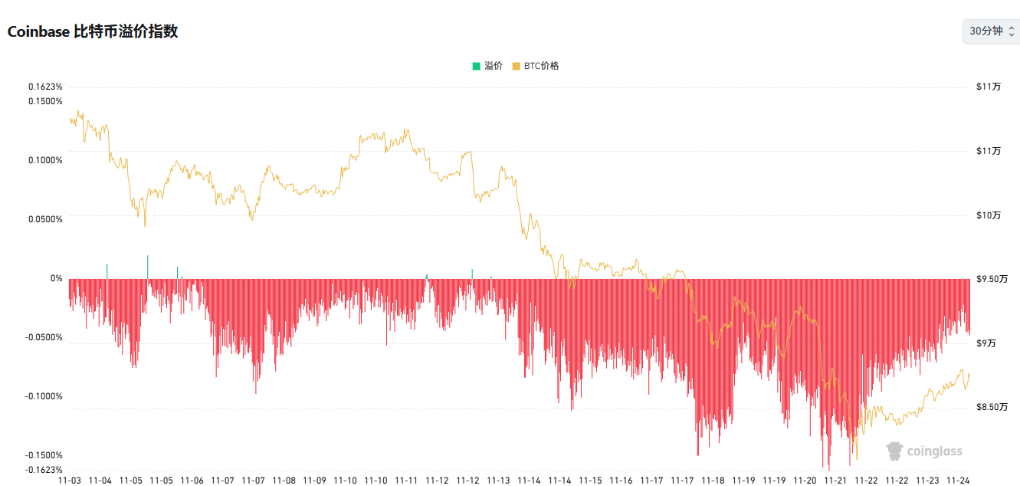
Coinbase Premium Index
The Coinbase Bitcoin Premium Index measures the deviation of Bitcoin prices on Coinbase (a mainstream compliant exchange in the U.S.) compared to the global market average, serving as an important barometer for observing U.S. fund flows.
When the Coinbase price is higher than the global average (positive premium), it usually indicates strong buying pressure in the U.S. market, with institutions or dollar funds actively entering and risk appetite recovering; when the index is negative, it means increased selling pressure, cooler sentiment, or capital outflow.
Historically, the prolonged positive premium during the 2020–2021 bull market reflected continuous institutional buying, while the frequent negative premiums during the 2022–2023 bear market corresponded to panic selling. By 2024–2025, this indicator is still widely used to compare the strength and sentiment differences between the "U.S. vs. Asian markets," making it an indispensable reference in cryptocurrency market analysis.
● As a core barometer for observing U.S. institutional fund flows, the Coinbase Bitcoin Premium Index has remained in negative territory for 24 consecutive trading days since October 31. This is the first occurrence this year.
● A deeply negative premium indicates that Bitcoin prices on Coinbase are consistently lower than the global average, suggesting that U.S. professional investors are not bottom-fishing but are instead continuously reducing positions or engaging in hedging trades.
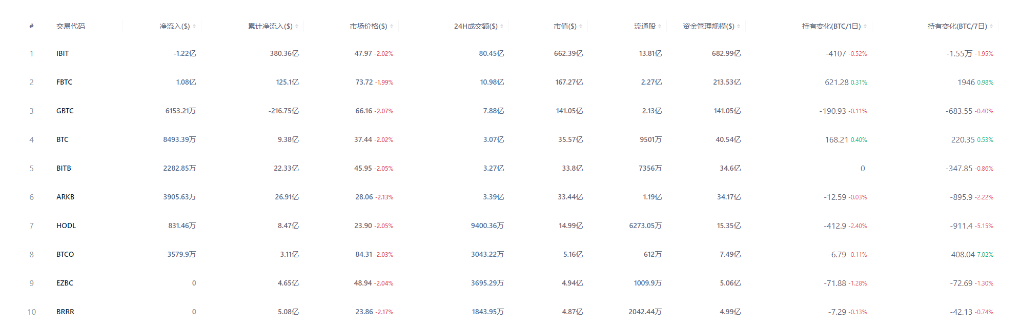
Bitcoin ETF: A Historic Record of $3.8 Billion Net Outflow in a Single Month
● U.S. Bitcoin spot ETFs are undergoing the most severe test since their approval for listing in January. As of November 21, the total net outflow from all Bitcoin ETFs in November has reached $3.79 billion, breaking the previous record of $3.56 billion set in February.
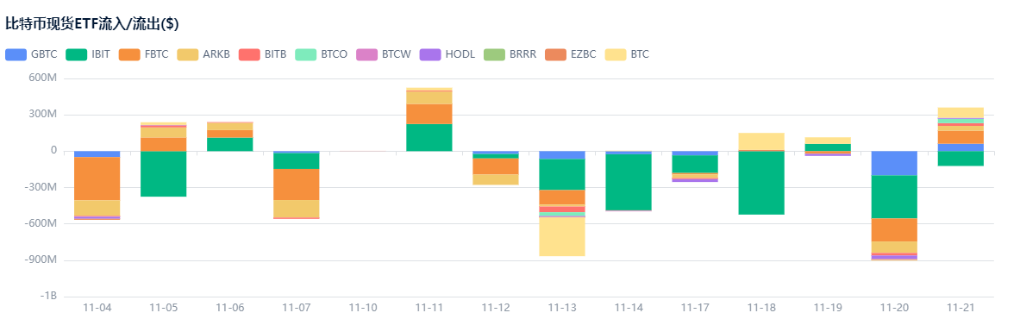
● Among these, BlackRock's IBIT fund saw a net outflow of $2.47 billion in a single month, and Fidelity's FBTC had a net outflow of $1.09 billion, with the two giants accounting for 91% of the total net outflow. On November 20, all Bitcoin ETFs recorded a $903 million net outflow in a single day, the second highest in history.
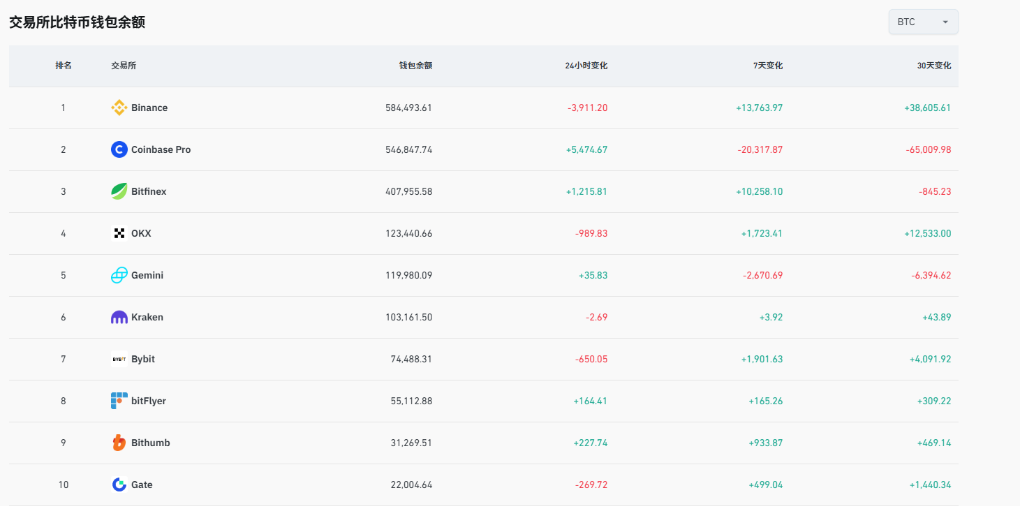
Exchange Reserves: A Long-term Trend of 18% Decline in Total Reserves
● CEXs reduced their holdings by approximately 8,181 BTC in November compared to October, valued at about $842 million. More macro data shows that the total Bitcoin reserves across all centralized exchanges have decreased by about 18% from the levels at the end of 2024, currently slightly above 2.4 million BTC.
This ongoing "bleeding" state indicates that investors are transferring assets from exchanges to private wallets or other investment channels, gradually draining liquidity from the exchanges.
2. Chain Reaction: Market Structure is Changing
● Lack of Momentum During Trading Hours
The continued negative Coinbase premium directly affects Bitcoin's performance during different trading hours. Due to the lack of institutional buying support during U.S. trading hours, price rebounds appear particularly weak. Market analysts have noted that recent Bitcoin price increases mainly come from Asian and European trading hours, while the U.S. market has become a drag.
● Disappearance of Structural Buying from ETFs
Bitcoin spot ETFs were originally the most important source of structural buying in the market, but they have now turned into net sellers. At the current outflow rate, the average daily net outflow from ETFs far exceeds the daily output of about 450 BTC from miners, indicating that the market is accumulating positive net supply, which continuously suppresses prices.
● Increased Liquidity Layering
Against the backdrop of widespread outflows, different exchanges are showing significant differentiation. Platforms dominated by institutions, such as Coinbase and Kraken, are experiencing the most severe outflows, while Binance, which attracts retail users, is playing a role as a "buyer of last resort" to some extent. This liquidity layering may lead to persistent price discrepancies for the same asset across different platforms, increasing arbitrage opportunities while also raising trading costs.
3. In-depth Analysis: Who is Withdrawing? Why are They Withdrawing?
Tactical Adjustments by U.S. Institutions
From the data distribution, this round of capital withdrawal is clearly dominated by U.S. institutions. This may be the result of multiple driving factors:
● Year-end Rebalancing Pressure: As the end of the fourth quarter approaches, some funds choose to take profits or reduce their allocation to risk assets.
● Macroeconomic Uncertainty: Rising U.S. Treasury yields and a stronger dollar, among other traditional financial market factors, prompt a reallocation of funds.
● Increased Regulatory Concerns: Recent enforcement actions by the U.S. Securities and Exchange Commission against several cryptocurrency companies have heightened institutions' concerns about compliance risks.
Leading Indicators of Smart Money
Historical data shows that the Coinbase premium index has a leading relationship with Bitcoin price movements. When the premium is deeply negative, it often signals that a short-term price bottom is approaching. Similar patterns have been observed in historical cycles such as 2019 and 2022—institutions exhibit extreme pessimism in localized bottom areas, followed by market rebounds.
Capital Diversion in the On-chain Ecosystem
Not all funds flowing out of exchanges are leaving the market. A significant portion of Bitcoin has flowed into the decentralized finance (DeFi) ecosystem, participating in staking, providing liquidity, or engaging in lending. On-chain data shows that the amount of Bitcoin locked in DeFi protocols has reached a historical high, indicating that funds are merely seeking higher-yielding application scenarios.
4. Market Impact: A Game of Opportunities Amidst Crisis
1. Short-term Pain and Long-term Benefits
The continuous decline in exchange reserves, while suppressing prices in the short term, is a healthy signal in the long run. Most of the withdrawn Bitcoin has entered a long-term storage state, reducing the market's floating supply. Once demand warms up, a minimal buying pressure could trigger a significant price increase, creating what is known as a "supply shock."
2. Risk Accumulation in the Derivatives Market
While funds are flowing out of the spot market, the funding rates for perpetual contracts remain relatively high, indicating that leveraged long positions have not completely exited. This divergence between weak spot performance and strong derivatives performance increases the risk of a liquidation cascade. If prices experience significant fluctuations, it could trigger a chain of liquidations.

3. Transition of New and Old Capital
The current market is in a transitional phase between new and old capital. Early profit-taking U.S. institutions are exiting, while new funds—whether from Asian capital or long-term allocations from traditional financial institutions—have yet to enter on a large scale. This state of transition is a typical characteristic of the market bottoming phase.
5. Future Outlook: When Will the Turning Point Appear?
1. Key Observational Signals
Stabilization in the market requires attention to several key signals:
● Coinbase Premium Index Turning Positive: This is the most direct evidence of a recovery in U.S. institutional demand.
● Slowing ETF Capital Outflows: When daily net outflows drop below $100 million, it may indicate that selling pressure is nearing its end.
● Positive Net Inflows to Exchanges: Sustained net inflows usually signal the formation of a price bottom.
2. Potential Catalysts
The following factors may serve as catalysts for a market turning point:
● December FOMC Meeting: If the Federal Reserve releases clear dovish signals, it may reignite risk appetite.
● Institutional Quarterly Reports: The Bitcoin holdings disclosed by large publicly traded companies in their Q4 earnings reports may influence market sentiment.
● Technical Breakthroughs: If the price can effectively break through the previous high of $68,000, it will disrupt the current downtrend and attract trend traders.
3. Lessons from Historical Cycles
From the perspective of Bitcoin's halving cycles, we are currently in the 18th month after the third halving. Historical data shows that this phase is often accompanied by intense volatility and adjustments in institutional holdings, but it is also a critical period for accumulating energy for the next major upward wave.
Historical experience indicates that the darkest moments often give birth to the greatest opportunities. When the Coinbase premium index returns to positive territory, when ETF funds resume net inflows, and when exchanges begin to show sustained net inflows, the market's spring may not be far away. For rational investors, the key now is not to be blindly pessimistic but to closely monitor these key indicators' changes, seeking the flame of hope amidst the market's icy sentiment.
Join our community to discuss and grow stronger together!
Official Telegram community: https://t.me/aicoincn
AiCoin Chinese Twitter: https://x.com/AiCoinzh
OKX Benefits Group: https://aicoin.com/link/chat?cid=l61eM4owQ
Binance Benefits Group: https://aicoin.com/link/chat?cid=ynr7d1P6Z
免责声明:本文章仅代表作者个人观点,不代表本平台的立场和观点。本文章仅供信息分享,不构成对任何人的任何投资建议。用户与作者之间的任何争议,与本平台无关。如网页中刊载的文章或图片涉及侵权,请提供相关的权利证明和身份证明发送邮件到support@aicoin.com,本平台相关工作人员将会进行核查。


