XRP Teeters on the Edge: $2.16 Support Stands Between Rebound and Ruin

CN
1 hour ago

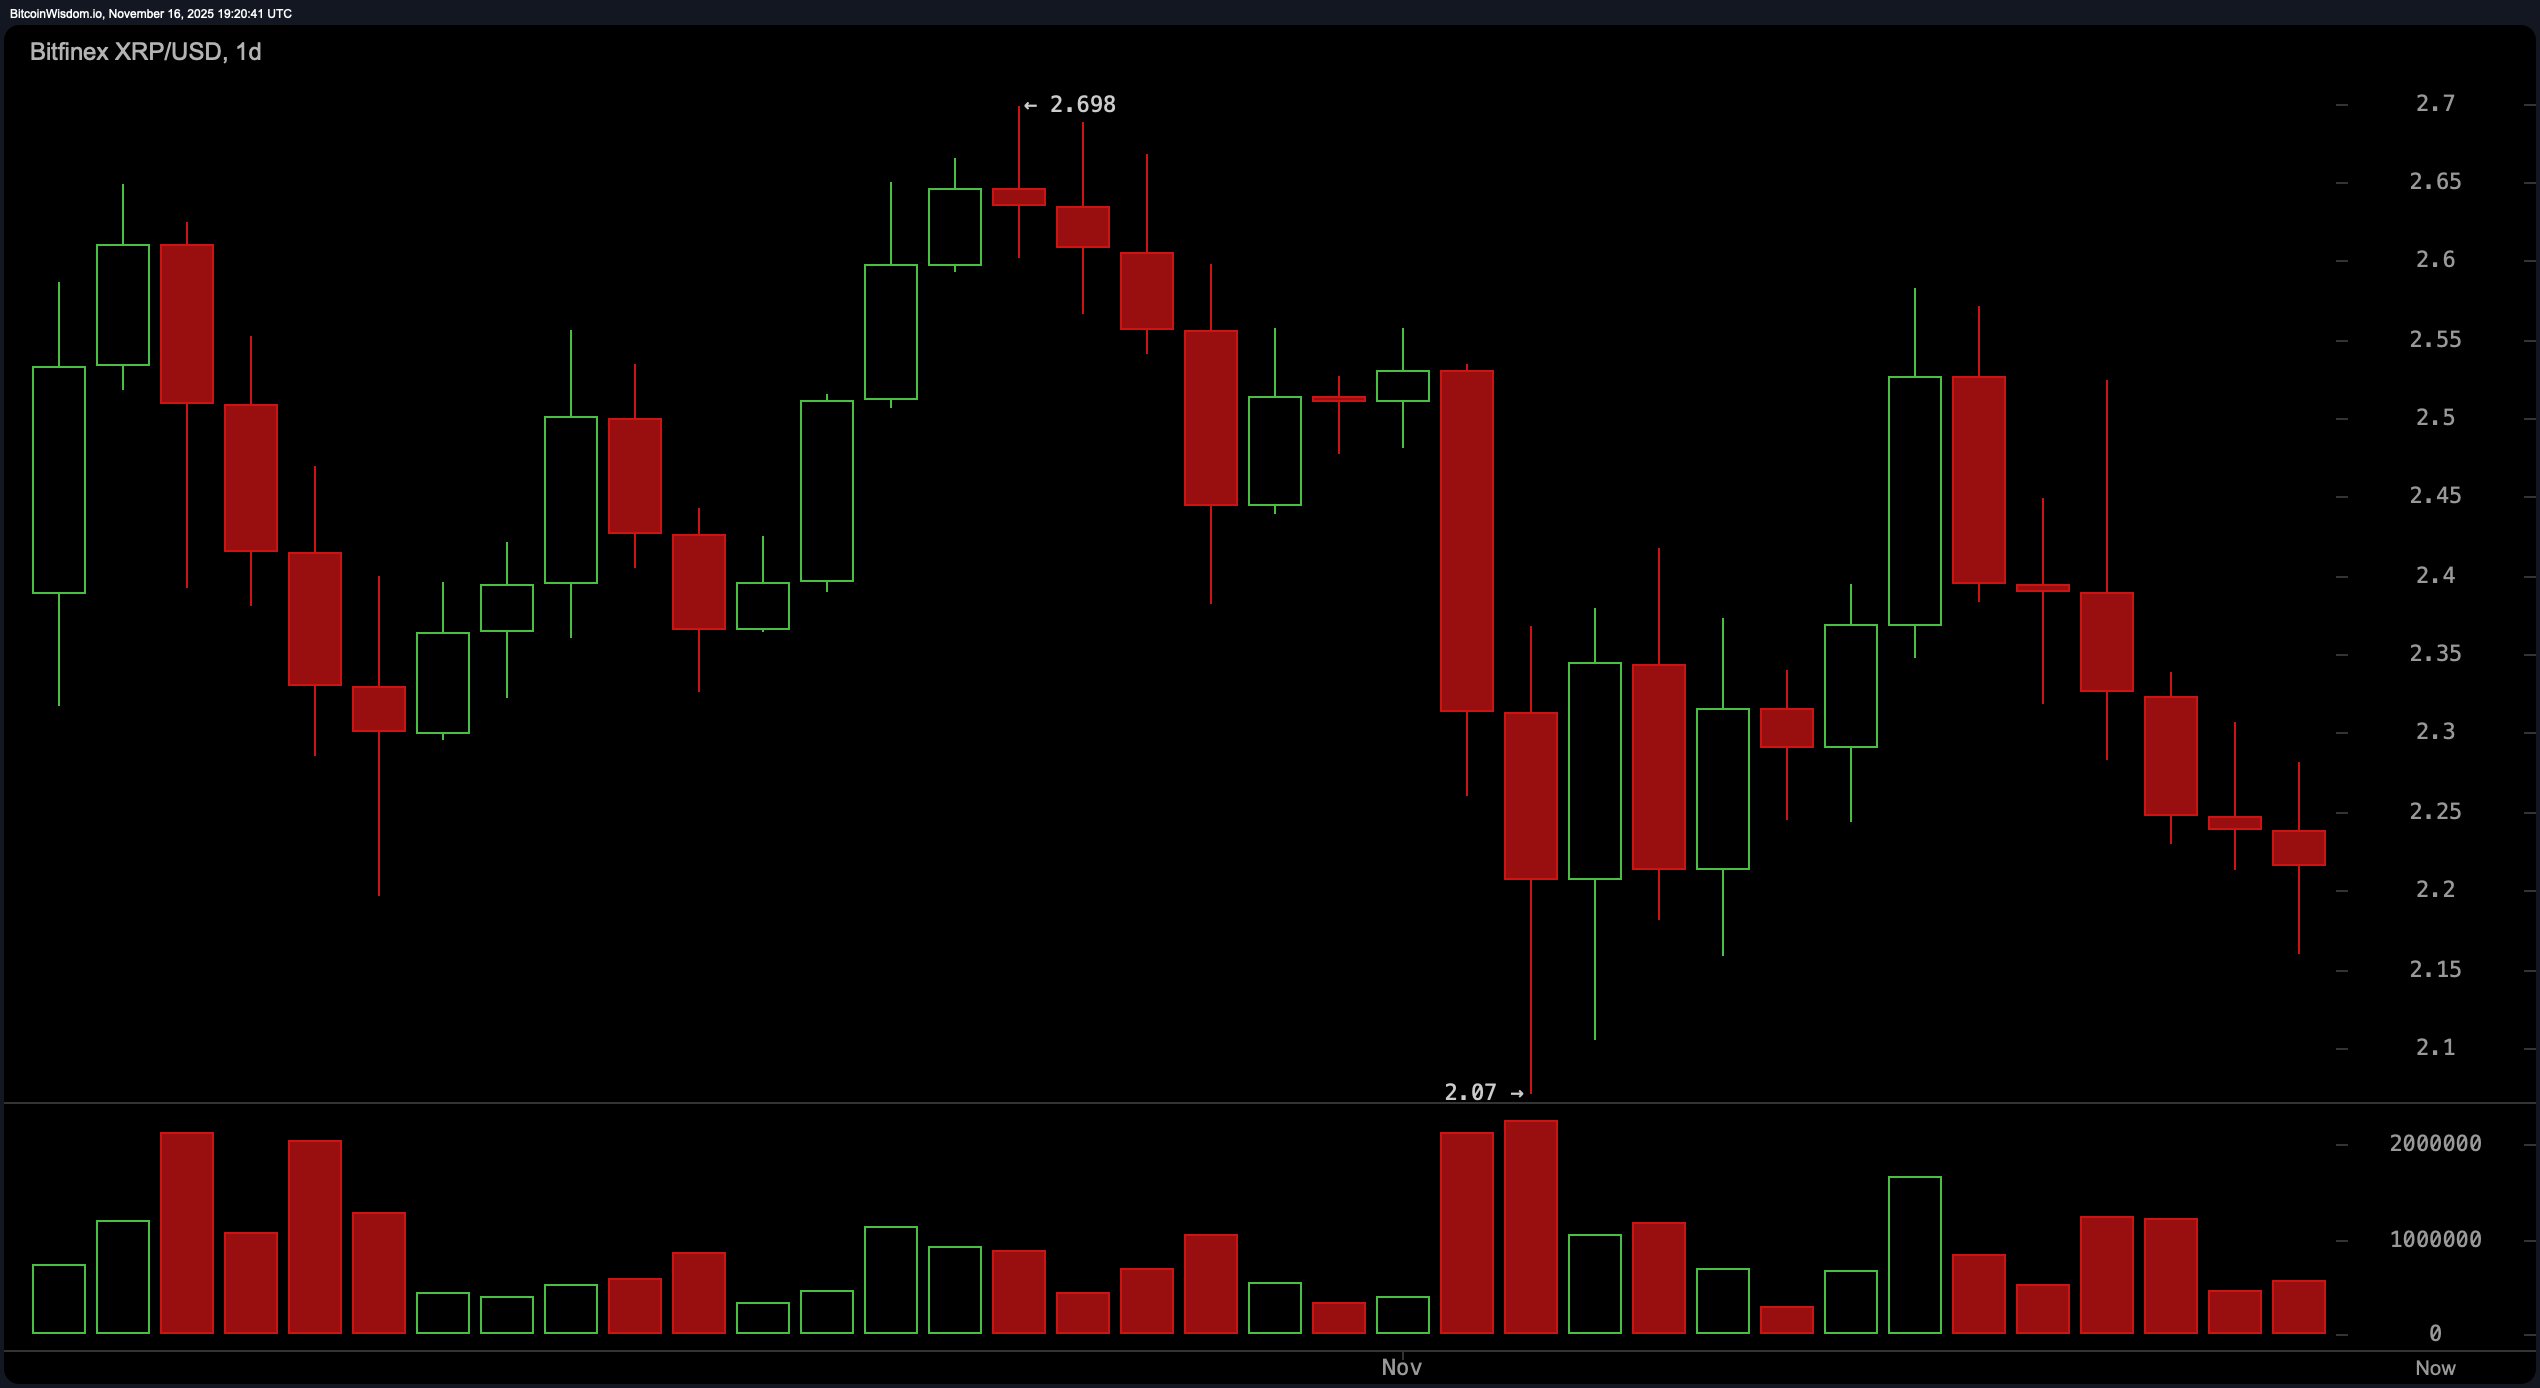
On the daily chart, the trajectory screamed caution. After topping out at $2.698, XRP shifted into a textbook downtrend with a parade of lower highs and even lower lows. The attempted rebound was swatted away with conviction, suggesting buyers are outnumbered and overpowered.

Volume spikes during the dip to $2.07 signal more fear than fundamentals, and the red candles—those relentless, pitiless red candles—highlight that momentum remains firmly in favor of the bears.

XRP Teeters on the Edge: $2.16 Support Stands Between Rebound and Ruin

XRP/USD 1-day chart via Bitfinex on Nov. 16, 2025.

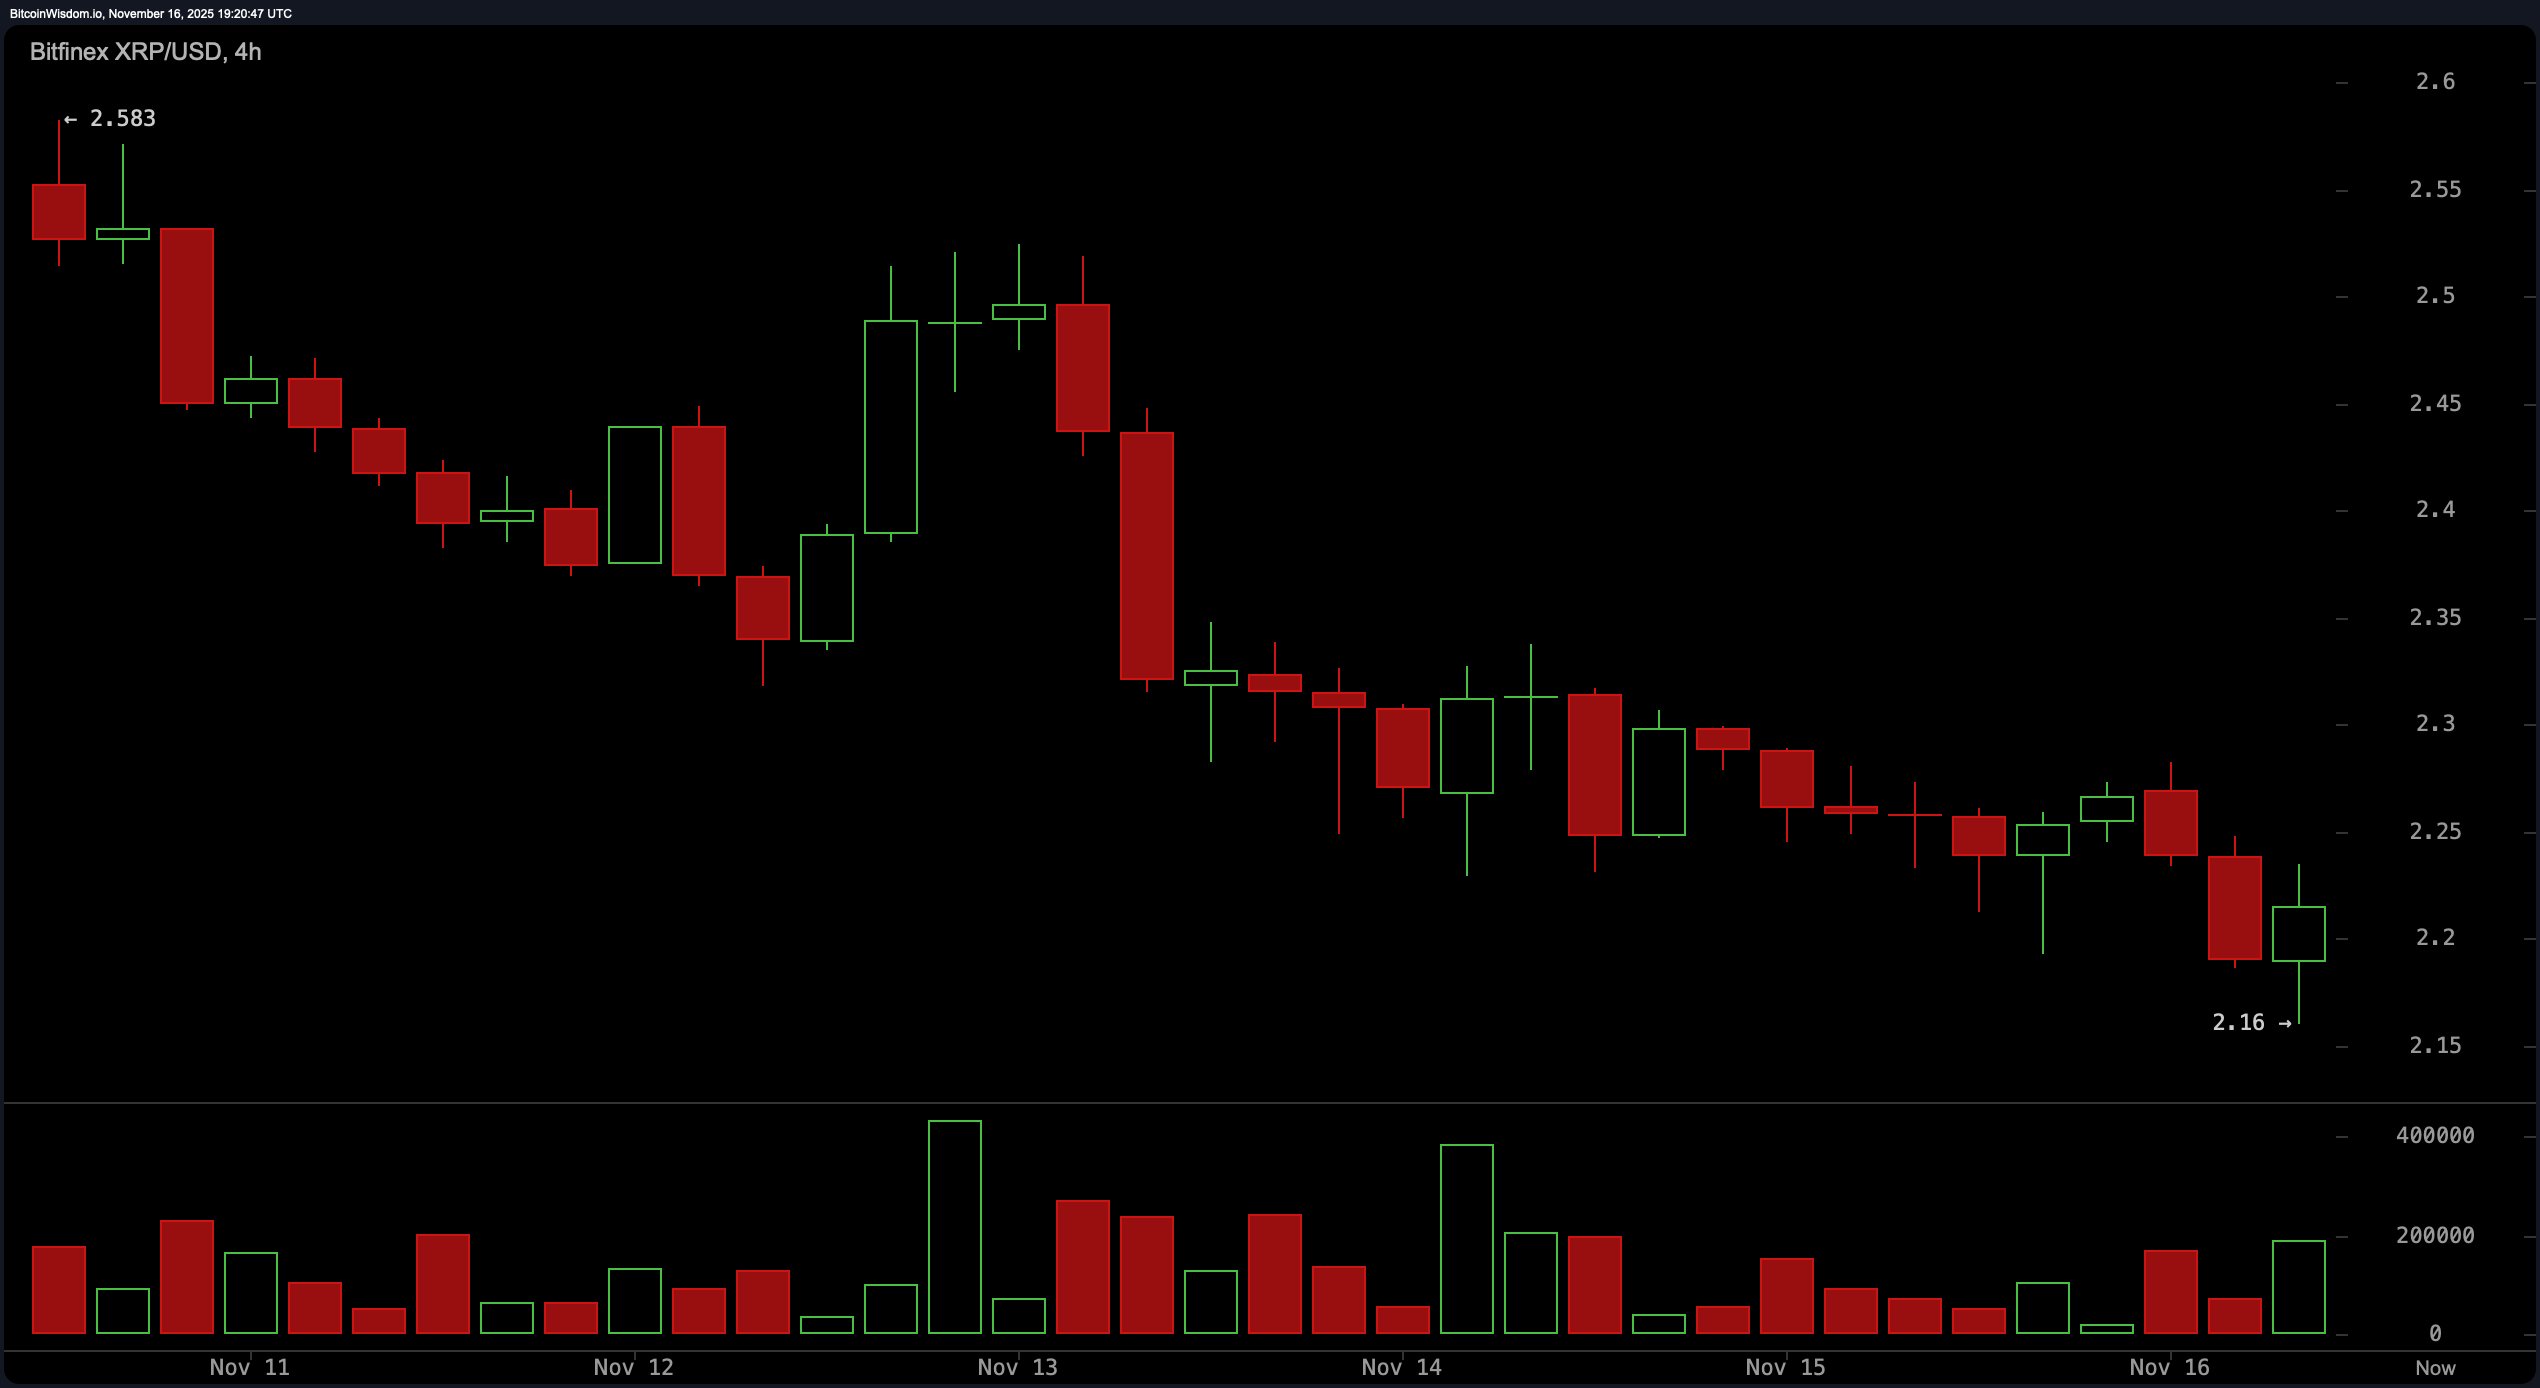
Zooming into the four-hour chart didn’t improve the outlook much. XRP hit $2.583 and has been sliding in a well-defined bearish channel ever since. The last glimmer of support appeared at $2.16, aligning with hourly data, but volume tells the real story: buyers appear more curious than committed. Without a solid thrust above $2.30 to $2.35, that channel isn’t breaking anytime soon.

XRP Teeters on the Edge: $2.16 Support Stands Between Rebound and Ruin

XRP/USD 4-hour chart via Bitfinex on Nov. 16, 2025.

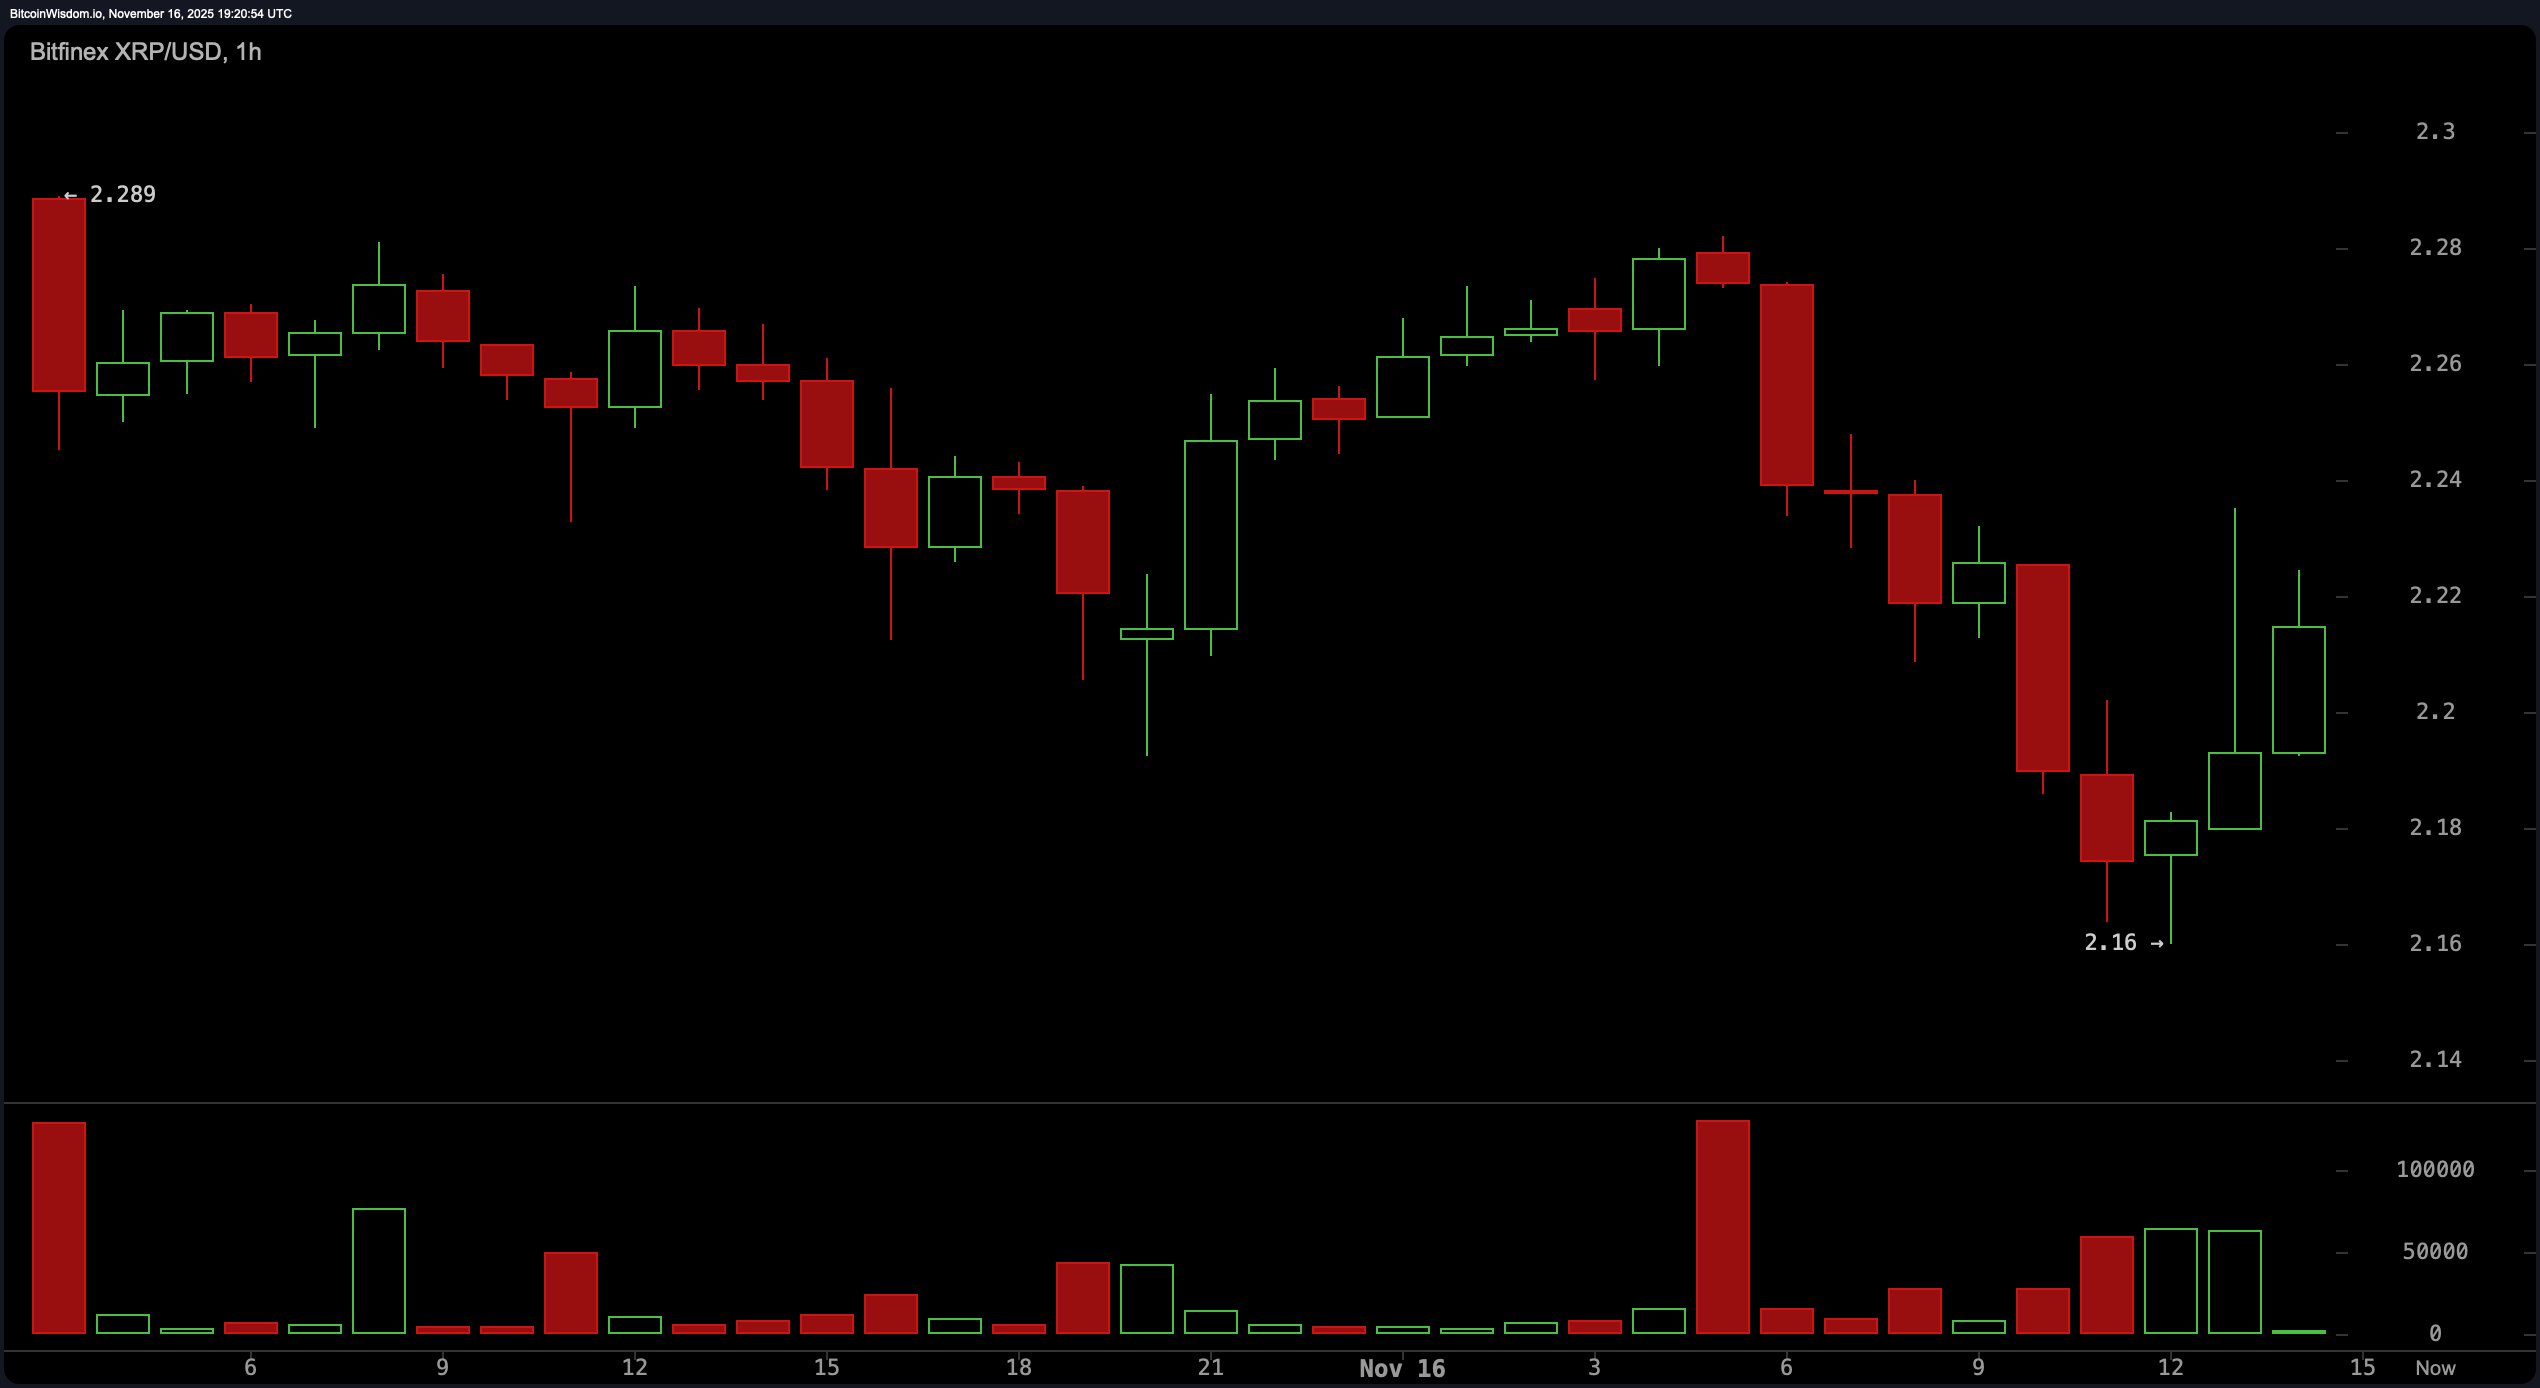
The hourly chart offered a breath of something resembling optimism—but don’t pop the champagne just yet. The formation of a potential double bottom around $2.16, accompanied by higher lows and volume nudges on green candles, hinted at a short-term bounce. Yet, even this glimmer is trapped within the broader downtrend. Any attempt to rally could quickly run into the formidable wall standing at the $2.30 threshold.

XRP Teeters on the Edge: $2.16 Support Stands Between Rebound and Ruin

XRP/USD 1-hour chart via Bitfinex on Nov. 16, 2025.

As for the indicators? The relative strength index (RSI) parked itself at 40.05, the stochastic %K at 31.83, and the commodity channel index (CCI) plummeted to −105.66—all comfortably lounging in neutral territory. The average directional index (ADX) at 30.91 confirms the trend’s strength but refuses to commit directionally. The momentum (10) gave a lonely whisper of encouragement, clocking in just above zero, while the moving average convergence divergence (MACD) doused that hope with a value of −0.07454.

And now to the sea of moving averages—none of them throwing confetti. Every single one, from the 10-period exponential moving average (EMA) to the 200-period simple moving average (SMA), aligned in resolute disagreement with bullish sentiment. With the 10-period EMA at $2.308 and the 200-period SMA at $2.631, the gap between current price and trend-following averages tells a tale of a market still licking its wounds from recent rejection.

So, while XRP might still be clinging to its $2.20 throne, the charts and indicators suggest that throne is wobbling. Until a breakout above $2.30 lands with volume-fueled conviction, XRP’s path of least resistance remains downward.

Bull Verdict:

If XRP holds above $2.16 and breaks decisively through the $2.30–$2.35 resistance zone with strong volume, it could mark the start of a short-term reversal. A sustained move higher might open the door to mid-term targets in the $2.50–$2.70 range, especially if momentum builds and moving averages begin to flatten or turn.

Bear Verdict:

Failure to defend the $2.16 support level, especially with increasing volume, could accelerate XRP’s descent, dragging it toward deeper support near $2.07 or lower. With all major moving averages stacked against it and momentum indicators leaning limp, the bearish bias remains dominant unless proven otherwise.

  • Where is XRP’s strongest support level?
    XRP shows key support near $2.16, tested multiple times on hourly and 4-hour charts.
  • What resistance level must XRP break to shift trend?
    A breakout above the $2.30–$2.35 range is critical for any short-term trend reversal.
  • What do XRP’s indicators say about momentum?
    Most oscillators remain neutral, with weak momentum and no strong bullish signals.
  • How do XRP’s moving averages look?
    All major exponential and simple moving averages are trending above price, signaling sustained pressure.

免责声明:本文章仅代表作者个人观点,不代表本平台的立场和观点。本文章仅供信息分享,不构成对任何人的任何投资建议。用户与作者之间的任何争议,与本平台无关。如网页中刊载的文章或图片涉及侵权,请提供相关的权利证明和身份证明发送邮件到support@aicoin.com,本平台相关工作人员将会进行核查。

Share To
APP

X

Telegram

Facebook

Reddit

CopyLink