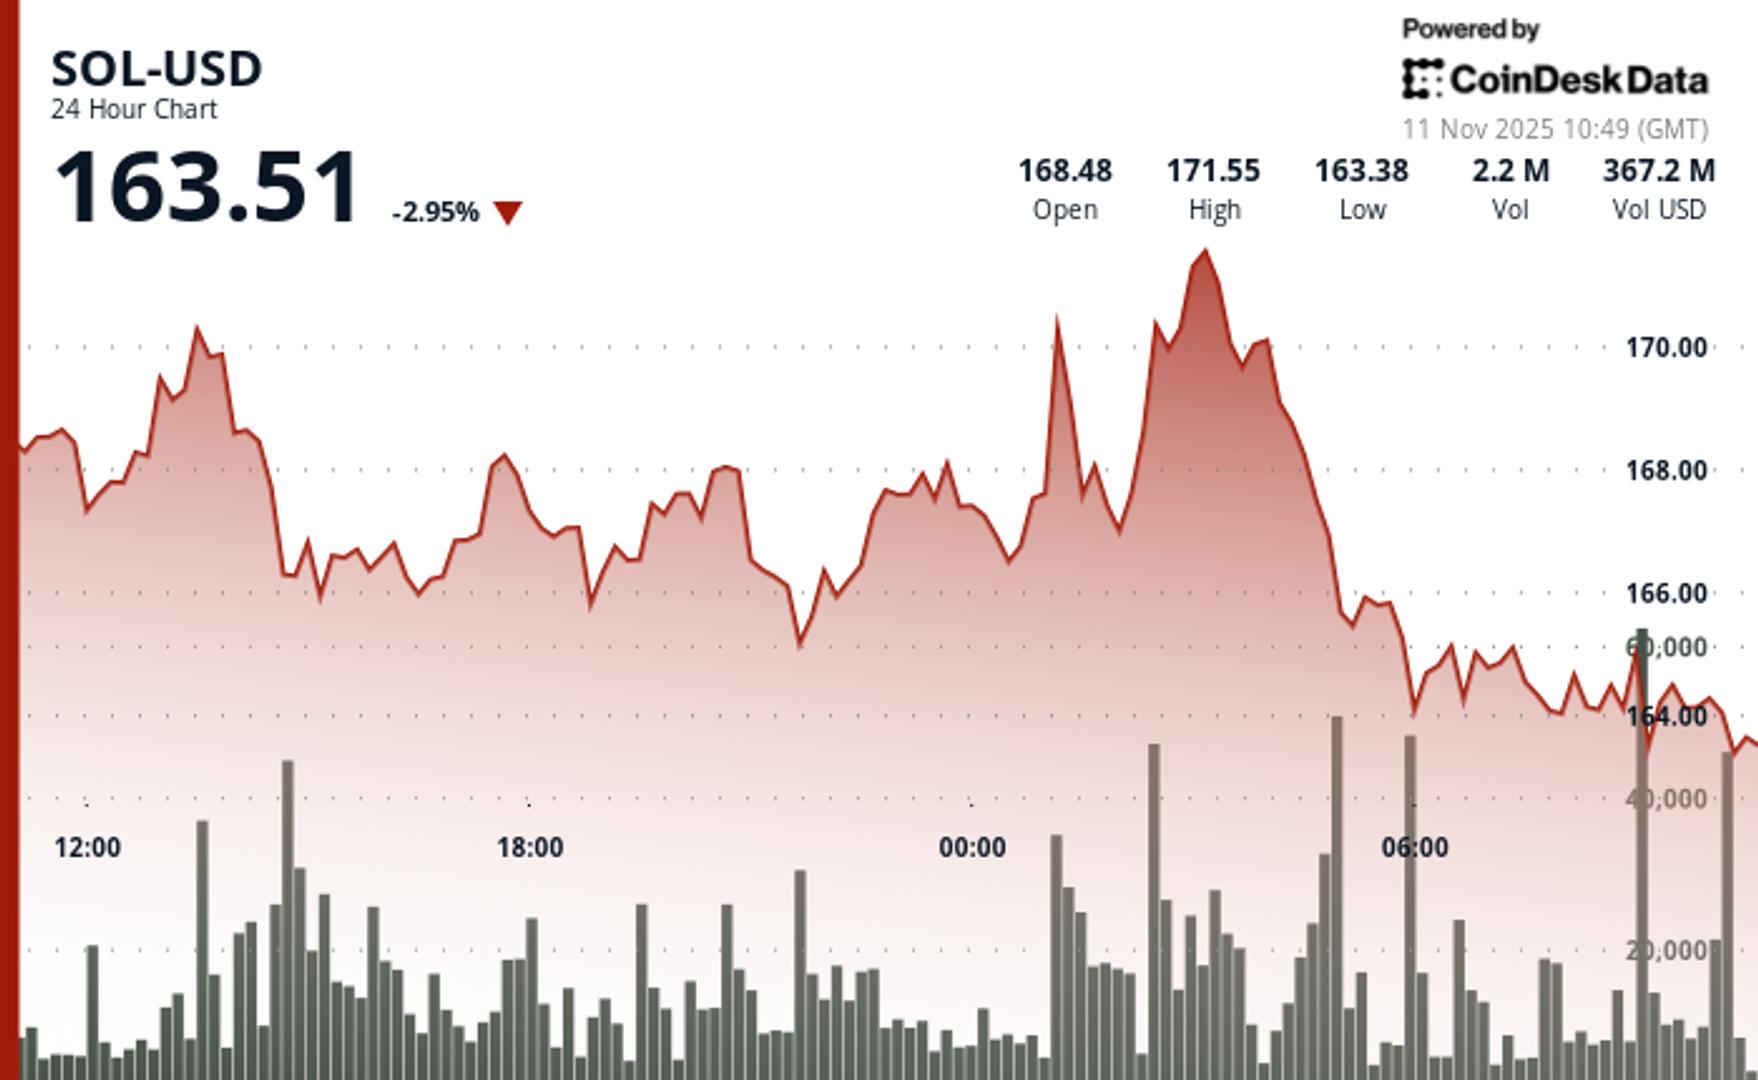
According to CoinDesk Research's technical analysis data model, solana dropped 3.1% to $164.30 during Tuesday's session as the token broke through critical technical support levels.
SOL declined from $169.54 to $164.26 over the 24-hour period ending November 11 at 09:00 UTC, establishing a clear downtrend structure with multiple rejection points above $170.
The selloff accelerated during Asian trading hours with significant volume accumulation. Trading activity surged 58% above the daily average as SOL tested the crucial $163.85 support zone. The session's $8.06 range represented 4.9% volatility, with the most significant volume spike occurring at 06:00 UTC with 1.47 million shares traded.
SOL underperformed the broader crypto market by 1.42% relative to the CoinDesk 5 Index (CD5), signaling targeted selling pressure on the token. Recent 60-minute analysis showed an aggressive upside reversal that quickly collapsed, with SOL spiking from $164.07 to $164.97 before surrendering gains in a sharp selloff to $163.46. This whipsaw action highlighted the fragility of any bullish momentum within the established downtrend.
The technical breakdown occurred without clear fundamental catalysts, suggesting profit-taking and momentum-driven selling dominated price action. Institutional flows remained mixed as overnight accumulation patterns conflicted with daytime distribution activity.
Technical breakdown vs support defense
With SOL having breached the $165 psychological level while volume patterns showed elevated selling interest, near-term price action centers on whether the $163.50 zone can hold as demand emerges. The downtrend structure remains intact with lower highs at $170.48 and $171.92 providing overhead resistance.
Momentum indicators deteriorated through the session as each rally attempt weakened. Volume analysis revealed selling pressure intensified on retests of highs while bounces attracted minimal buying interest, confirming the bearish bias in the near term.
Key technical levels signal vulnerability for SOL
Support/Resistance: Critical support now tests at $163.50 after the break of $165, while strong resistance remains at $170.50 with multiple failed breakout attempts.
Volume Analysis: Significant volume spike occurred with 1.47 million shares (58% above 24-hour average) during the support breakdown, with selling pressure peaking at 66,399 shares during the 09:16 UTC decline.
Chart Patterns: Established downtrend structure with lower highs at $170.48 and $171.92, followed by technical support failure and momentum deterioration.
Risk/Reward: The $163.50 level represents the next critical test for bulls, with technical indicators suggesting continued downside pressure toward the $160 psychological support zone.
CD5 market analysis: institutional rotation amid range-bound action
CD5 dropped 1.63% from $1851.31 to $1821.19 during the 24-hour period, experiencing elevated volatility with a $52.78 intraday range between $1868.63 and $1816.85, while institutional buying emerged during overnight sessions supporting recovery from $1817 technical support.
Disclaimer: Parts of this article were generated with the assistance from AI tools and reviewed by our editorial team to ensure accuracy and adherence to our standards. For more information, see CoinDesk's full AI Policy.
免责声明:本文章仅代表作者个人观点,不代表本平台的立场和观点。本文章仅供信息分享,不构成对任何人的任何投资建议。用户与作者之间的任何争议,与本平台无关。如网页中刊载的文章或图片涉及侵权,请提供相关的权利证明和身份证明发送邮件到support@aicoin.com,本平台相关工作人员将会进行核查。


