目前市场的节奏并未转向看涨。如果市场上的看跌趋势持续,XRP将在下周看到死亡交叉,而以太坊和卡尔达诺则在慢慢失去希望。
XRP的看跌交叉
死亡交叉是一个技术事件,指的是50日移动平均线跌破200日移动平均线,通常表明长期看跌动能的转变,XRP正危险地接近形成这一交叉。如果当前的价格走势持续,这一交叉可能在一周内发生,这可能巩固XRP的下行趋势,并导致另一轮卖压。
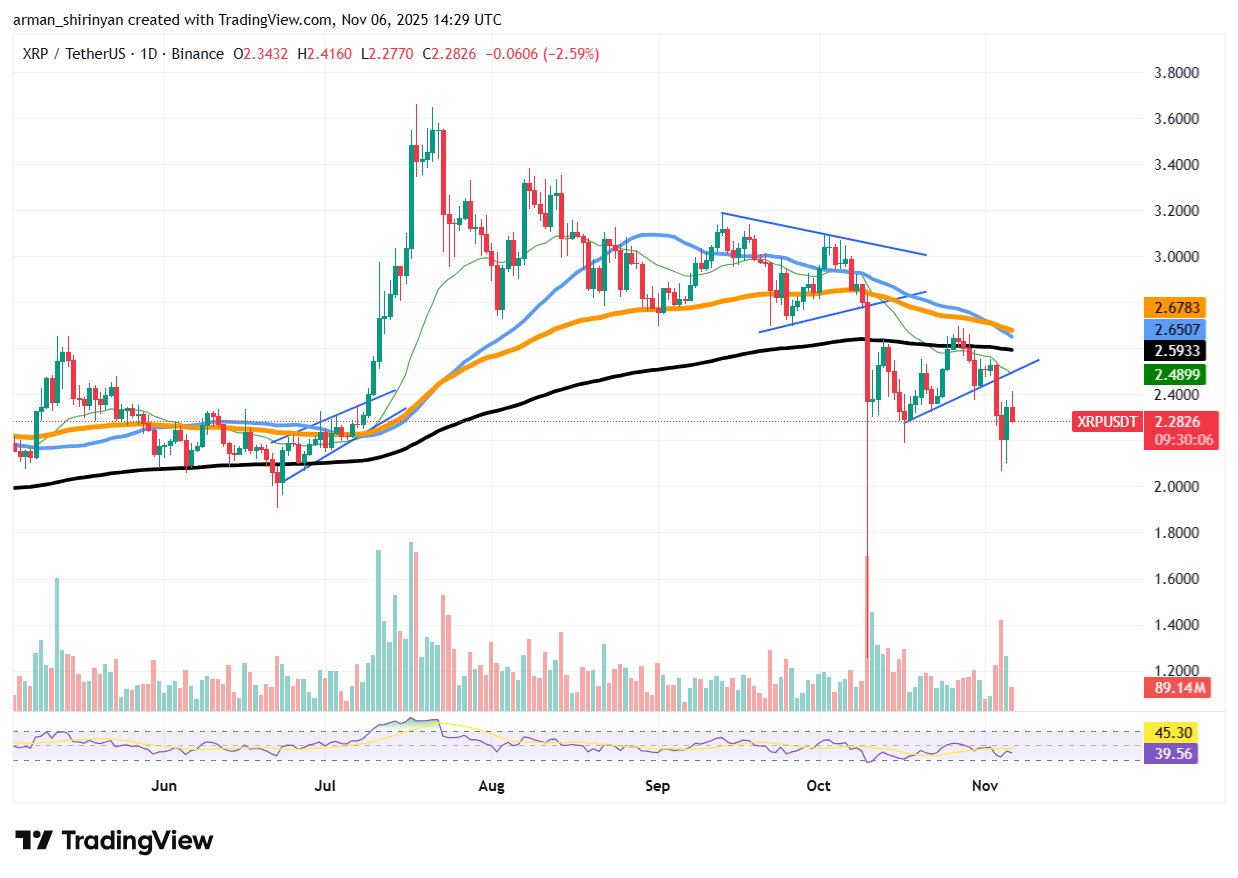
在未能维持在$2.50以上的任何显著反弹后,该代币目前的交易价格约为$2.29,过去一天下跌约2%。自8月以来形成的更大看跌结构通过图表上持续的低高点和低低点模式得到了加强。
热门故事 Ripple首席技术官命名XRPL的真实利益相关者加密市场预测:XRP将在一周内出现死亡交叉?以太坊(ETH)在$2,000之前的最后希望,卡尔达诺(ADA)达到极度超卖水平Ripple支持美联储的“瘦账户”计划10亿只柴犬(SHIB)抛售触发,$1.5万亿巨头富兰克林·坦普顿更新XRP ETF申请,鲸鱼抛售狗狗币(DOGE)——加密新闻摘要
强大的阻力位,买家多次未能突破,确认了接近$2.60-$2.70区域的拒绝,这也是主要移动平均线聚集的地方。鲸鱼的卖压不断增加,助长了看跌的局面。
你可能也喜欢
2025年11月1日 - 16:00 '某种神奇的东西':卡尔达诺创始人称赞财政部长的比特币推文作者Tomiwabold Olajide
如前所述,最近资助的钱包对XRP开设了一个巨大的20倍杠杆空头,并向Hyperliquid添加了700万美元的USDC。这一立场提高了机构交易者期待更大修正的可能性,其他大型看跌押注在衍生品平台上的存在也表明了这一点。
动能指标也开始变得负面。尽管在红色蜡烛上交易量仍在增加,这是分配的经典指标,但相对强弱指数(RSI)已跌破45,表明买方信心减弱。如果确认死亡交叉,跌向$1.85甚至$1.60的可能性不能排除。
XRP很可能会重新测试其接近$2.00的重要支撑;如果突破,任何短期反弹可能会遇到重大障碍,除非整体市场稳定。就目前而言,图表和订单流都表明XRP的上升趋势岌岌可危,临近的死亡交叉可能成为其最终崩溃的催化剂。
以太坊的最后机会?
以太坊目前处于可能是其在$2,000区域大幅崩溃之前的最后防线。该加密货币已经坚决失去了自2月以来作为长期动态支撑的200日移动平均线。它目前的交易价格接近$3,600,较前一天下跌约1.7%。
由于这一崩溃,市场情绪变得极为悲观,使得ETH处于一个位置,任何额外的疲软都可能导致更深的损失和连锁清算。根据图表结构,以太坊的价格自7月以来一直呈下行趋势,低高点不断从$4,000-$4,200区间拒绝。
你可能也喜欢
2025年11月5日 - 08:43 以太坊“完蛋了?”顶级交易员揭示ETH价格的最佳和最坏情况作者Gamza Khanzadaev
从技术上讲,趋势疲软已通过最近跌破黑色200日EMA得到了确认。下一个强劲的积累区通常形成在$2,000-$2,200附近,在2024年初, substantial buying activity曾重新进入市场,一旦ETH显著低于这一移动平均线。
动能指标并未显示出反转,这增加了压力。尽管成交量数据尚未指向显著的买入反应,但RSI已跌破35,表明超卖状态。短期交易者似乎不愿意介入,直到形成更明显的支撑底部,而卖方继续保持主导地位。
积极的一面是,这$3,500-$3,600区间仍对应于一个关键的结构水平,该水平在ETH年中上涨之前多次作为阻力。如果多头能够维持这一水平并将ETH推回$3,800以上,向$4,000的短期反弹是可以想象的。
心理上的$2,000关口将是下一个——也可能是最后一个——重要的买入区域,之后长期持有者可能会开始放弃,但如果未能在此处维持,可能会打开通往$3,000的大门。
卡尔达诺未能恢复
随着资产进入任何持续牛市都无法容忍的领域,卡尔达诺显示出严重的警告信号。ADA目前的交易价格约为$0.53。在过去24小时内,它下跌超过2%,继续着无情的下行趋势,导致其RSI(相对强弱指数)达到31,这一水平通常与极度超卖状态相关。
你可能也喜欢
2025年11月6日 - 12:04 7大加密货币交易员被彻底摧毁:高杠杆交易等于赌博吗?作者Arman Shirinyan
ADA整个技术结构的恶化尤其令人担忧。20日、50日、100日和200日EMA在图表上都按降序排列,显示出主要指数移动平均线之间的完全死亡交叉排列。这一安排表明在所有时间段内动能的深层损失,而不仅仅是暂时的疲软。在过去,这些排列通常预示着延长的停滞期或进一步的价格崩溃。
在ADA失去其约$0.65的支撑后,该水平与其200日EMA一致,下降速度加快。在2024年,这一水平一直作为长期支点,持续吸引买家的关注。由于在10月底的决定性崩溃,强大的阻力随之而来,随后的每次反弹尝试都迅速被拒绝。
看跌的情况得到了成交量分析的支持,显示出由于买入流入疲软和卖方压力增加,卖方仍然处于控制之中。除非ADA迅速重新夺回$0.60-$0.65区间,否则向$0.45甚至$0.40的下跌似乎更为可能。尽管考虑到超卖情况,短期技术反弹是可能的,但在缺乏基本面或市场整体催化剂的情况下,这种反弹不太可能持续太久。
免责声明:本文章仅代表作者个人观点,不代表本平台的立场和观点。本文章仅供信息分享,不构成对任何人的任何投资建议。用户与作者之间的任何争议,与本平台无关。如网页中刊载的文章或图片涉及侵权,请提供相关的权利证明和身份证明发送邮件到support@aicoin.com,本平台相关工作人员将会进行核查。


