Ethereum seems to be having difficulty holding onto the $4,000 mark, and recent price movement suggests a possible double top formation, which could be problematic for bulls. ETH has once again been rejected near $4,200, following a promising attempt to regain lost ground earlier this month, indicating that upward momentum may be rapidly waning.
Ethereum’s structure is starting to resemble a double top on the daily chart, with one peak formed in mid-October and another formed more recently. Traditionally, this pattern has been interpreted as a bearish reversal signal, especially when combined with decreasing relative strength and trading volume. This story is supported by the RSI’s 47-point range, which shows neutral-to-bearish momentum and minimal signs of significant buying interest.
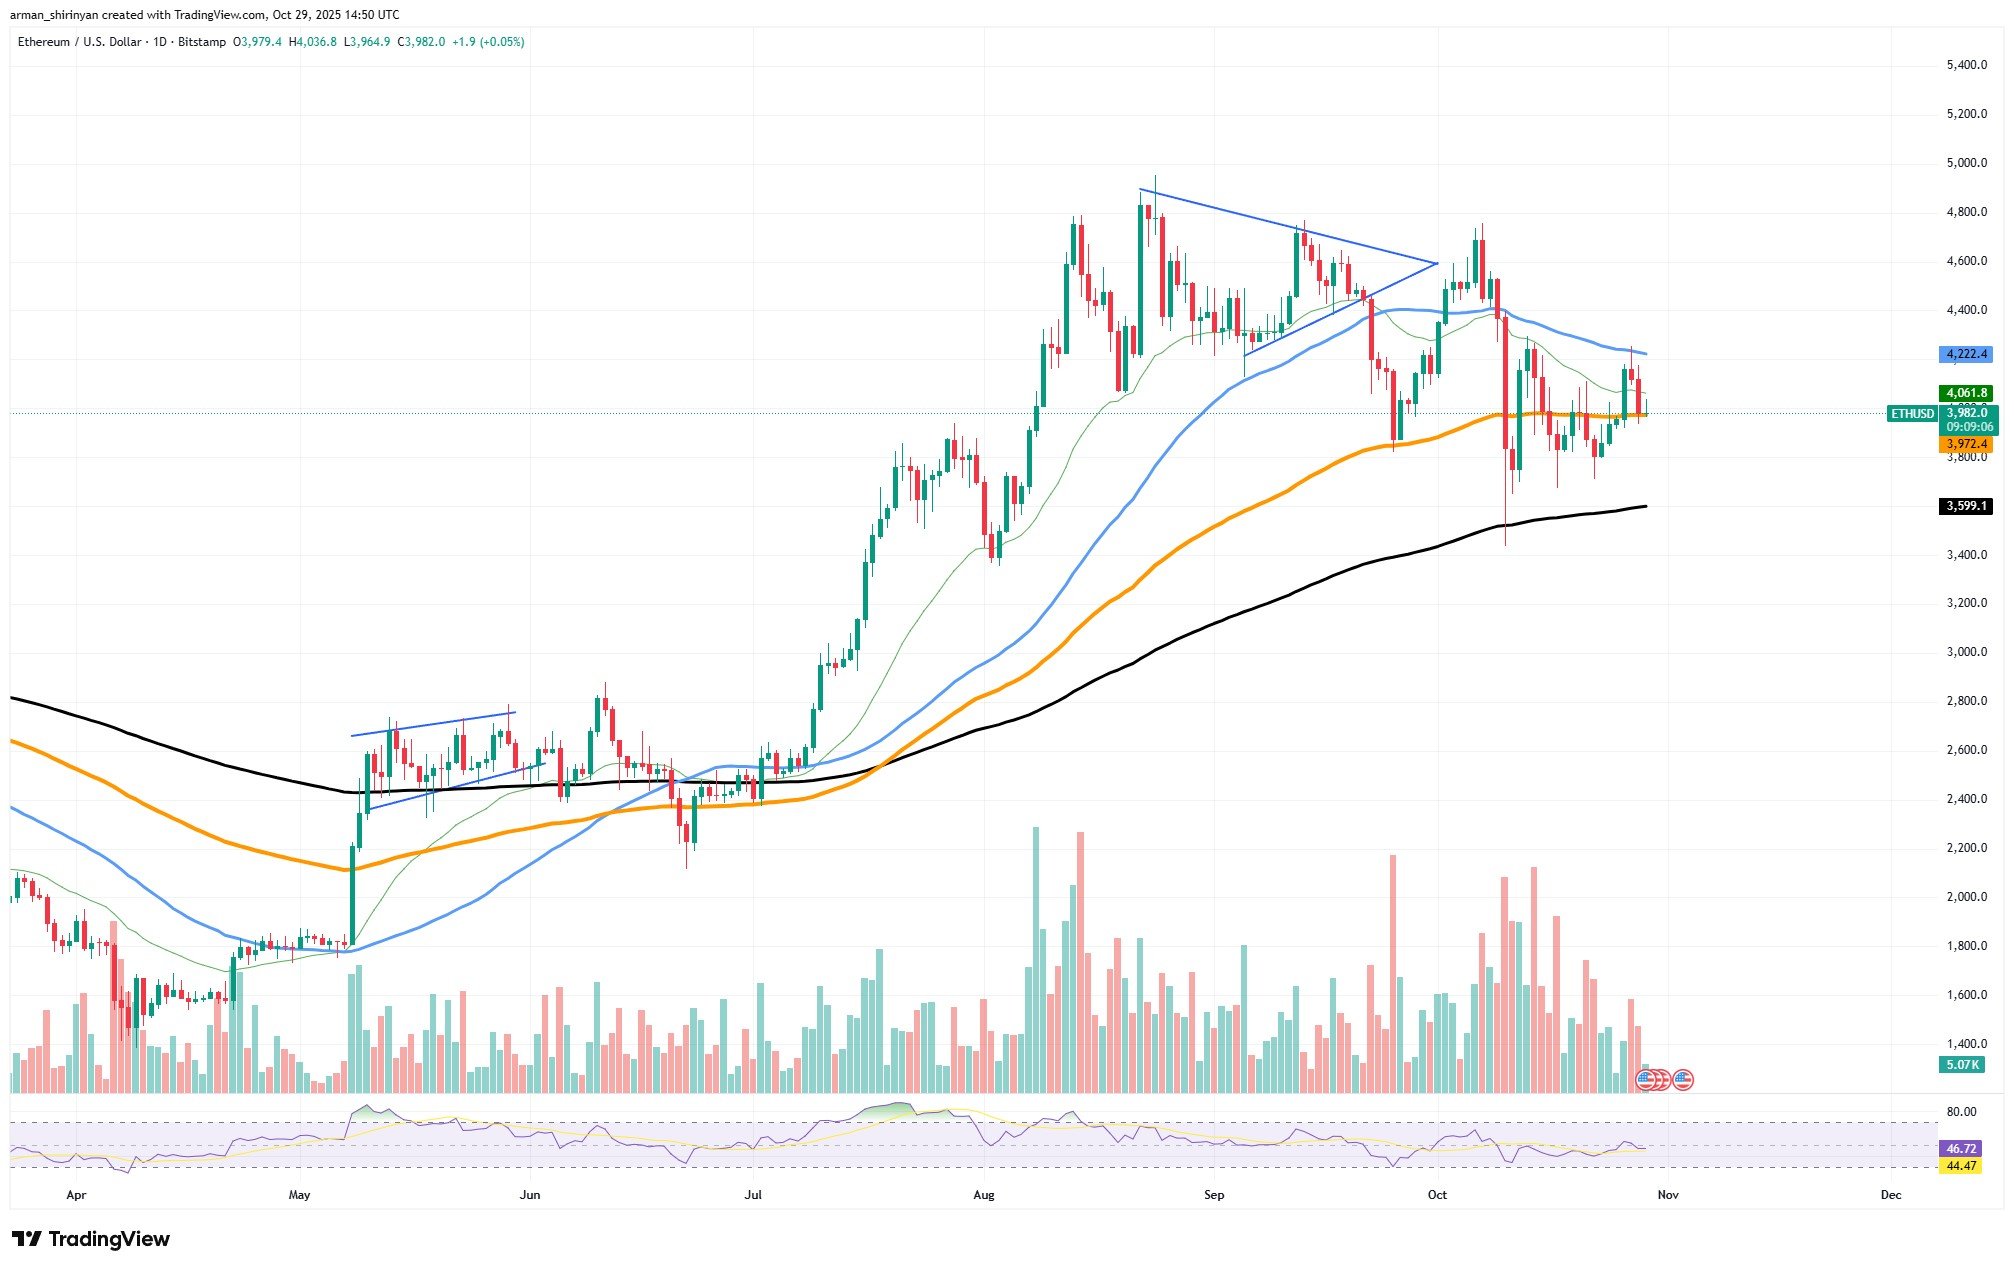
ETH/USDT Chart by TradingView
The 50-day and 100-day EMAs, which both converge just above the current price, present significant technical resistance for ETH. Bullish attempts to break higher are consistently capped by this cluster, which is functioning as a significant ceiling. The 200-day EMA, around $3,600, is still the final line of defense before the market structure turns sharply negative.
HOT Stories Crypto Market Prediction: Ethereum's (ETH) Goodbye to $4,000? Shiba Inu (SHIB) Adding Another Zero? Is $115,000 Unbreakable for Bitcoin (BTC)?Odds of BTC Hitting $130K This Month Drop to Nearly 0% BREAKING: Mastercard to Acquire Crypto Startup for $2 Billion Forget Quantum Threat, Peter Schiff Explains How Bitcoin Will Actually Die
The next downward targets for Ethereum are $3,800 and $3,600, if it is unable to maintain a hold above $3,950-$4,000. A clear break below the latter might intensify selling pressure and possibly validate a more extensive downward trend that lasts into November.
The general mood does not help either; Ethereum is unlikely to survive unharmed as Bitcoin consolidates under pressure from liquidation clusters and general macro uncertainty. ETH is susceptible to an abrupt correction because of the market’s dwindling enthusiasm and low volume, which indicate that traders are adopting a wait-and-see attitude.
Shiba Inu close to losing again
Shiba Inu is flirting with danger once more, as its price action points to a possible continuation of the downward trend, which could result in an additional zero being added to its valuation. A faltering market is indicated by the meme token’s recent price movement, which has been marked by weak momentum, low trading volume and ongoing resistance from important moving averages.
At the moment, SHIB is trading at $0.0000102, barely above a thin ascending support line that prevents further declines. However, because the asset is still stuck below a group of significant exponential moving averages, this shaky uptrend lacks conviction. The green, orange and black lines, which stand for the 50-, 100- and 200-day EMAs, respectively, continue to function as strong resistance levels, effectively stifling any bullish attempts.
You Might Also Like
Tue, 10/28/2025 - 15:43 Bitcoin (BTC) Price Analysis for October 28ByDenys Serhiichuk
The overall trend is still categorically negative from a structural standpoint. SHIB has consistently formed a series of lower highs since peaking near $0.000015 in early September, indicating that sellers are in firm control. In the meantime, the RSI at 40 indicates mild oversold conditions, but it does not really show that buying strength will resume anytime soon. To put it another way, there is not a visible catalyst that could stop this decline.
SHIB has not produced significant inflows or drawn speculative volume — both of which are necessary for a token that mainly depends on retail hype, despite a brief stabilization phase. The next logical stop could be $0.000008, which would essentially add another zero to the price if the present support level around $0.0000095 fails to hold.
For the time being, the market is clearly communicating that sentiment is low and that Shiba Inu’s chances of recovering seem bleak in the absence of a strong fundamental or speculative driver. If buyers do not intervene decisively, SHIB’s next chapter may be characterized by yet another agonizing zero.
Bitcoin struggling
As momentum wanes and market inflows stop, Bitcoin is still struggling close to the $115,000 mark, which is turning out to be nearly unbreakable. BTC has been consistently rejected despite multiple attempts to regain ground above this crucial resistance, indicating that buyers may be losing steam.
Bitcoin has not shown any clear strength in either direction over the last week, remaining between $112,000 and $115,000. Technically speaking, the structure is starting to level out, which is indicative of declining trading volume and indecision. The 200-day MA is currently lower, near $108,000, providing the only remaining clear support zone, while the 50-day and 100-day moving averages are pushing down on the price.
You Might Also Like
Tue, 10/28/2025 - 00:01 Crypto Market Prediction: Bitcoin (BTC) Destroyed $600,000,000 Resistance Level, Shiba Inu (SHIB) Price Battle Next, Is Ethereum's (ETH) $4,200 Temporary?ByArman Shirinyan
The lack of significant inflows into Bitcoin is concerning. Both exchange and on-chain data show that the amount of new capital coming into the asset has drastically decreased, indicating that both institutional and individual investors are being cautious. The market lacks the liquidity required to overcome strong resistance levels such as $115,000, where sizable clusters of sell orders are concentrated in the absence of new demand.
The Relative Strength Index, which shows no indications of significant accumulation or directional conviction, is one momentum indicator that reflects this sentiment. To put it simply, the market seems to be stuck between waning optimism and cautious realism. The likelihood of a deeper retreat toward $110,000 or even $108,000 increases if Bitcoin is unable to demonstrate consistent movement above $115,000.
In essence, that would reset the short-term structure, potentially trapping late buyers who were hoping for a breakout. As of right now, Bitcoin’s $115,000 price cap remains in place. The idea of Bitcoin breaking higher is still more of a wish than a realistic near-term expectation until inflows resume and conviction grows.
免责声明:本文章仅代表作者个人观点,不代表本平台的立场和观点。本文章仅供信息分享,不构成对任何人的任何投资建议。用户与作者之间的任何争议,与本平台无关。如网页中刊载的文章或图片涉及侵权,请提供相关的权利证明和身份证明发送邮件到support@aicoin.com,本平台相关工作人员将会进行核查。


