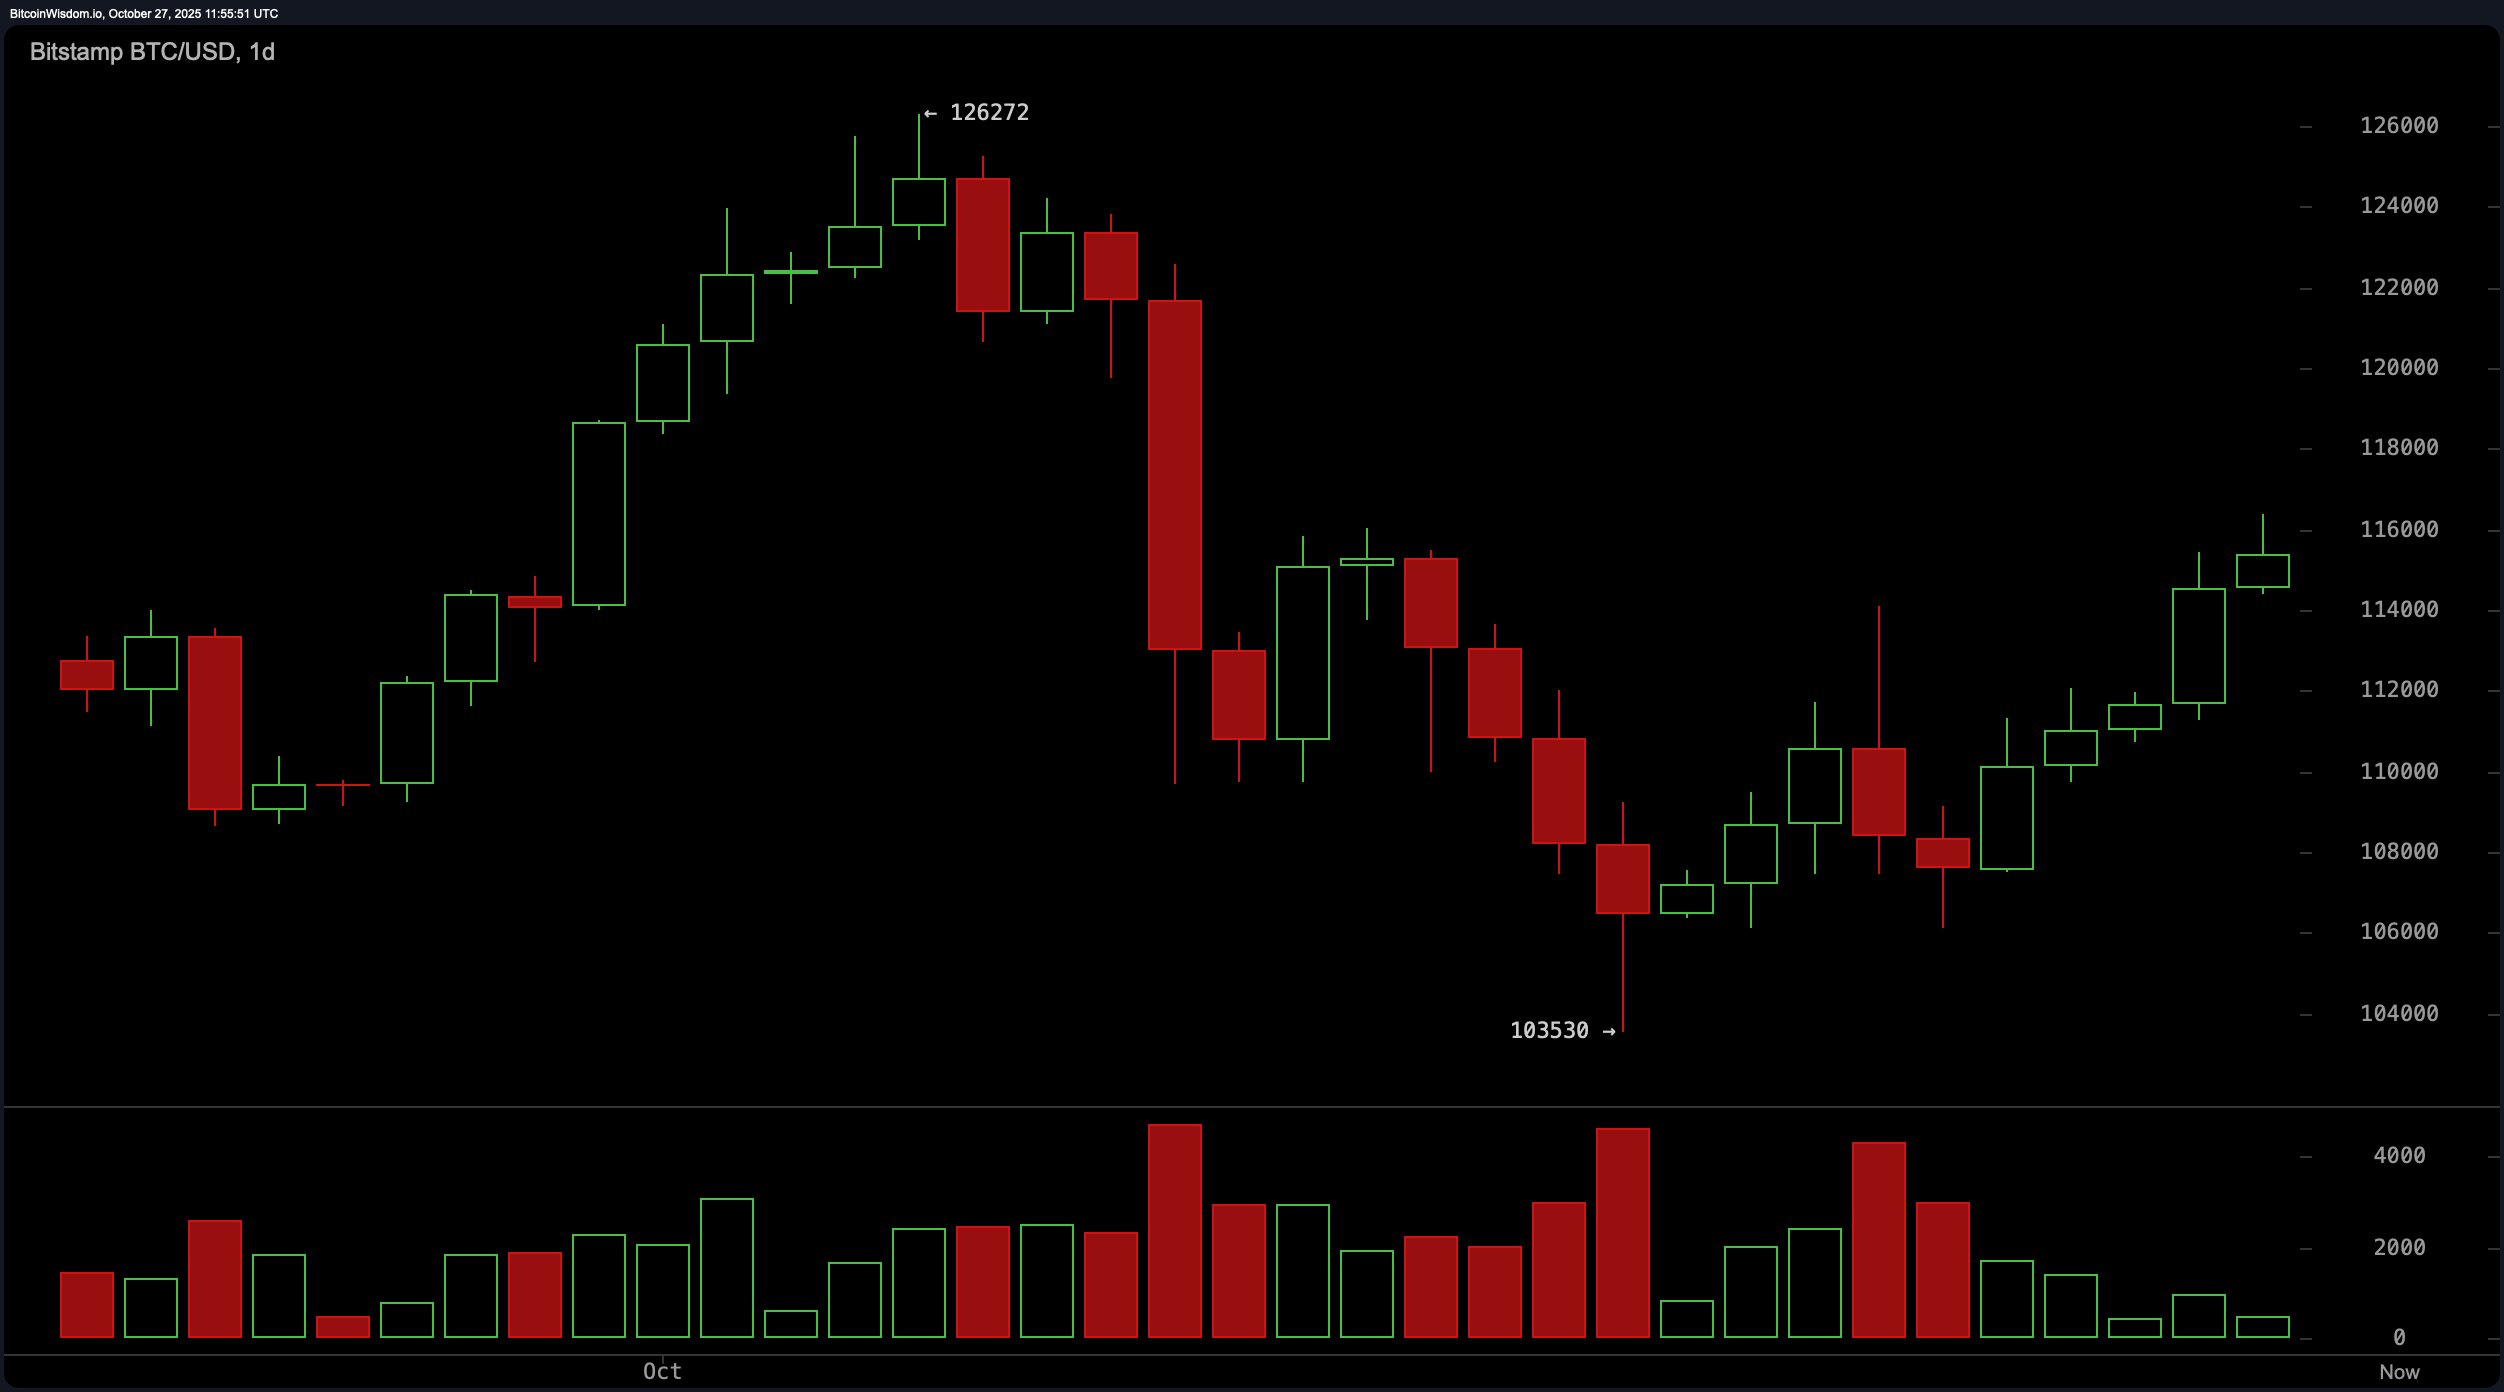
On the daily chart, bitcoin is strutting through a bullish recovery after bouncing off a trough near $103,530. The current pattern of higher highs and higher lows is textbook uptrend behavior, though volume is whispering where it once roared—signaling that momentum is cooling even as prices inch higher.
The key resistance level looms at $126,000, while support remains steady around $103,500. Traders eyeing a re-entry may want to watch the $112,000–$113,000 zone for a pullback, but they’ll want to see bullish candlestick patterns and renewed volume to justify optimism.

BTC/USD 1-day chart via Bitstamp on Oct. 27, 2025.
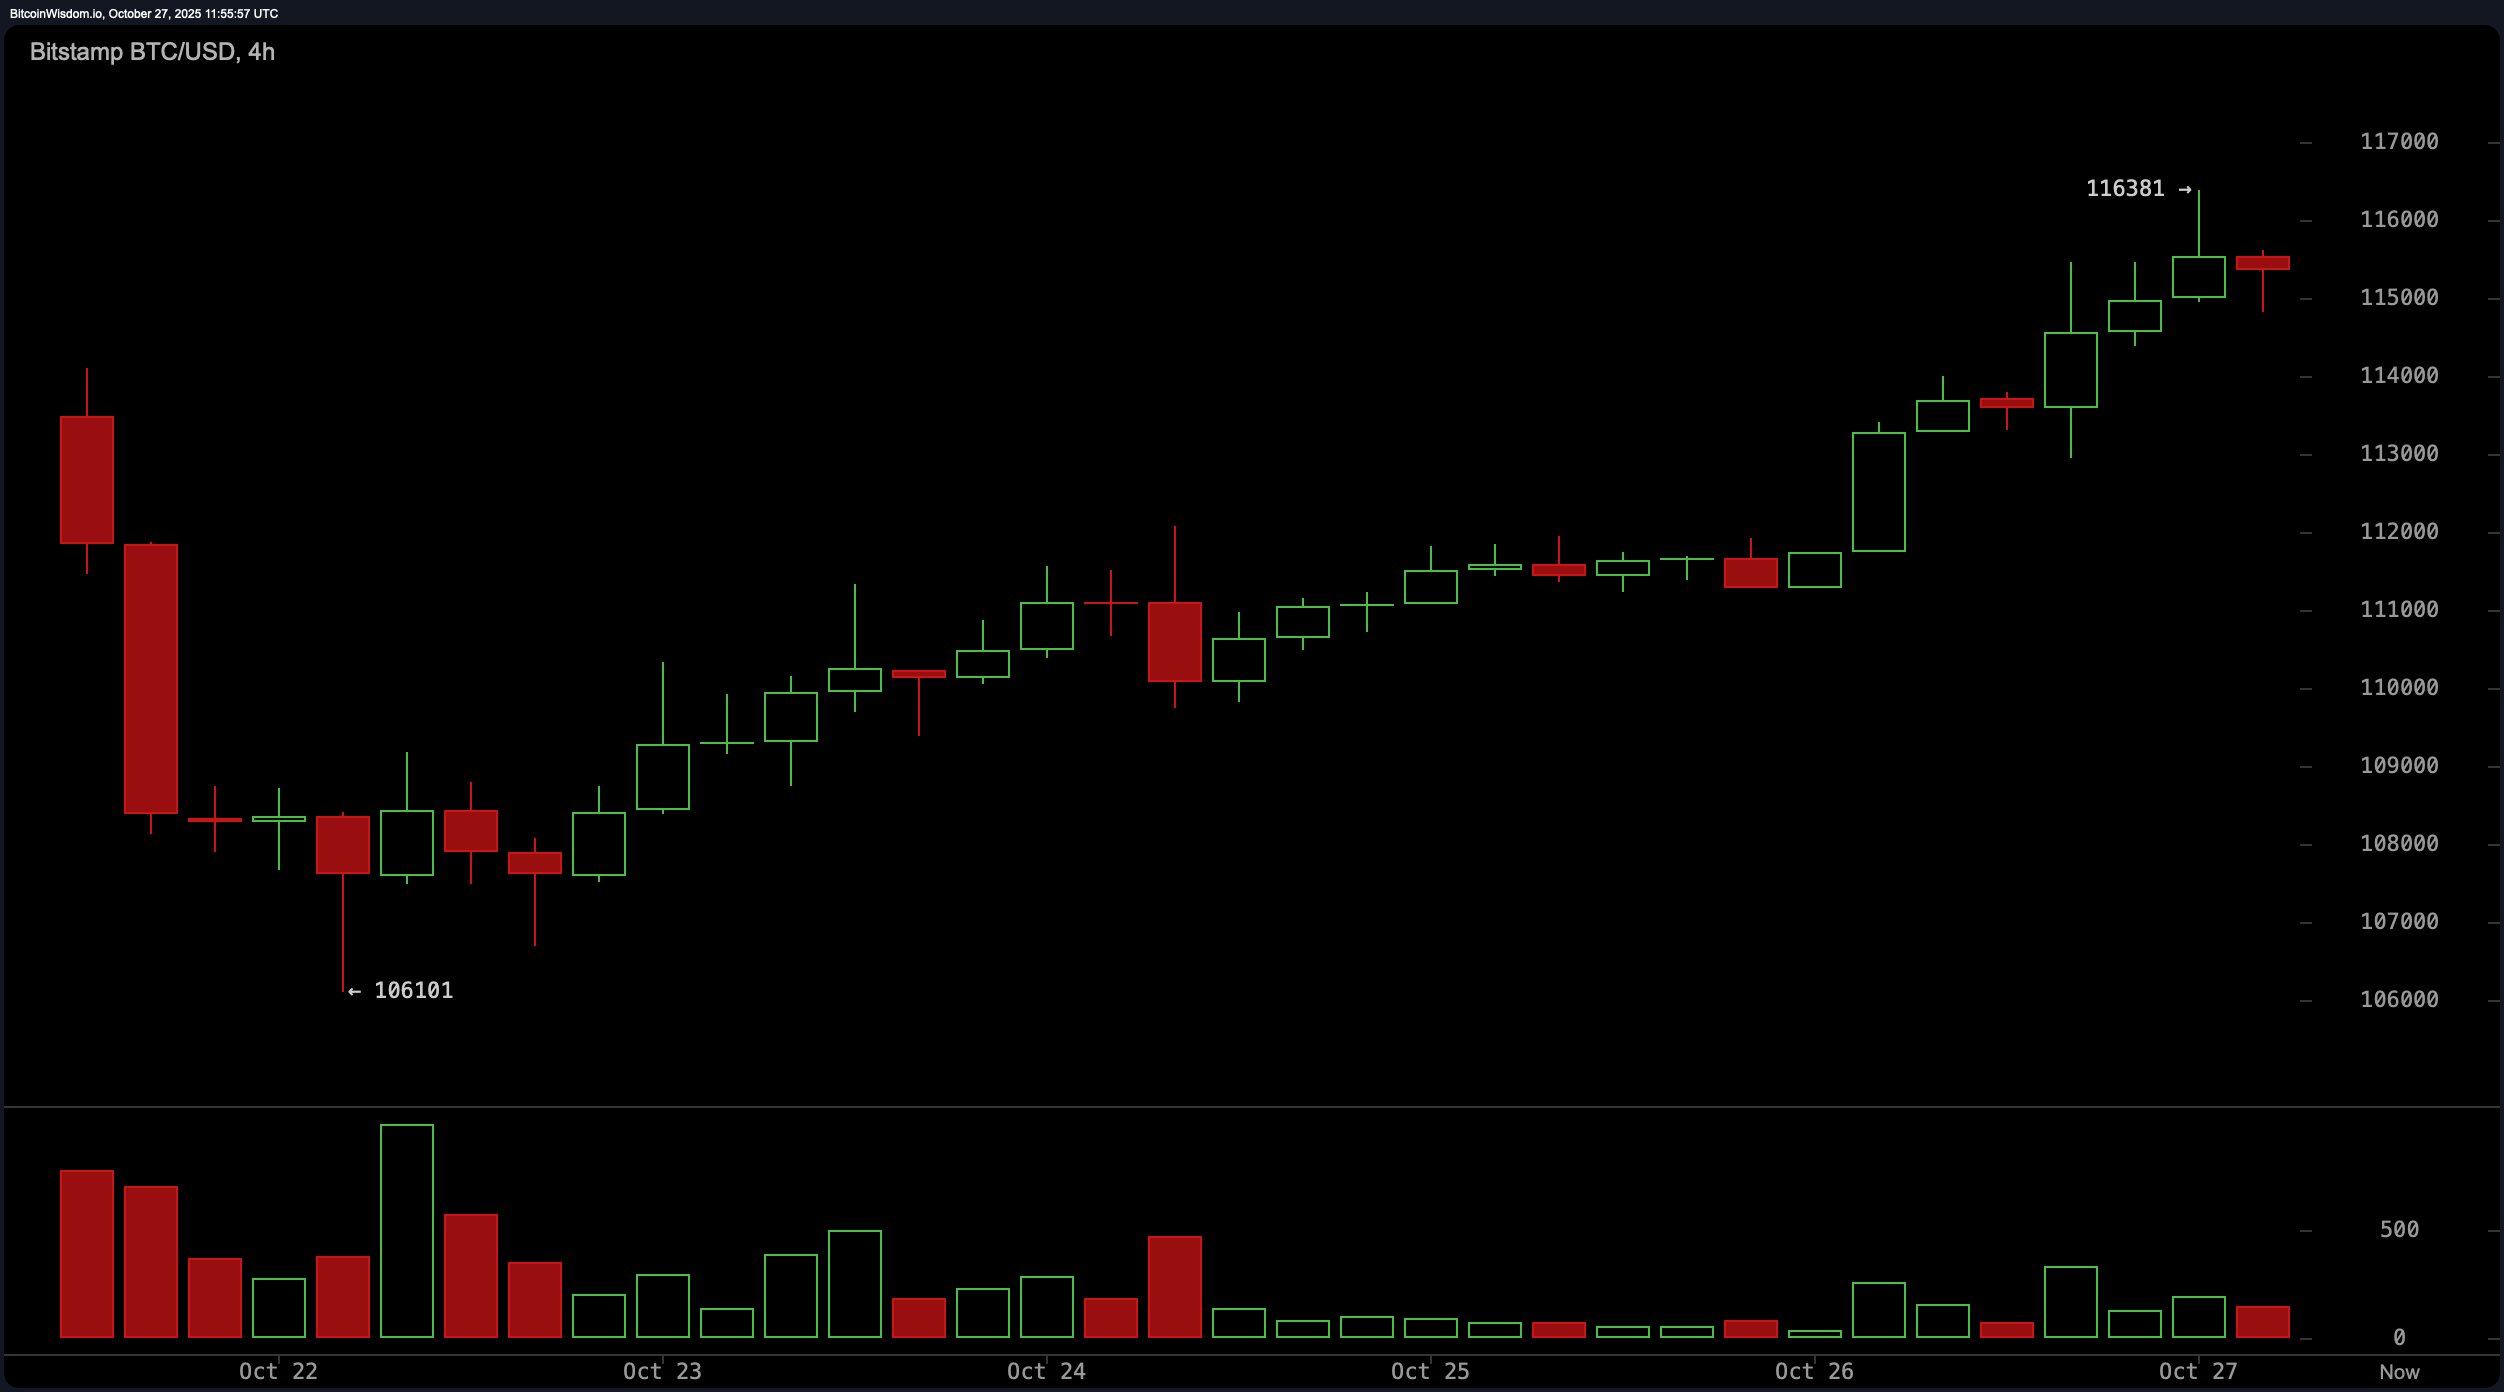
The 4-hour chart is the goldilocks zone right now—just enough clarity without too much noise. From the recent bottom of $106,101, bitcoin surged to a peak of $116,381, carving out a series of consolidations that hint at a healthy market structure. Support around $112,000 and $114,000 has proven resilient, but with momentum showing signs of tapering, price action could start flirting with resistance near $118,000 to $120,000. The key tell? Whether volume and the relative strength index (RSI) begin showing bearish divergence.

BTC/USD 4-hour chart via Bitstamp on Oct. 27, 2025.
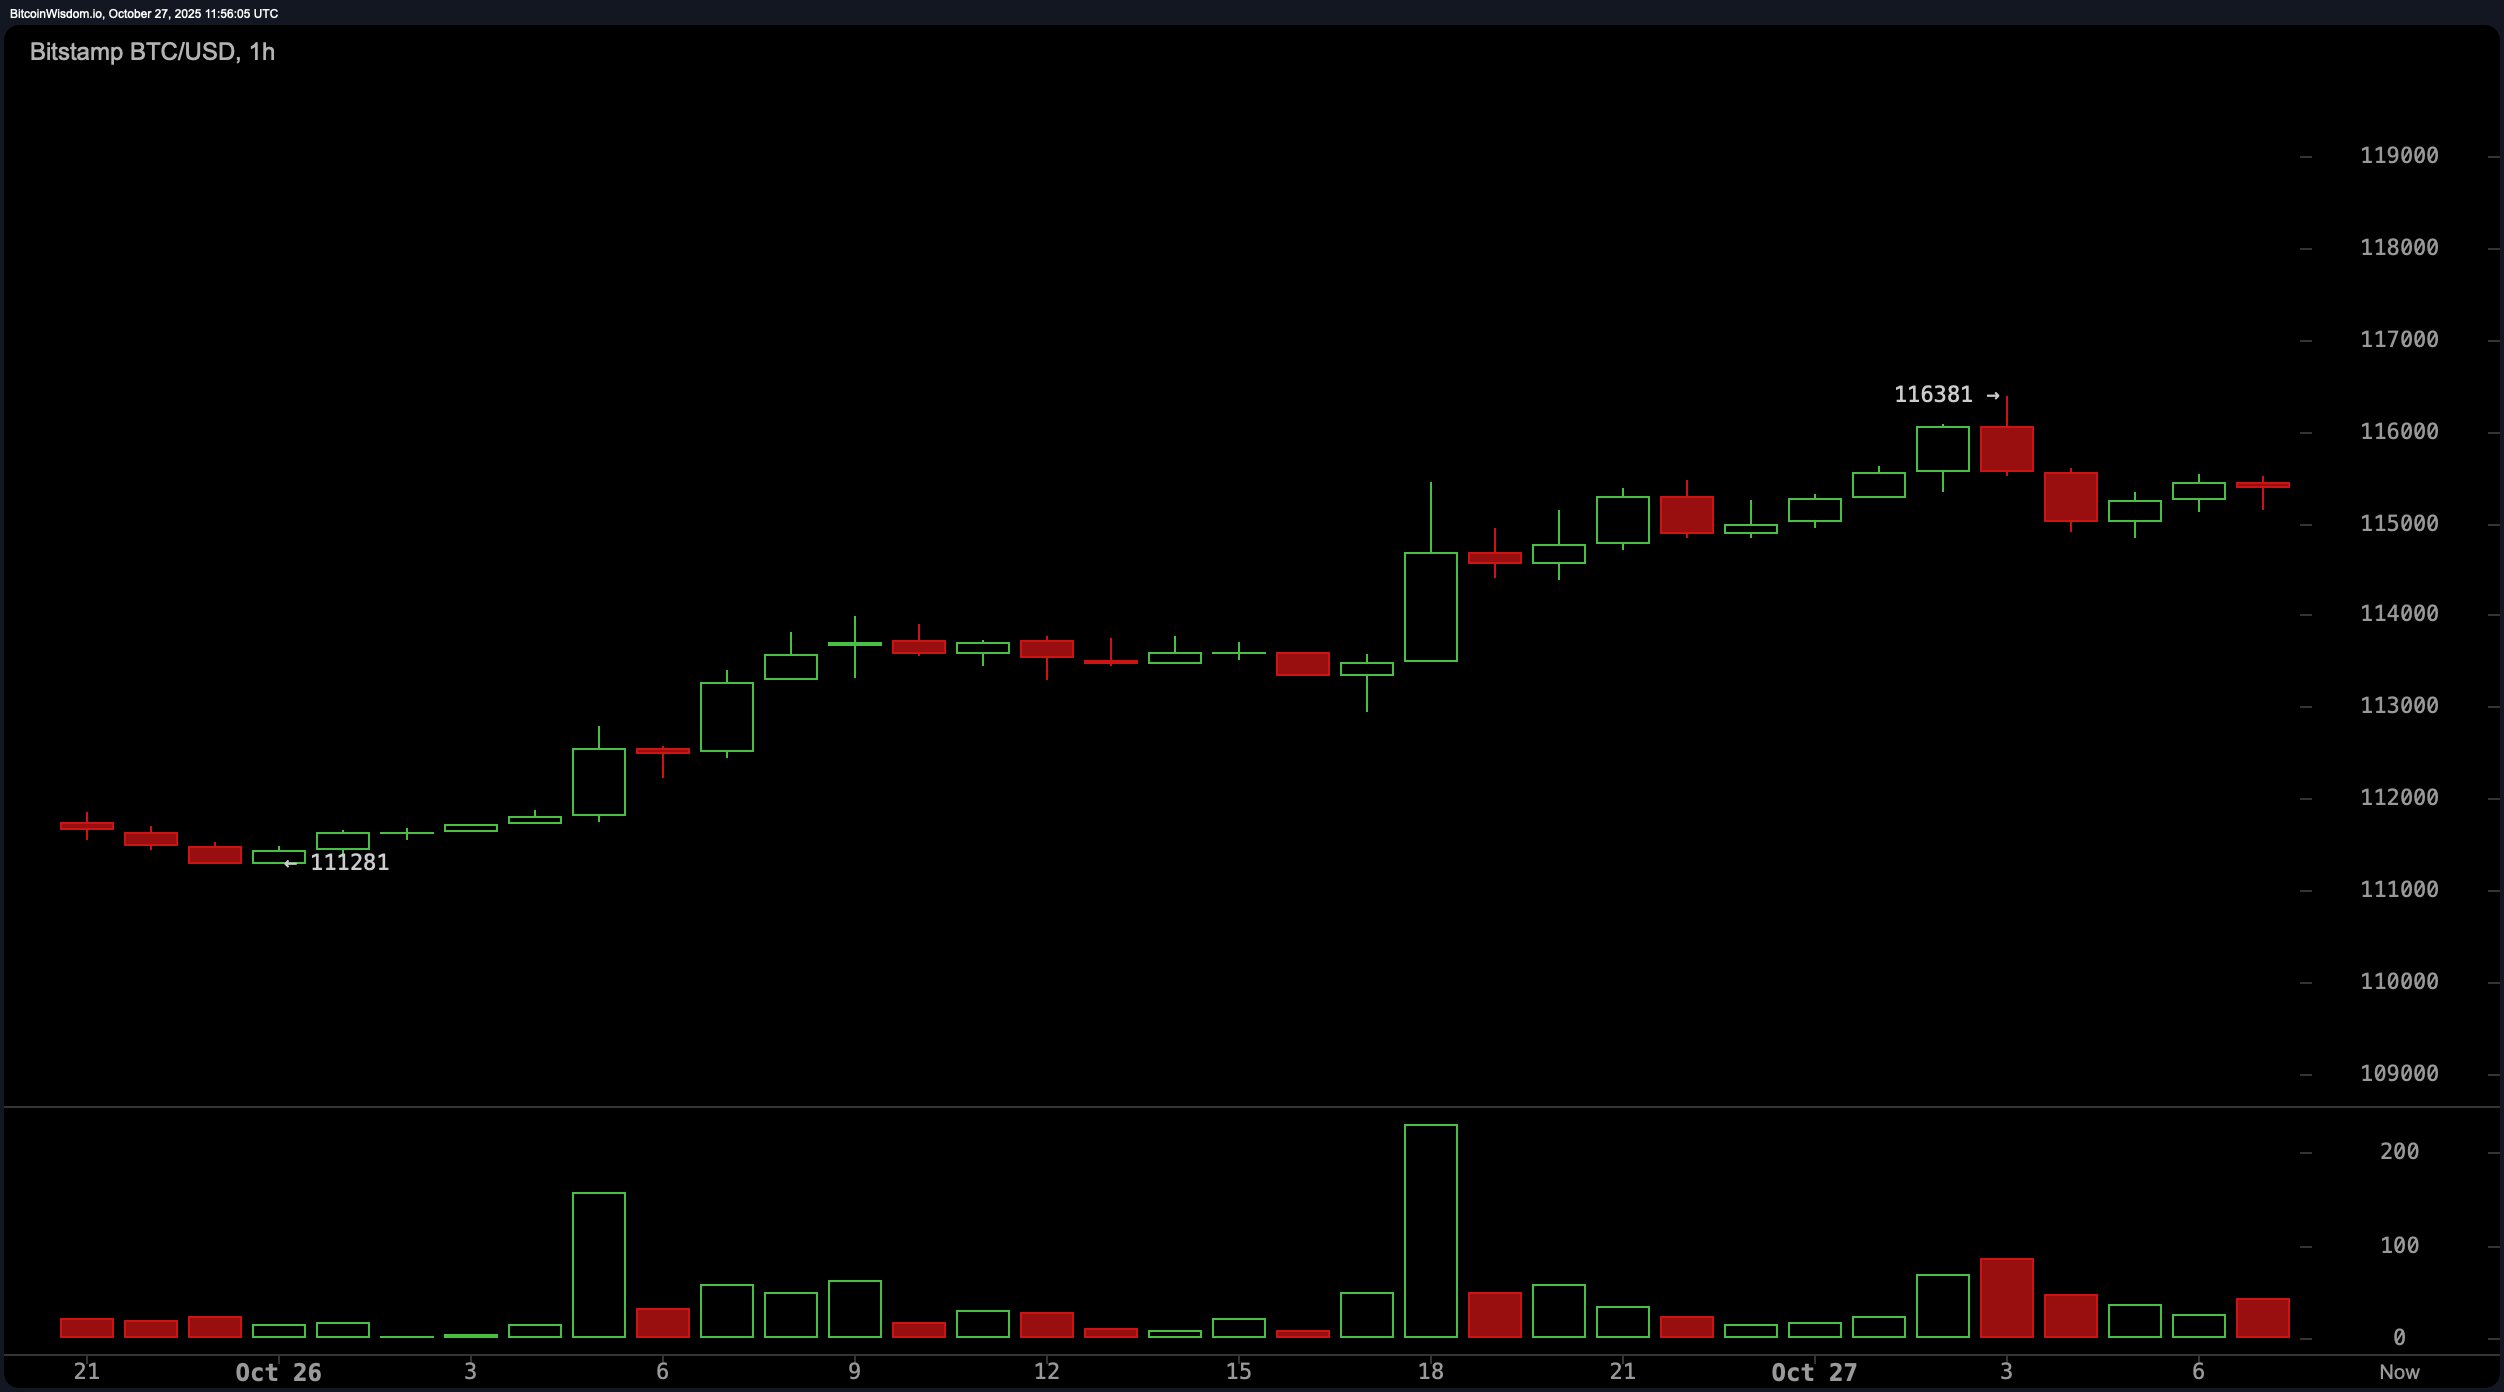
Meanwhile, the 1-hour chart reveals that bitcoin is catching its breath. After tagging $116,381, price action has gone sideways, with indecisive candles and declining volume hinting at a potential stall or topping pattern. Support at $115,000 and $113,000 remains crucial, and short-term resistance around $116,400 continues to act like a doorman, turning away any upward ambition without a volume-based RSVP. For traders peeking at the microtrend, any bounce from $114,500–$115,000 with volume and a strong candle body might rekindle interest, but a breakdown below $114,500 raises eyebrows—and stop losses.

BTC/USD 1-hour chart via Bitstamp on Oct. 27, 2025.
On the indicator front, it’s a neutral cocktail with a twist. The relative strength index (RSI), stochastic oscillator, commodity channel index (CCI), average directional index (ADX), and awesome oscillator are all leaning neutral. The outliers? Momentum, which is pushing at 8,874 and indicating upward inertia, and the moving average convergence divergence (MACD), which is floating at -808—suggesting a shift that’s not quite bearish, not quite bullish, but definitely not boring.
All roads lead to the moving averages, and frankly, they’re painting a picture worth a thousand bullish memes. Every single short-, medium-, and long-term line—from the 10-day exponential moving average (EMA) at $111,956 to the 200-day simple moving average (SMA) at $108,984—is pointing in the same direction. It’s a rare sight: the trend is dressed to the nines in green, and all moving averages are playing in harmony, whether exponential or simple. If bitcoin is a freight train, the tracks are as smooth as they come—at least for now.
Bull Verdict:
If price action were a poker hand, bitcoin is holding a solid flush. The consistent uptrend across all timeframes, coupled with full alignment across exponential and simple moving averages, signals strength. While volume may have taken a coffee break, momentum indicators like the moving average convergence divergence (MACD) and raw momentum are still on the dance floor. Unless resistance levels at $118,000 and $126,000 prove impenetrable, the bulls might just have enough in the tank for another leg higher.
Bear Verdict:
Despite the pretty price tag, bitcoin might be putting on lipstick for a party it doesn’t have the energy to attend. Flattening momentum on shorter timeframes, fading volume, and resistance crowding the upper range ($116,400–$126,000) could trap the price in a consolidation cage. If support at $114,500 breaks, the bullish dress rehearsal might end early—with downside targets lurking below $113,000.
- Where is bitcoin trading now?
Bitcoin is currently priced at $115,384 with intraday movement between $113,083 and $116,381. - What’s the local support level for bitcoin?
Key support zones are near $114,500 and $113,000 based on recent hourly and 4-hour charts. - Is bitcoin showing bullish signs today?
All major moving averages are trending upward, indicating broad bullish alignment. - What’s holding bitcoin back from higher highs?
Weakening volume and resistance near $116,400 to $126,000 are capping upward momentum.
免责声明:本文章仅代表作者个人观点,不代表本平台的立场和观点。本文章仅供信息分享,不构成对任何人的任何投资建议。用户与作者之间的任何争议,与本平台无关。如网页中刊载的文章或图片涉及侵权,请提供相关的权利证明和身份证明发送邮件到support@aicoin.com,本平台相关工作人员将会进行核查。


