比赛开始了,$5,000是终点线。但哪个资产会先到达——黄金还是以太坊?
在Myriad上,由Decrypt的母公司Dastan构建的预测市场,交易者们已经下注:65.5%的资金押注以太坊在黄金之前达到$5,000。
考虑到黄金今天的交易价格为$4,115,距离目标更近,尽管它经历了十多年中最大的一天修正(在十多年中最大的一天修正),这是一项大胆的预测。但技术分析揭示了为什么加密货币交易者可能是对的——以及他们可能是多么错误。
以太坊(ETH)价格:爆发前的压缩?
以太坊昨天收盘于$3,892,较前一日下跌2.3%,在盘中触及$4,112的高点。目前的交易价格约为$3,900。周线图显示ETH正在巩固,似乎形成了经典的压缩模式,所有主要技术指标仍然略显看涨。
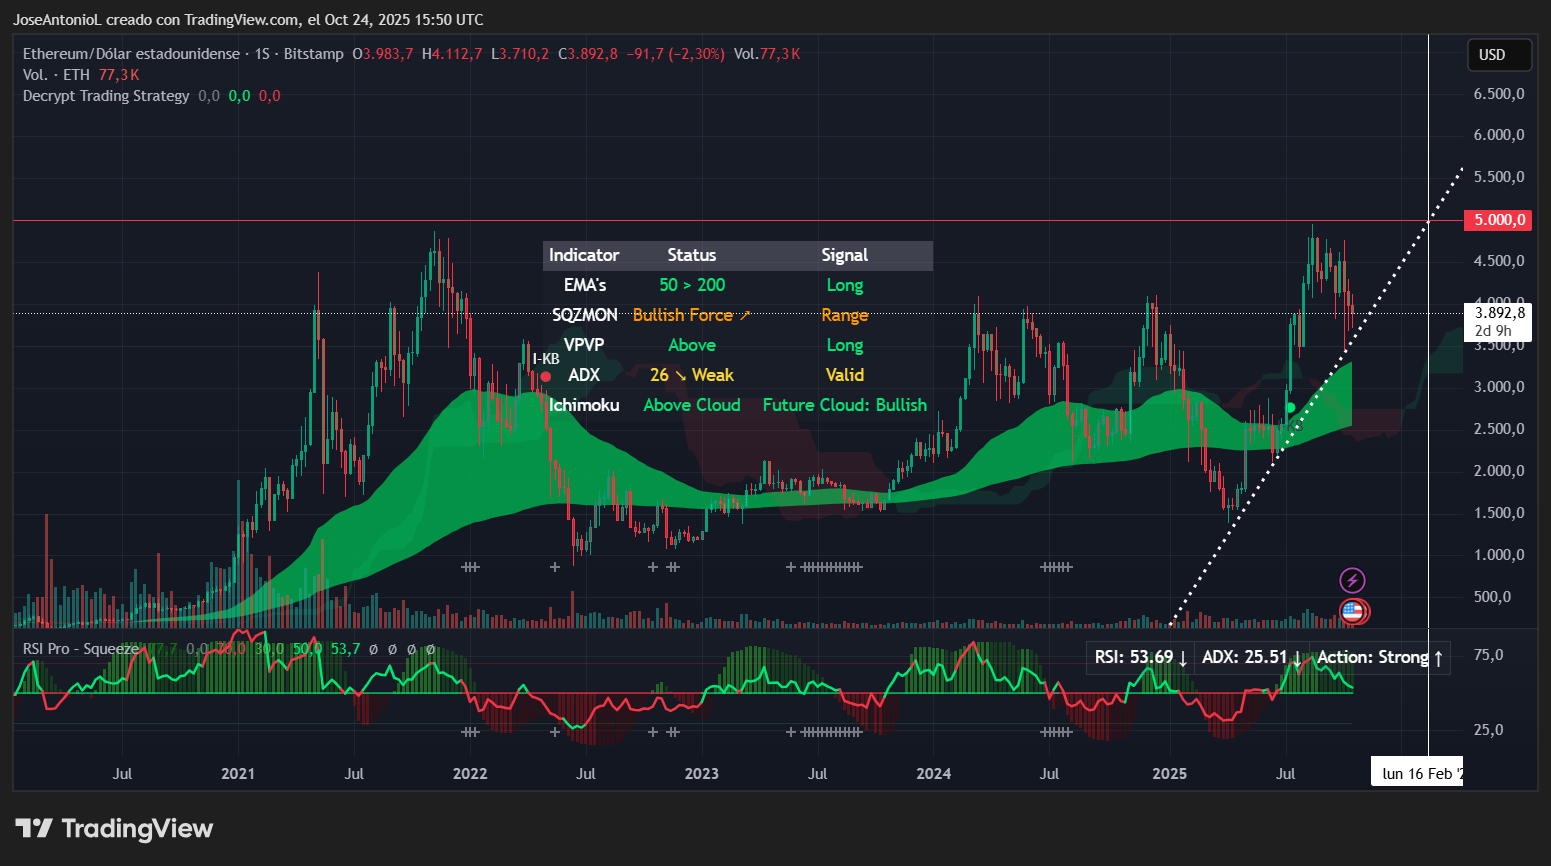
以太坊价格数据。图片来源:Tradingview
过去50周的平均价格(大约一年,交易者称之为EMA 50)高于过去200周的平均价格(EMA 200,通常被视为完整的加密市场周期),这些移动平均线充当动态支撑位。当较快的EMA上穿较慢的EMA(短期在长期之上)时,意味着交易者预计整体市场走势在长期内是看涨的。
平均方向指数(ADX)为25.51,刚好超过关键的25阈值。ADX测量趋势强度而不考虑方向——超过25意味着存在实际趋势,而不仅仅是随机噪音。这个读数显示出一个有效但正在减弱的趋势。它并没有强烈的动量,但足以表明多头仍然有一些动力。
相对强弱指数(RSI)为53.69,正好位于中性区域的中心。RSI在0-100的范围内测量超买和超卖条件。超过70通常会触发交易者的获利了结;低于30则吸引抄底者。在53的水平上,ETH既没有被过度延伸也没有被超卖——它处于一个适中的区域,任何方向都有可能。
在支撑和阻力方面,从更广泛的角度来看,有至少两种情景需要考虑。
乐观的情景显示ETH处于短期修正中,自2025年4月以来遵循更高低点的模式。如果有效,这条支撑线(图中虚线白色)将使ETH至少在2026年2月达到$5K。
还有一个悲观的情景显示ETH处于多年的水平通道中,币价在接近$5K的阻力位后反弹。如果这是情景,短期虚线将失效,ETH可能在明年一路修正到约$2K(如果历史重演,这也预计将是一个加密冬季)。
黄金与以太坊:市值现实检查
在这里,预测市场变得有趣。以太坊需要30%的涨幅才能达到$5,000。黄金只需要20%。简单的数学表明黄金的距离更短——但简单的数学并没有考虑市场动态。
黄金的市值约为$28万亿。以太坊呢?略低于$5000亿。这差了56倍。推动黄金价格需要巨额的资本流入,因为你是在对抗世界上最大的价值储存的重量。中央银行、机构和主权财富基金的行动速度并不快。
以太坊可以在两周内因零售热情和机构FOMO激增20%——这正是发生在8月4日至11日之间的情况,当时ETH从约$3,200飙升至$3,850。黄金上一次20%的波动?那花了三个月,从7月到10月缓慢磨蹭,直到本周的修正。
考虑长期轨迹:自2016年以来,黄金一直保持看涨,九年间复合增长约350%。缓慢、稳定、机构级的收益。
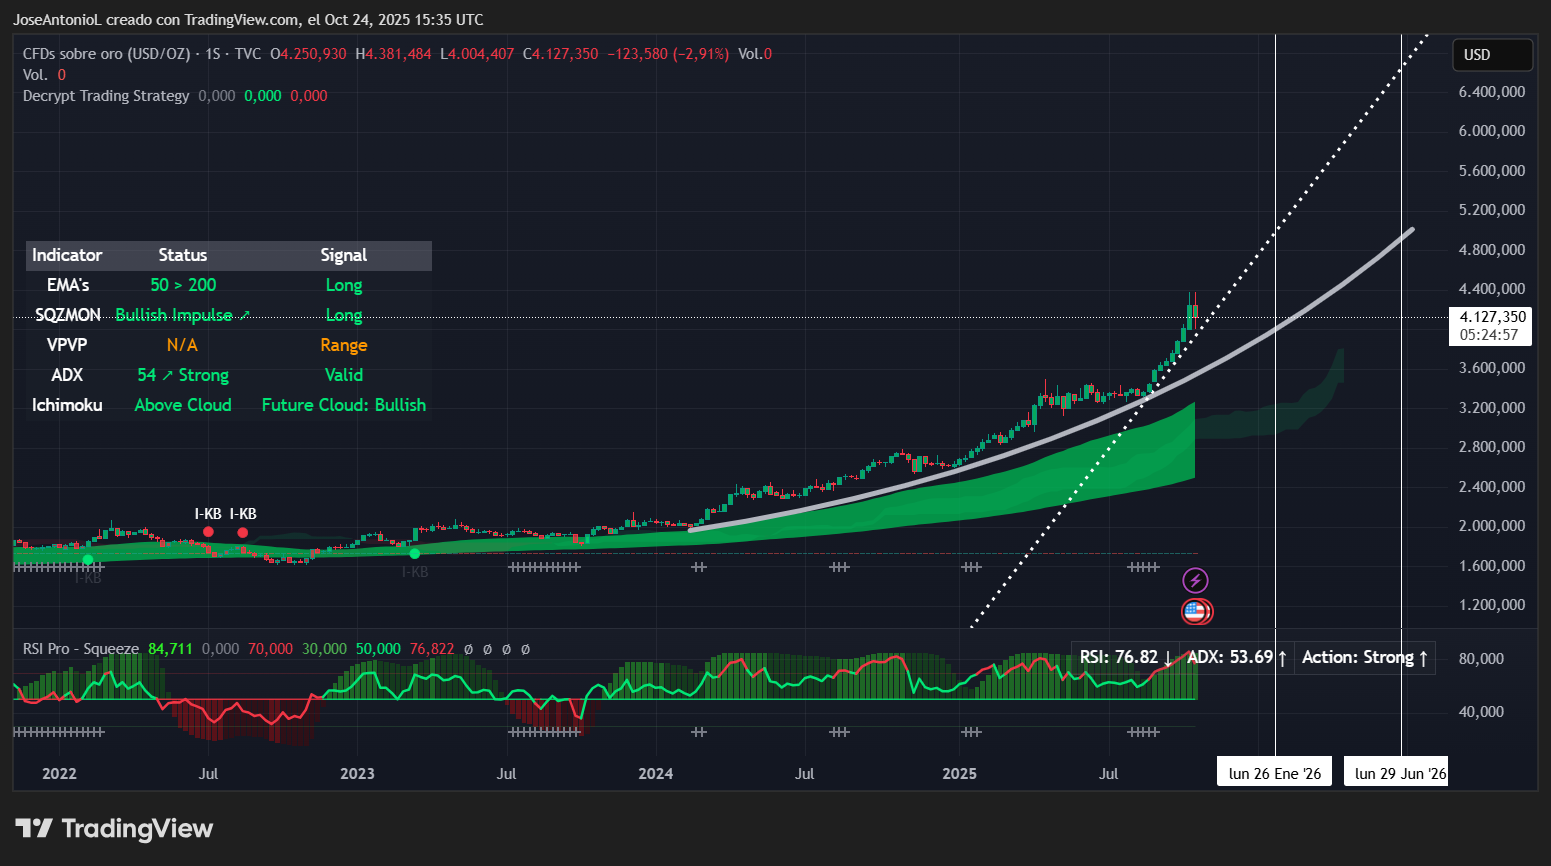
以太坊价格数据。图片来源:Tradingview
以太坊呢?在2018年和2022年的加密冬季中,它的价值两次损失了80%。但在每次恢复后,它都爆炸性增长——从2020年的低点到2021年的峰值上涨了3000%。波动性是双向的。
黄金是世界的储备价值存储。在市场危机期间,黄金不会崩溃——它通常会在投资者逃向安全时上涨。2008年的金融危机、2020年的疫情、地缘政治紧张局势——黄金在不确定性中蓬勃发展。对于以太坊来说,加密冬季是真实存在的。
在预测方面,如果市场整体保持看涨,预计ETH将在明年初达到$5K。黄金看起来更稳固,看涨但波动较慢。如果最乐观的支撑得到尊重,它应该在通往$5K的路上与以太坊并驾齐驱(虚线白色)。如果它降温并保持多年的走势,可能在2026年中期达到该标记(实线曲线)。
速度与确定性
这对预测者来说无疑是一个艰难的判断,因为黄金需要的不仅仅是技术分析。而且,加密市场在过去两年中发生了很大变化,这可能影响了每个主要熊市对应三个牛市的历史模式。
以太坊可能更快达到$5,000——如果看涨的设置向上解决,可能在4-8周内。30%的波动在ETH的正常波动范围内,而压缩模式表明大幅波动即将到来。Myriad交易者对ETH上涨至$4,500(距离$5,000目标仅15%)的赔率为69.2%,在短期看涨的情况下有明确的信心。
但这个陈述中有一个关键的“如果”。如果宏观条件保持稳定。如果加密市场没有面临突如其来的监管冲击。如果比特币维持在$100,000以上的支撑。如果风险偏好在加密冬季恐惧加剧时没有崩溃。
黄金更有可能最终达到$5,000——但可能需要几个月。20%的波动需要动员数十亿的资本。
Myriad市场显示65.5%的赔率在ETH上,基本上是在押注速度而非确定性。它在押注ETH较低的市值和较高的波动性使其能够在黄金的机构步伐到达之前冲刺到$5,000。技术指标支持这一论点——ETH被压缩并准备移动,而黄金刚刚经历了十年来最大的一天修正,可能需要时间来巩固。
作者表达的观点和意见仅供信息参考,并不构成财务、投资或其他建议。
免责声明:本文章仅代表作者个人观点,不代表本平台的立场和观点。本文章仅供信息分享,不构成对任何人的任何投资建议。用户与作者之间的任何争议,与本平台无关。如网页中刊载的文章或图片涉及侵权,请提供相关的权利证明和身份证明发送邮件到support@aicoin.com,本平台相关工作人员将会进行核查。


