撰文:Frank,PANews
尽管已经过去了十多日,但 10 月 11 日的闪崩行情仍让市场惊魂未定。当天许多代币价格在极短时间内接近「归零」,随后又上演了千倍甚至万倍的暴力反弹,市场情绪极度恐慌。
这场史诗级的暴跌究竟有多严重?是哪些类别(Narrative)的代币受创最深?在惊人的反弹数据背后,市场的「真实」创伤是否已经恢复?
更重要的是,市场普遍猜测的「流动性枯竭」是否是这场危机的真正元凶?为了厘清真相,PANews 对币安交易所 10 月 10 日至 10 月 20 日期间的 430 个现货交易对进行了详细的数据分析。本文将通过多维度数据,逐层揭开这场极端行情背后的事实
本次数据分析采用币安交易所,10 月 10 日至 10 月 10 月 20 日之间的 430 个现货交易对市场情况。
暴跌与「虚假」反弹:平均瞬时跌幅 66%,真实市场恢复几何?
从实际情况来看,10 月 11 日的代币价格剧烈变化的确可谓是触目惊心。当日,所有代币的平均的跌幅达到了 66%,其中最大跌幅超过 99% 的代币就有 7 个,最大跌幅超过 90% 以上的代币数量则达到了 32 个。最大跌幅超过 50% 的代币数量则达到 344 个,占比为 80%。
从数量的分布来看,跌幅在 60% 到 90% 之间的代币数量最多,总数达到 272 个,占比 63.2%。
在巨大的瞬时跌幅之后,由于许多代币的价格短时间内都创造了一个极低的记录,这也让随后的反弹显得格外夸张。比如,IOTX 的低点反弹力度达到了 1230900%(最低点达到了 0.000001)。此外,像 ENJ、ATOM、ANKR 等几个代币的最大反弹都超过了千倍。而超过 10 倍的反弹代币也达到了 22 个,这也使得最低点反弹数据看起来有些脱离真实。据 PANews 统计,自 10 月 11 日低点至 10 月 20 日收盘时,所有代币的平均反弹力度达到了 5509%。
显然,光看这数据并不能代表实际情况,因此,PANews 再次统计了另一个角度的数据,即对比 10 月 20 日价格数据与 10 月 11 日暴跌前的开盘数据。以此来反映市场的真实下跌情况。从这个真实跌幅来看,目前,所有代币反弹后价格相比大跌前价格的平均跌幅约为 17.22%,相比前文所述的 66% 最大跌幅,说明反弹的力度还是较为明显。其中,有不少代币的价格甚至在反弹后超过了暴跌前的水平,数据显示,有 26 个代币的价格超过了 10 月 11 日的开盘价。
板块表现复盘:MEME 成「重灾区」,无差别下跌指向流动性问题
从代币的类别来看,是否有着不一样的结果?
首先,我们来关注一下公链的表现。
Layer 1 的公链在 10 月 11 日最大跌幅平均值约为 63%,这一数据表现与整体的跌幅相比并无明显的优势。而在 10 月 20 日反弹后的价格 10 月 11 日暴跌前的开盘数据对比,Layer 1 代币的整体下跌水平则为 19%,显然这个数据表现不及整体水平。也就是说,Layer 1 公链在这轮下跌当中并未像以往一样保持坚挺,反而跌幅更大一些。
Layer 2 的表现与 Layer1 类似,平均的最大跌幅为 65.8%,10 月 11 日开盘至 10 月 20 日跌幅约为 17.98%,同样不及平均水平。
整体来看,DeFi 和 AI 类别的代币整体要好于平均水平,首先在平均最大跌幅方面,这两个类别基本和整体水平打平,AI 类别的平均最大跌幅约为 63%,要好于整体的水平。而在 10 月 11 日开盘至 10 月 20 日跌幅方面,DeFi 代币的数据为 14%,说明 DeFi 类代币的反弹效果要强于整体水平。
而在所有类别当中,MEME 类代币的表现则表现最差,平均最大跌幅达到了 78%,成为当时波动最大的代币类别。另外,相比 10 月 11 日开盘价,截至 10 月 20 日的价格水平跌幅也达到了 20%,说明反弹的能量也不足。结合此前几次极端行情的历史表现来看,MEME 类代币的风险系数一贯较高,每当遭遇此类暴涨暴跌行情,其市场的脆弱程度就会被放大。
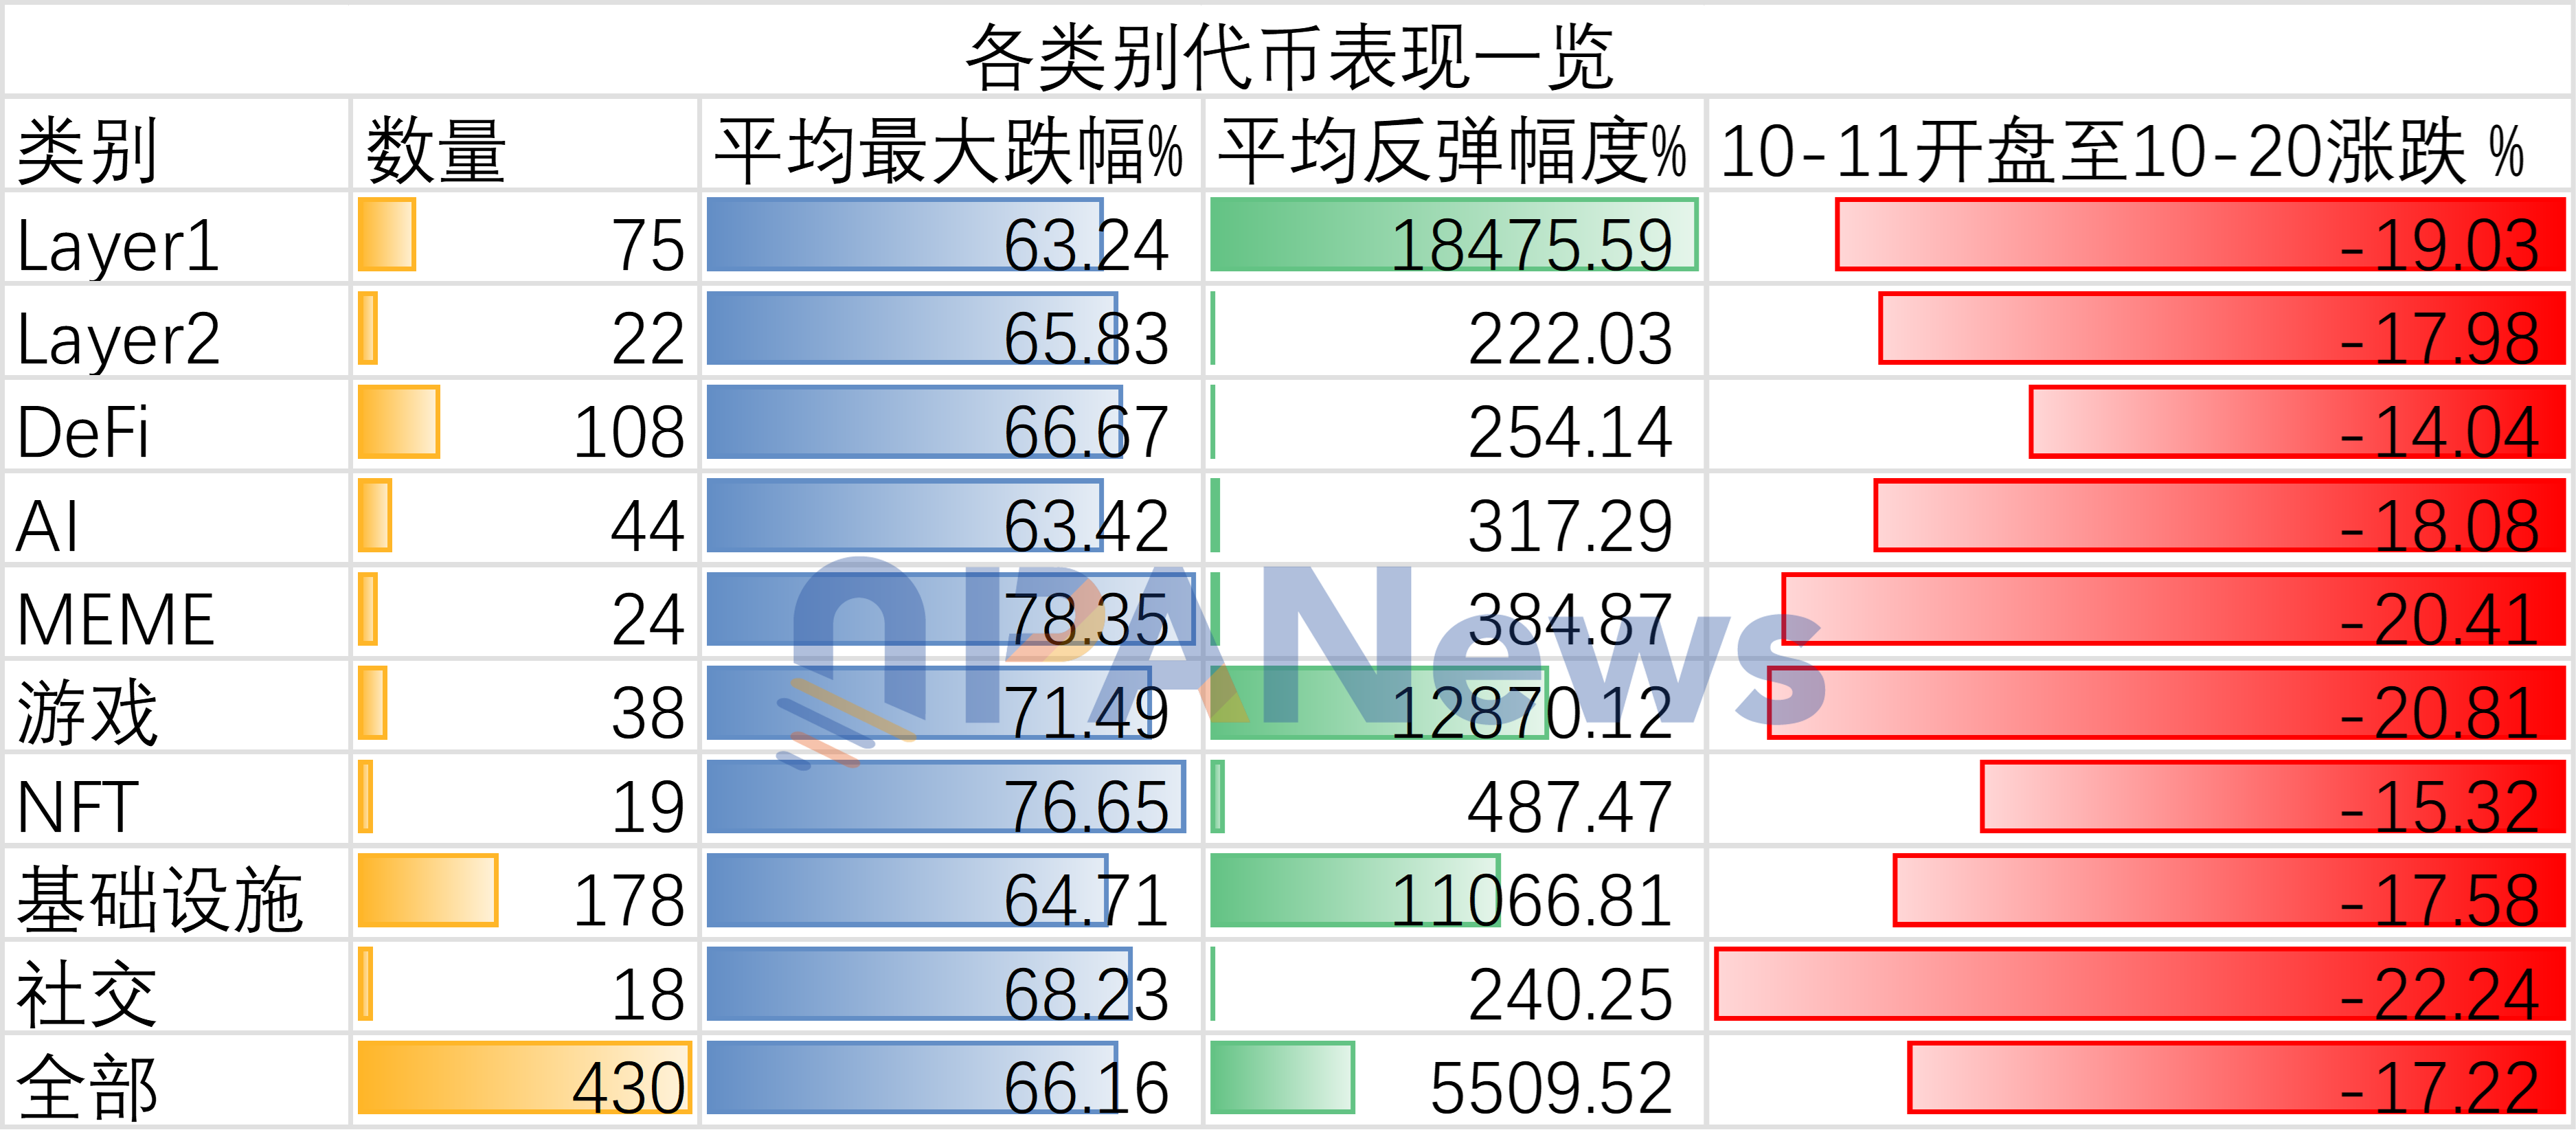
总体而言,从类别的角度来看这次暴跌当中,市场表现出近乎一视同仁的结果,并没有哪一个类别在这轮暴跌当中表现出众,而在随后的反弹当中,也基本保持在较为相似的水平线上。从这一点来看,此前市场关于这次暴跌由流动性引发的猜测似乎有迹可循。
探寻「真凶」:成交量揭示流动性与跌幅的强关联
为了验证流动性与 10 月 11 日暴跌之间有无直接关联,PANews 对于这些代币的流动性数据进行了进一步分析。以盘口价差为例,10 月 11 日当日跌幅小于 20% 的代币平均的盘口价格差约为 0.11%,而当日最大跌幅在 70%~80% 代币的盘口价差的平均值则为 0.13% 左右。
但这一数据似乎也有局限性,因为跌幅在超过 90% 代币当中,盘口价差则最低只有 0.07%,造成这一现象的原因可能是因为在暴跌之后,交易所针对这些当日波动更大的代币主动增加了流动性。(盘口价差数据采自 10 月 20 日数据)
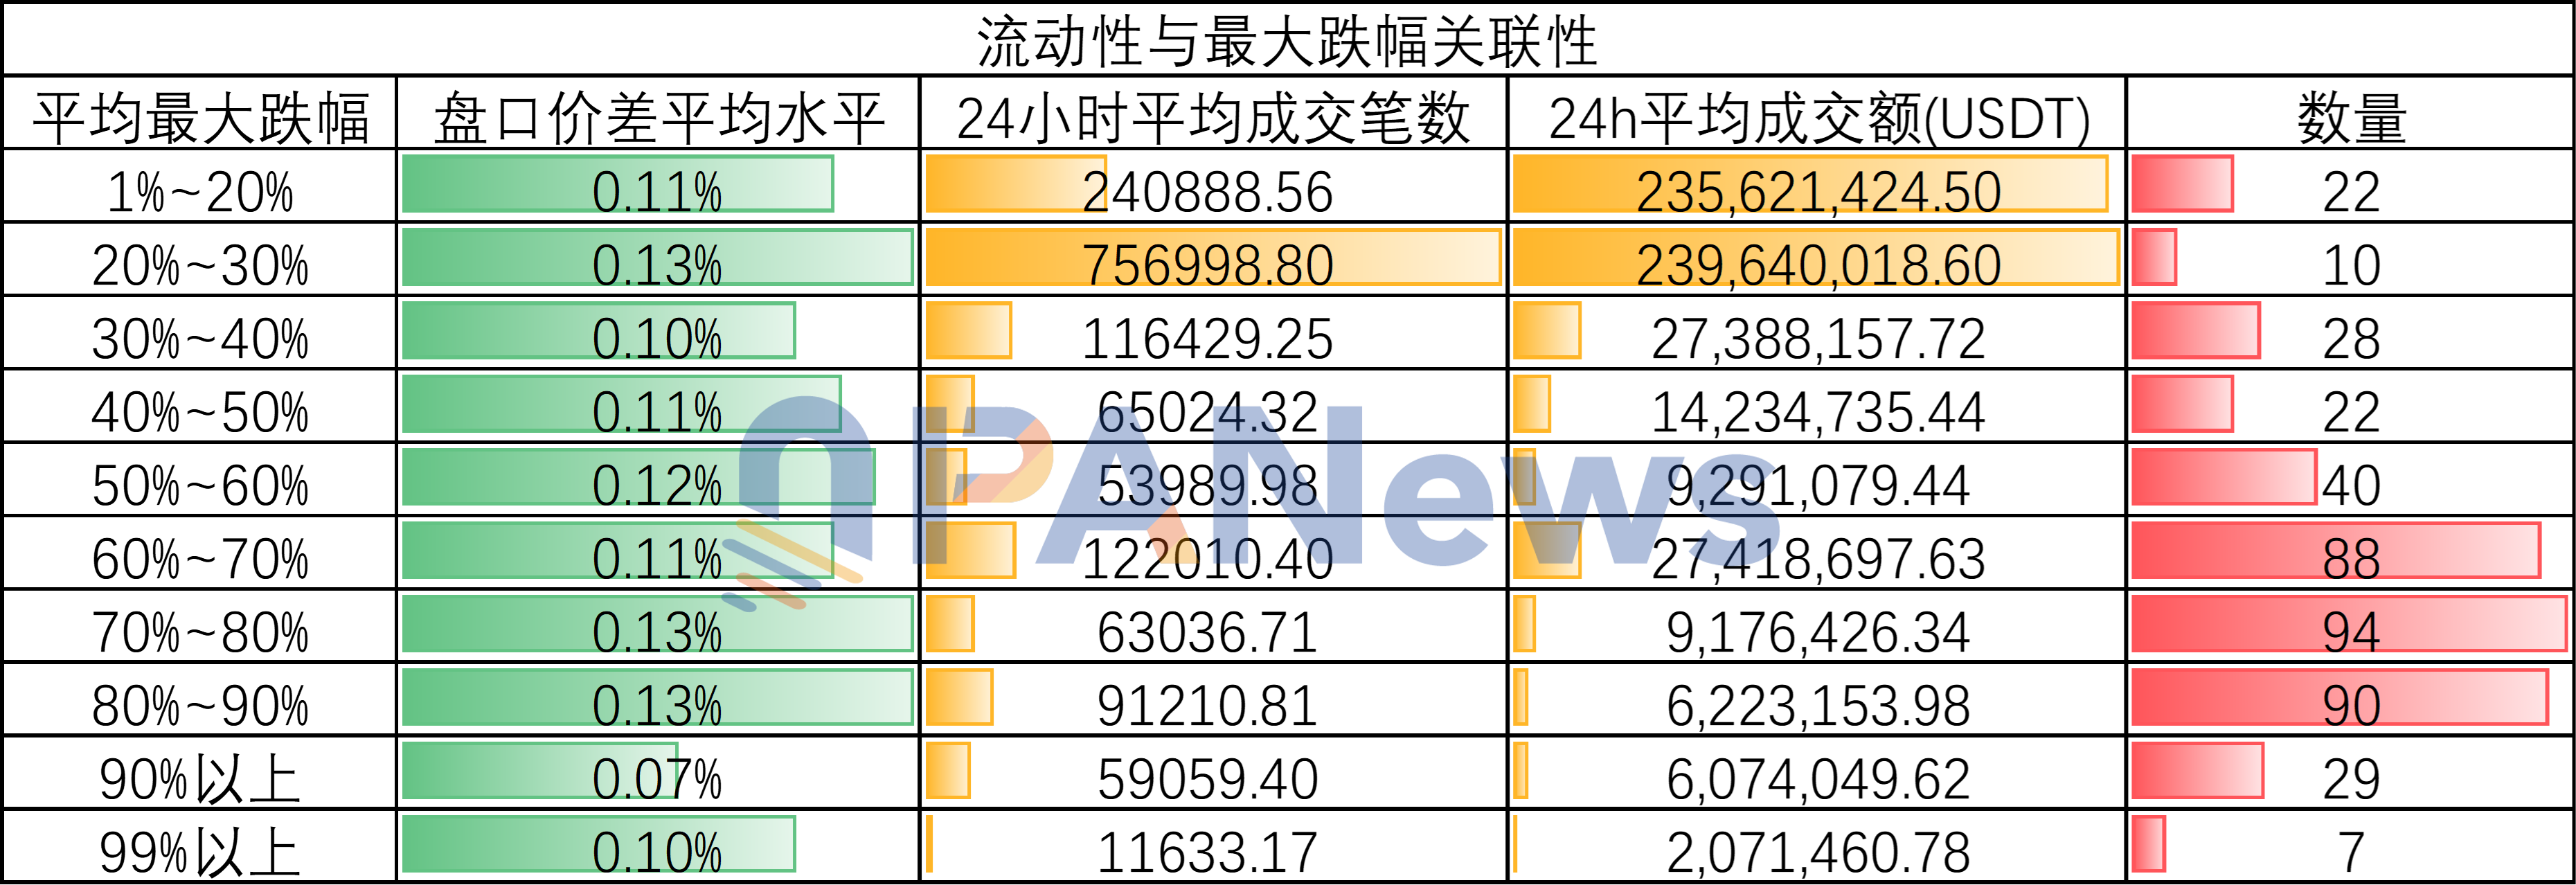
但在另一个数据当中,仍然揭示了流动性与这场暴跌的关联性。根据 PANews 统计的平均成交笔数与平均交易额数据显示,平均成交笔数与成交额越高的代币在 10 月 11 日的暴跌当中波动更小。
尤其是跌幅在 20%~30% 的代币,其 24 小时平均交易笔数达到了 75.7 万笔,24 小时平均成交额则更是达到了 2.39 亿美元。相反,跌幅超过 90% 的代币 24 小时平均交易笔数仅有 5.9 万笔,平均日交易量仅为 600 万美元左右。而跌幅超过 99% 的代币在这个方面的表现则更明显,日均交易笔数只有 1.16 万笔,日交易量只有 200 万美元左右。相比跌幅小于 30% 的代币,这些代币之间的交易额相差百倍。
相比之下,交易笔数和成交额的数据也更能反映市场的需求情况。由此看来,这场史诗级的暴跌背后,与流动性有着直接的关联。
市场元气恢复几何?
暴跌之后,对于后续方向的探究可能更值得关注。
首先从合约的持仓量来看,市场总体的合约持仓量随着这场暴跌出现了大幅下降,根据 Coinglass 的数据显示,10 月 8 日,市场的未平仓合约总量达到了历史高点 2335 亿美元,而到了 10 月 19 日,这一数据下降至 1466 亿美元,降幅达到了 37%。
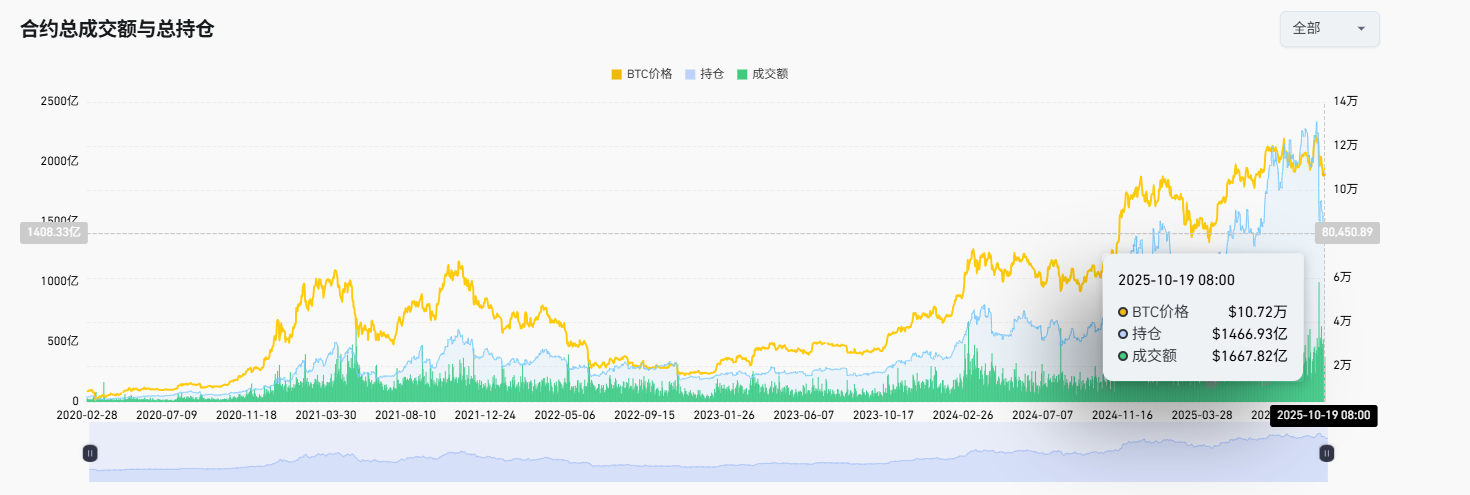

而这种持仓变化在一些主流山寨代币上表现的则更加明显。比如 XRP 和 DOGE 的持仓量下降均超过了 65%。一方面,这种持仓下降显示出市场经过这次大清洗短时间内将杠杆过高的问题解决。另一方面,合约持仓量大幅下降也显示出市场对于后期走势的不明确并处于观望状态,如果长期维持这样的状态,也可能说明又将进入一段冷静期。
此外, 从恐慌指数上,这段时间的恐慌指数再次跌破了 40,但仍维持在 20 以上,市场并未彻底进入极端恐慌。
稳定币数据方面,发行量并未因市场恐慌而中断增长,截至 10 月 21 日,稳定币发行量达到 3076 亿美元,仍在不断创新高。据 CoinDesk 报道,花旗集团看好稳定币推动加密货币下一轮增长的主要动力。
总的来说,10 月 11 日的市场暴跌既是一次无差别的市场屠戮,也是前期市场过热的必然结果。我们通过对这次不同寻常的暴跌深度研究后或许能得到几点启示。一方面,这次闪崩的终极元凶就是流动性不足。另一方面,也和市场过高的杠杆脱不了干系。
而在暴跌之后,好的一面是这种高杠杆已经被强行卸掉,对于后续的上涨减少了阻力(如果牛市还会持续的话),悲观的一面则是市场可能因此遭受重创而一蹶不振或需要较长时间修复。但无论是哪种情况,我们从中获取到最大的警示就是选择那些流动性更好的资产永远是规避风险的不二选择。
免责声明:本文章仅代表作者个人观点,不代表本平台的立场和观点。本文章仅供信息分享,不构成对任何人的任何投资建议。用户与作者之间的任何争议,与本平台无关。如网页中刊载的文章或图片涉及侵权,请提供相关的权利证明和身份证明发送邮件到support@aicoin.com,本平台相关工作人员将会进行核查。


