十月初还站在125000美元历史高点的比特币,在川普宣布对中国商品增收100%关税后急跌逾15%。过去24小时最低触及103500美元。这场由政治消息点燃的卖压,不仅让加密市场陷入恐慌,更是同步牵动现货ETF与杠杆部位的大规模调整。从宏观方面来看,近期比特币还是承受着较大的压力。
比特币在周五收盘报价106479美元,单日跌幅1.63%,单周跌幅扩大至8.72%,创下自七月以来最低收盘价。同时,以太坊也跟之走弱,24小时一度下探至3670美元附近。价格下滑引起杠杆清算,过去24小时全网合约爆仓10.2亿至12亿美元,其中多单占大头。比特币爆仓4.53亿美元,以太坊爆仓2.81亿美元。
面对如此剧烈的跌幅,大家近期需要留意三项重要指标
一、ETF资金流向是否持续流出;
二、全网未平仓合约水平位是否进一步降低;
三、中美贸易风险后续发展。
当资金流出放缓、未平仓合约没进一步降低,同时关税议题降温,市场才会有重回多头趋势的可能。
昨天大仙文中给出的先短多至107800,不知道有多少币友跟上,跟上的先恭喜了,没跟上的也不要着急,大仙尽量日更。好了废话不多说,继续通过比特币四小时图来分析接下来的走势。
比特币四小时图
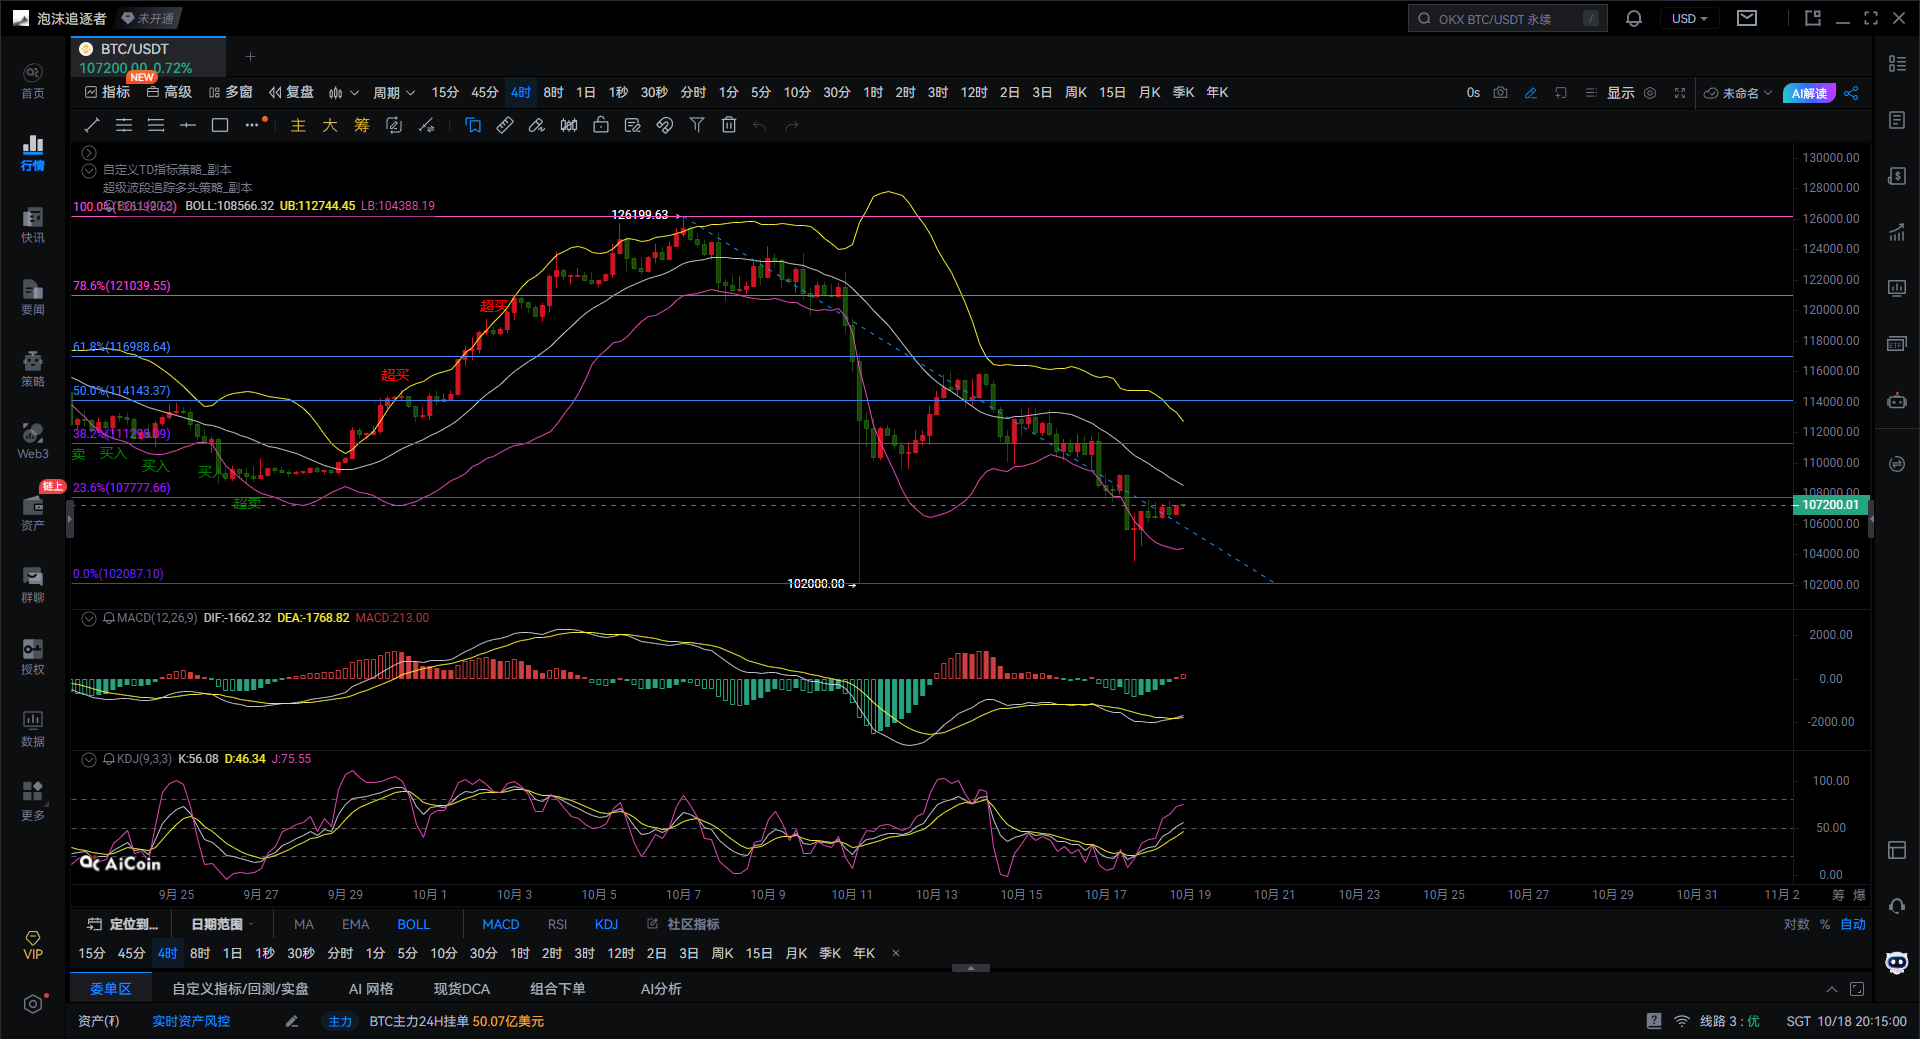
当前布林带开口向下,说明中期趋势依然偏空。价格目前位于中轨下方,并多次受中轨压制,说明上方卖压较强,市场尚未完成趋势反转信号。下轨在约104000附近,近期多次成为阶段性支撑区域。若价格无法有效突破中轨并收于其上,行情大概率继续沿下轨震荡。若价格有效站稳中轨,才有机会修复至上轨112700区域。同时需要注意的是,布林带下轨这一带成为短期关键支撑位,一旦失守,可能快速试探前低102800。
MACD指标中DIF线仍低于DEA线并在0轴下方运行,但两线间距逐步收窄,MACD绿色柱状图明显缩短,显示空头动能减弱,有出现底背离迹象。如果MACD形成金叉形成且柱状图由绿转红,可能迎来一波技术性反弹。相反,如果再次死叉并伴随MACD绿色柱状图扩张,那么就说明反弹仅为弱势修复,趋势仍延续下行。整体来看,MACD正在构筑低位的修复阶段,如果后续价格企稳在107000上方,并伴随放量,那么金叉确立概率较高,届时反弹目标可看向110000–112000区间。
KDJ目前K线值为56,D线值为46,J线值高达75,说明短线进入超买区。此前三线从低位形成金叉上行,推动了一波从103620到107000的反弹,但由于J线值偏高,短期存在一定回调风险。如果KDJ在高位形成死叉,则可能意味着反弹动力衰竭,价格再度回踩BOLL下轨支撑;但若KDJ维持金叉并高位钝化,则多头仍有进一步上攻的空间。整体来看,KDJ支持短线反弹延续,但需警惕超买区回调。
从9月低点102000到10月高点126199的上涨来看,价格目前正运行在23.6%(107777)与0%(102087)区间之间。此前多次在107000–108000附近获得支撑,说明该区域是关键防守位。若有效跌破23.6%回撤位,空头将推动价格回测前低102000附近。若反弹,则上方阻力依次为38.2%(111149)和50%(114143),而强压力位在61.8%(117137)。只有放量突破50%斐波那契水平,才能确认中期反转信号。
综合分析,比特币目前四小时图显示出短线反弹但中期偏空。短线支撑在107000和104000,关键支撑位102000。上方阻力看108500和110000,中期压力区间114000-117000。技术指标方面,如果MACD形成金叉且KDJ保持强势,可能反弹至110000-112000区间。但如果反弹失败跌破107000,可能会下探102000甚至测试100000关口。整体来看比特币处于技术修复阶段,市场情绪较为谨慎。短期重点关注107000-108500区间的多空争夺,突破方向将决定未来一周走势。
综上所述大仙给出以下建议供参考
比特币反弹至107800受阻可以做空,目标看至104000附近。
比特币反弹有效企稳107800可以顺势追多,目标看至110000-112000区间。
给你一个百分百准的建议,不如给你一个正确的思路与趋势,授人与鱼不如授人与渔,建议赚一时,思路学会赚一生!
撰稿时间:(2025-10-18,20:15)

(文-大仙说币)特此申明:网络发布具有延迟,以上建议仅供参考。投资有风险,入市需谨慎!
免责声明:本文章仅代表作者个人观点,不代表本平台的立场和观点。本文章仅供信息分享,不构成对任何人的任何投资建议。用户与作者之间的任何争议,与本平台无关。如网页中刊载的文章或图片涉及侵权,请提供相关的权利证明和身份证明发送邮件到support@aicoin.com,本平台相关工作人员将会进行核查。


