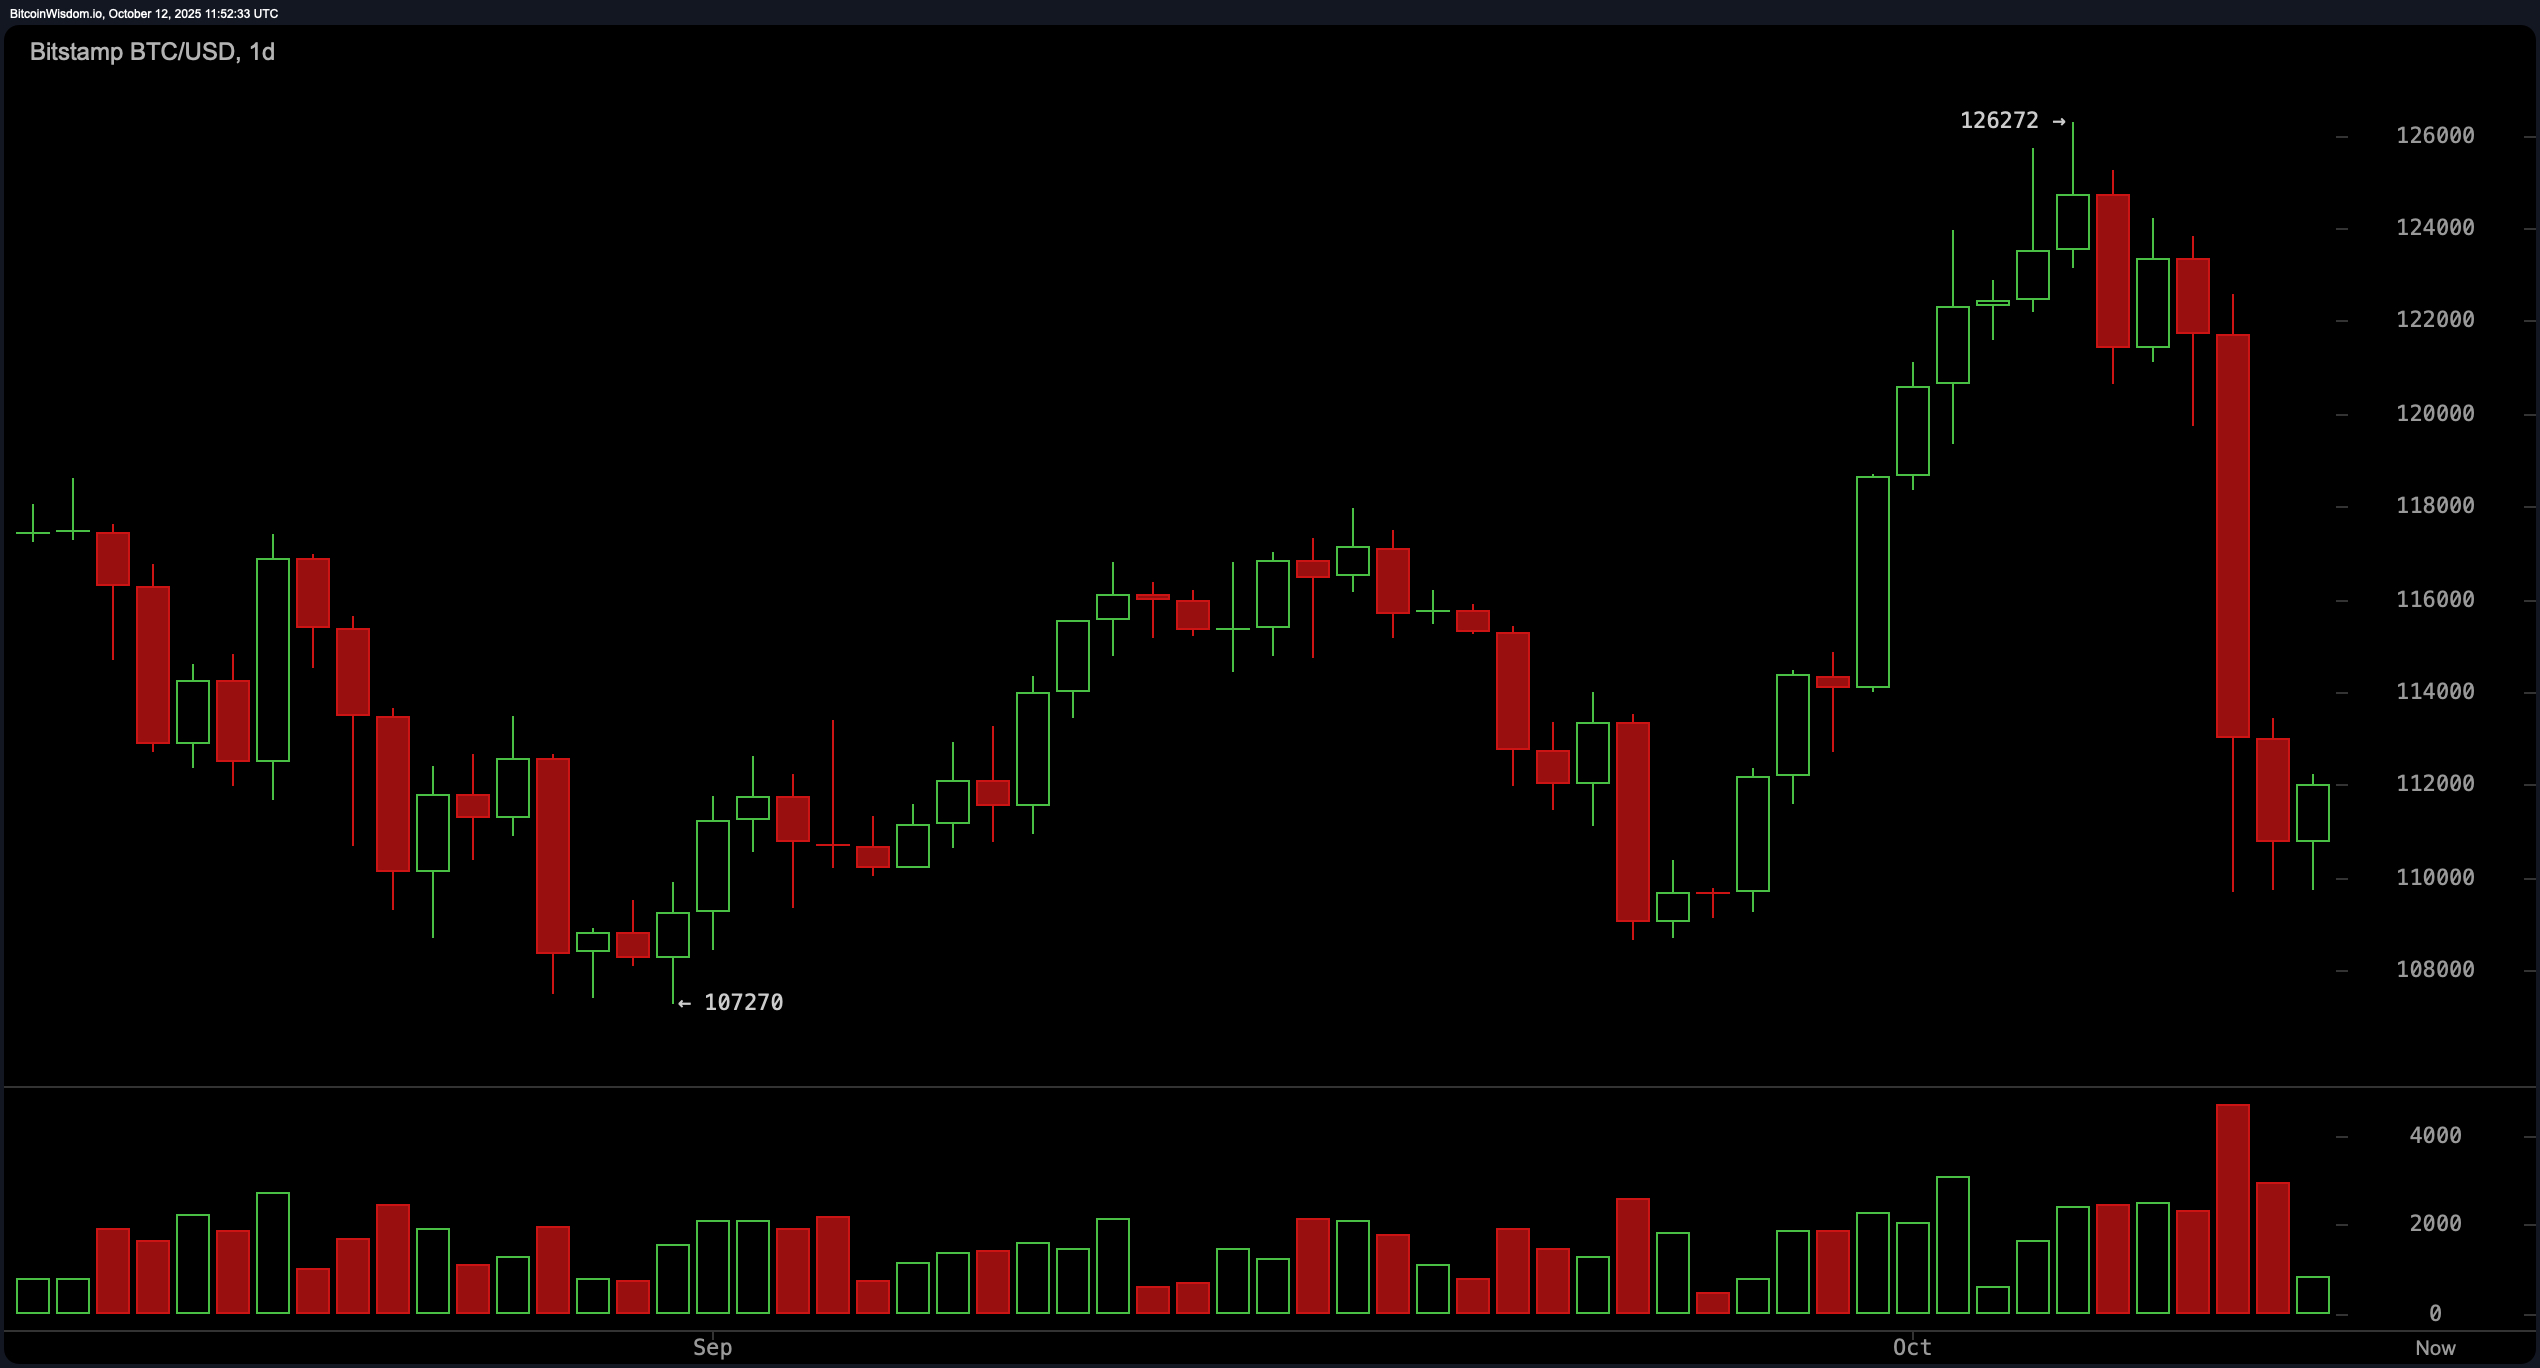
The broader technical landscape for bitcoin reflects a clear downtrend following its recent rejection from a high of $126,272. On the daily chart, at 8:30 a.m. EST on Sunday, the trend has sharply reversed, characterized by a bearish engulfing candlestick pattern and increasing red volume—an indication of strong overhead pressure.
Key resistance lies at $118,000 and $126,000, with immediate support around $107,000. Until price action decisively reclaims higher resistance levels, negative momentum is likely to dominate, favoring a strategy of fading rallies near key levels.

BTC/USD 1-day chart via Bitstamp on Oct. 12, 2025.
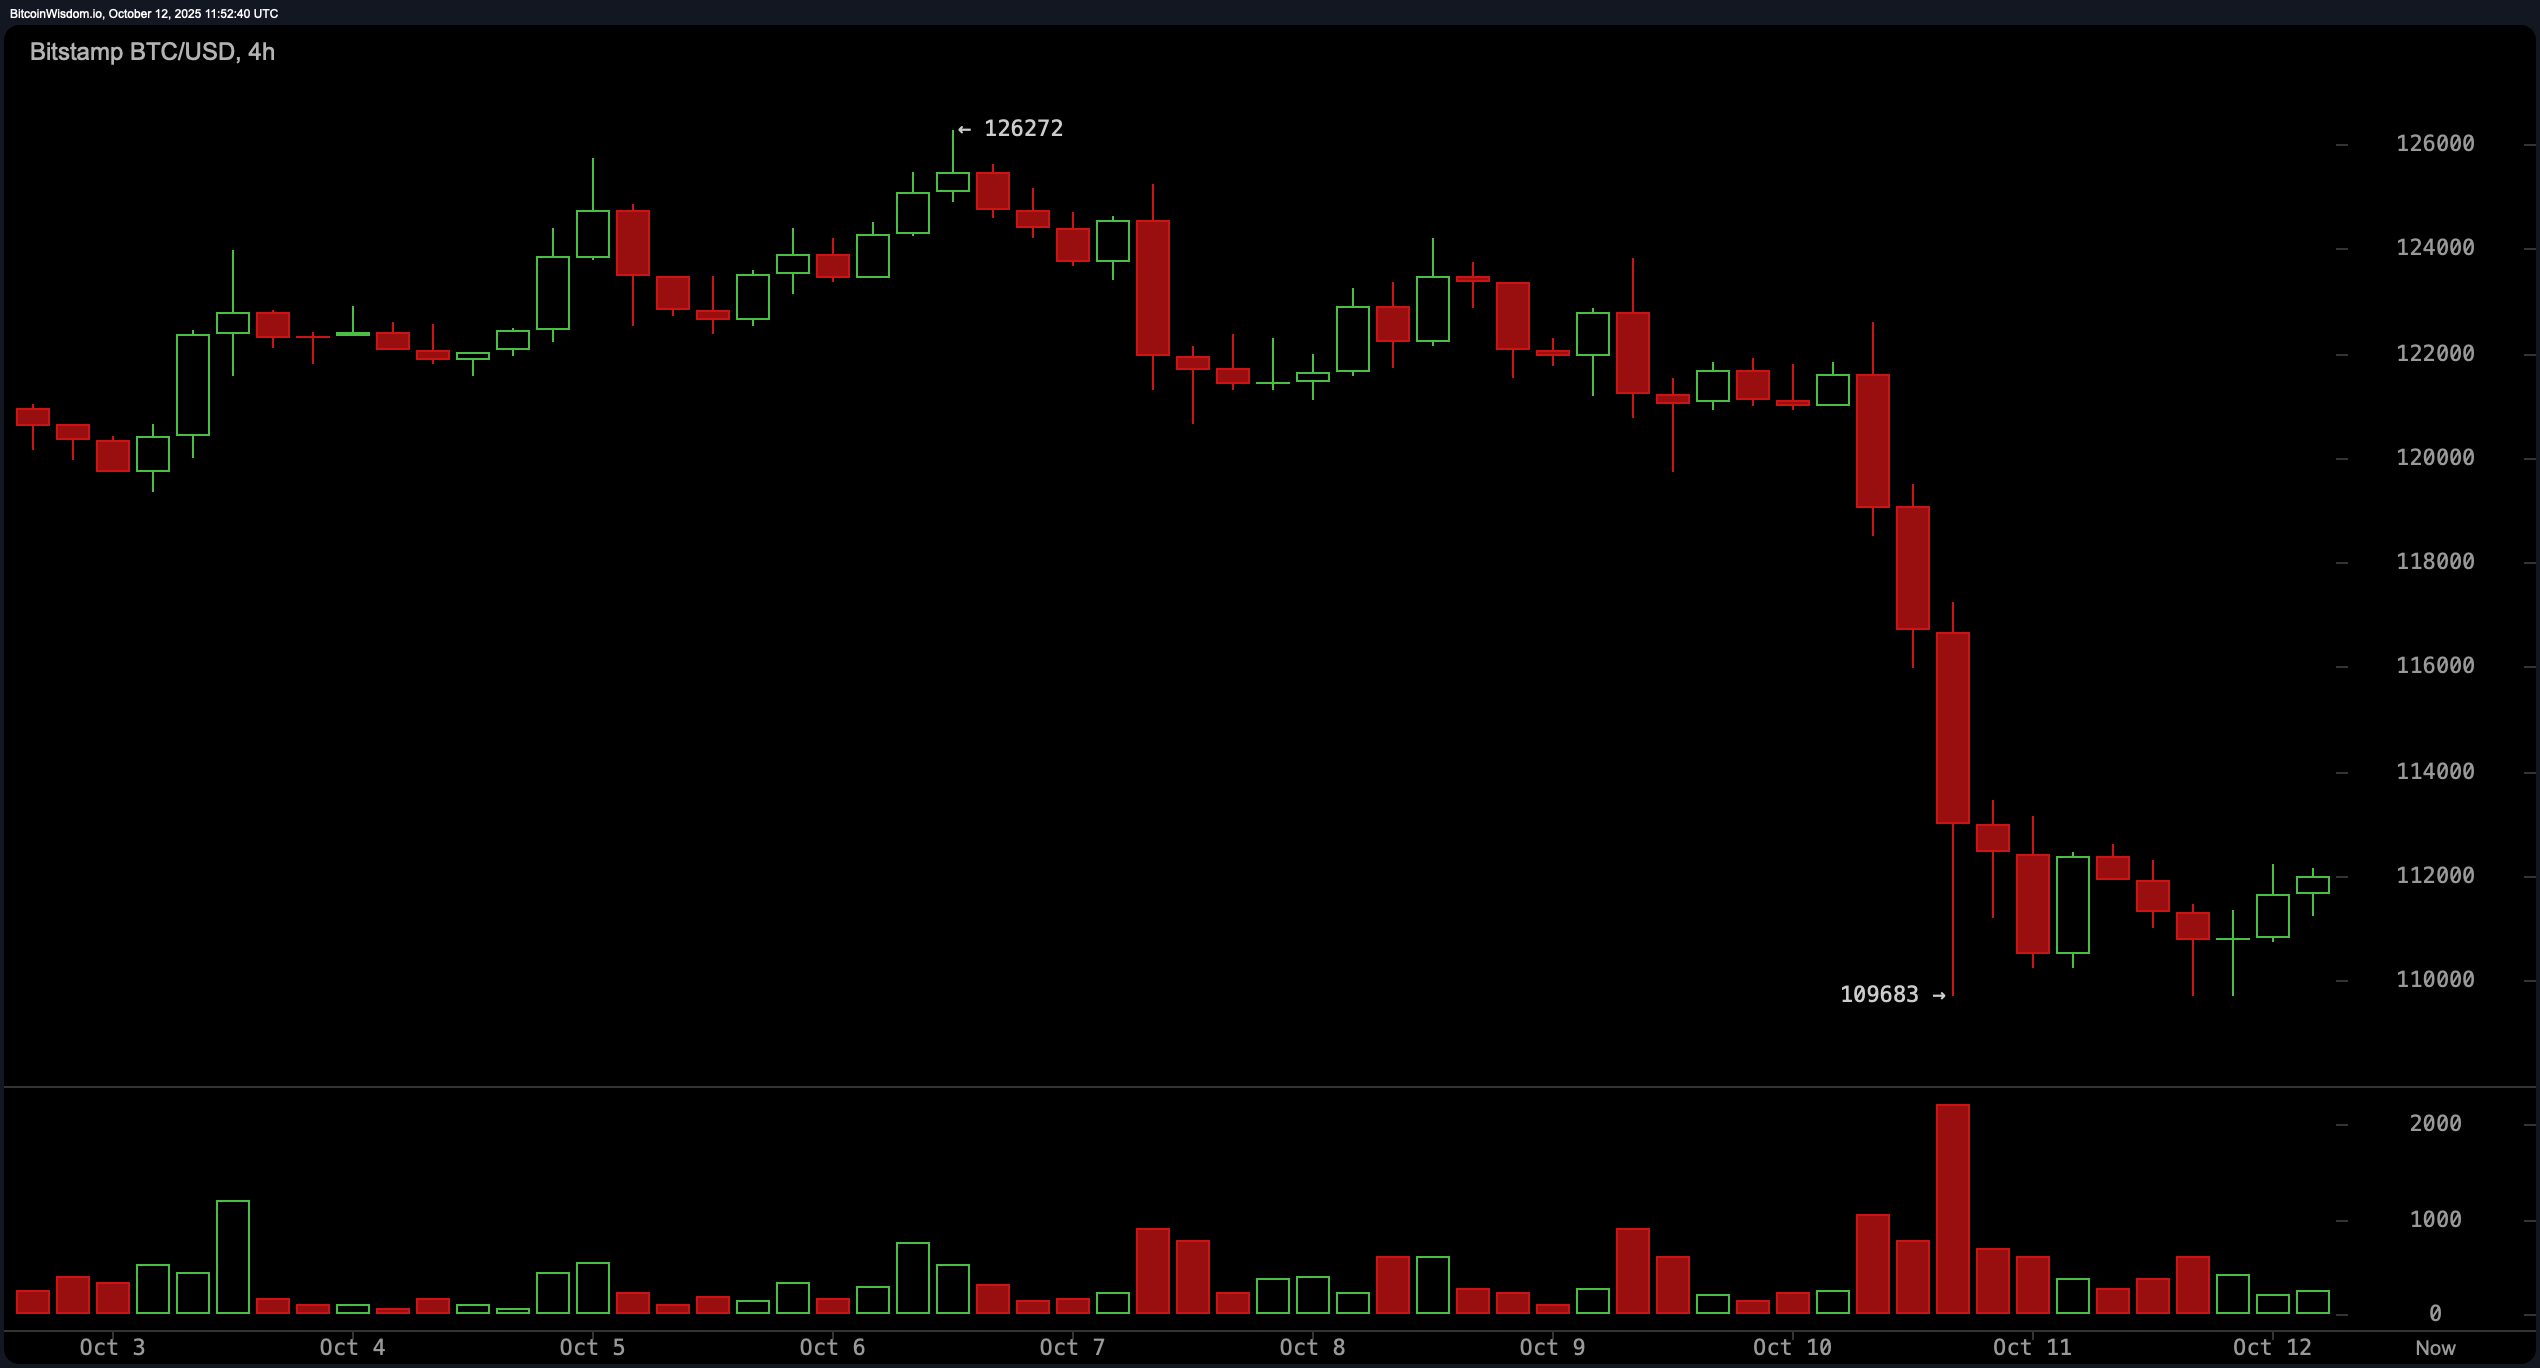
The 4-hour chart points to continued weakness, having formed a short-term bottom at $109,683 followed by a limited recovery. This rebound is marked by low conviction volume, suggesting a lack of enthusiasm from market participants. Structurally, bitcoin is trading within a potential bearish flag or short-lived upward correction, raising the probability of further declines unless the price can break and sustain above the $114,000–$115,000 band. Failure to clear this threshold could prompt another move toward the $109,000 region.

BTC/USD 4-hour chart via Bitstamp on Oct. 12, 2025.
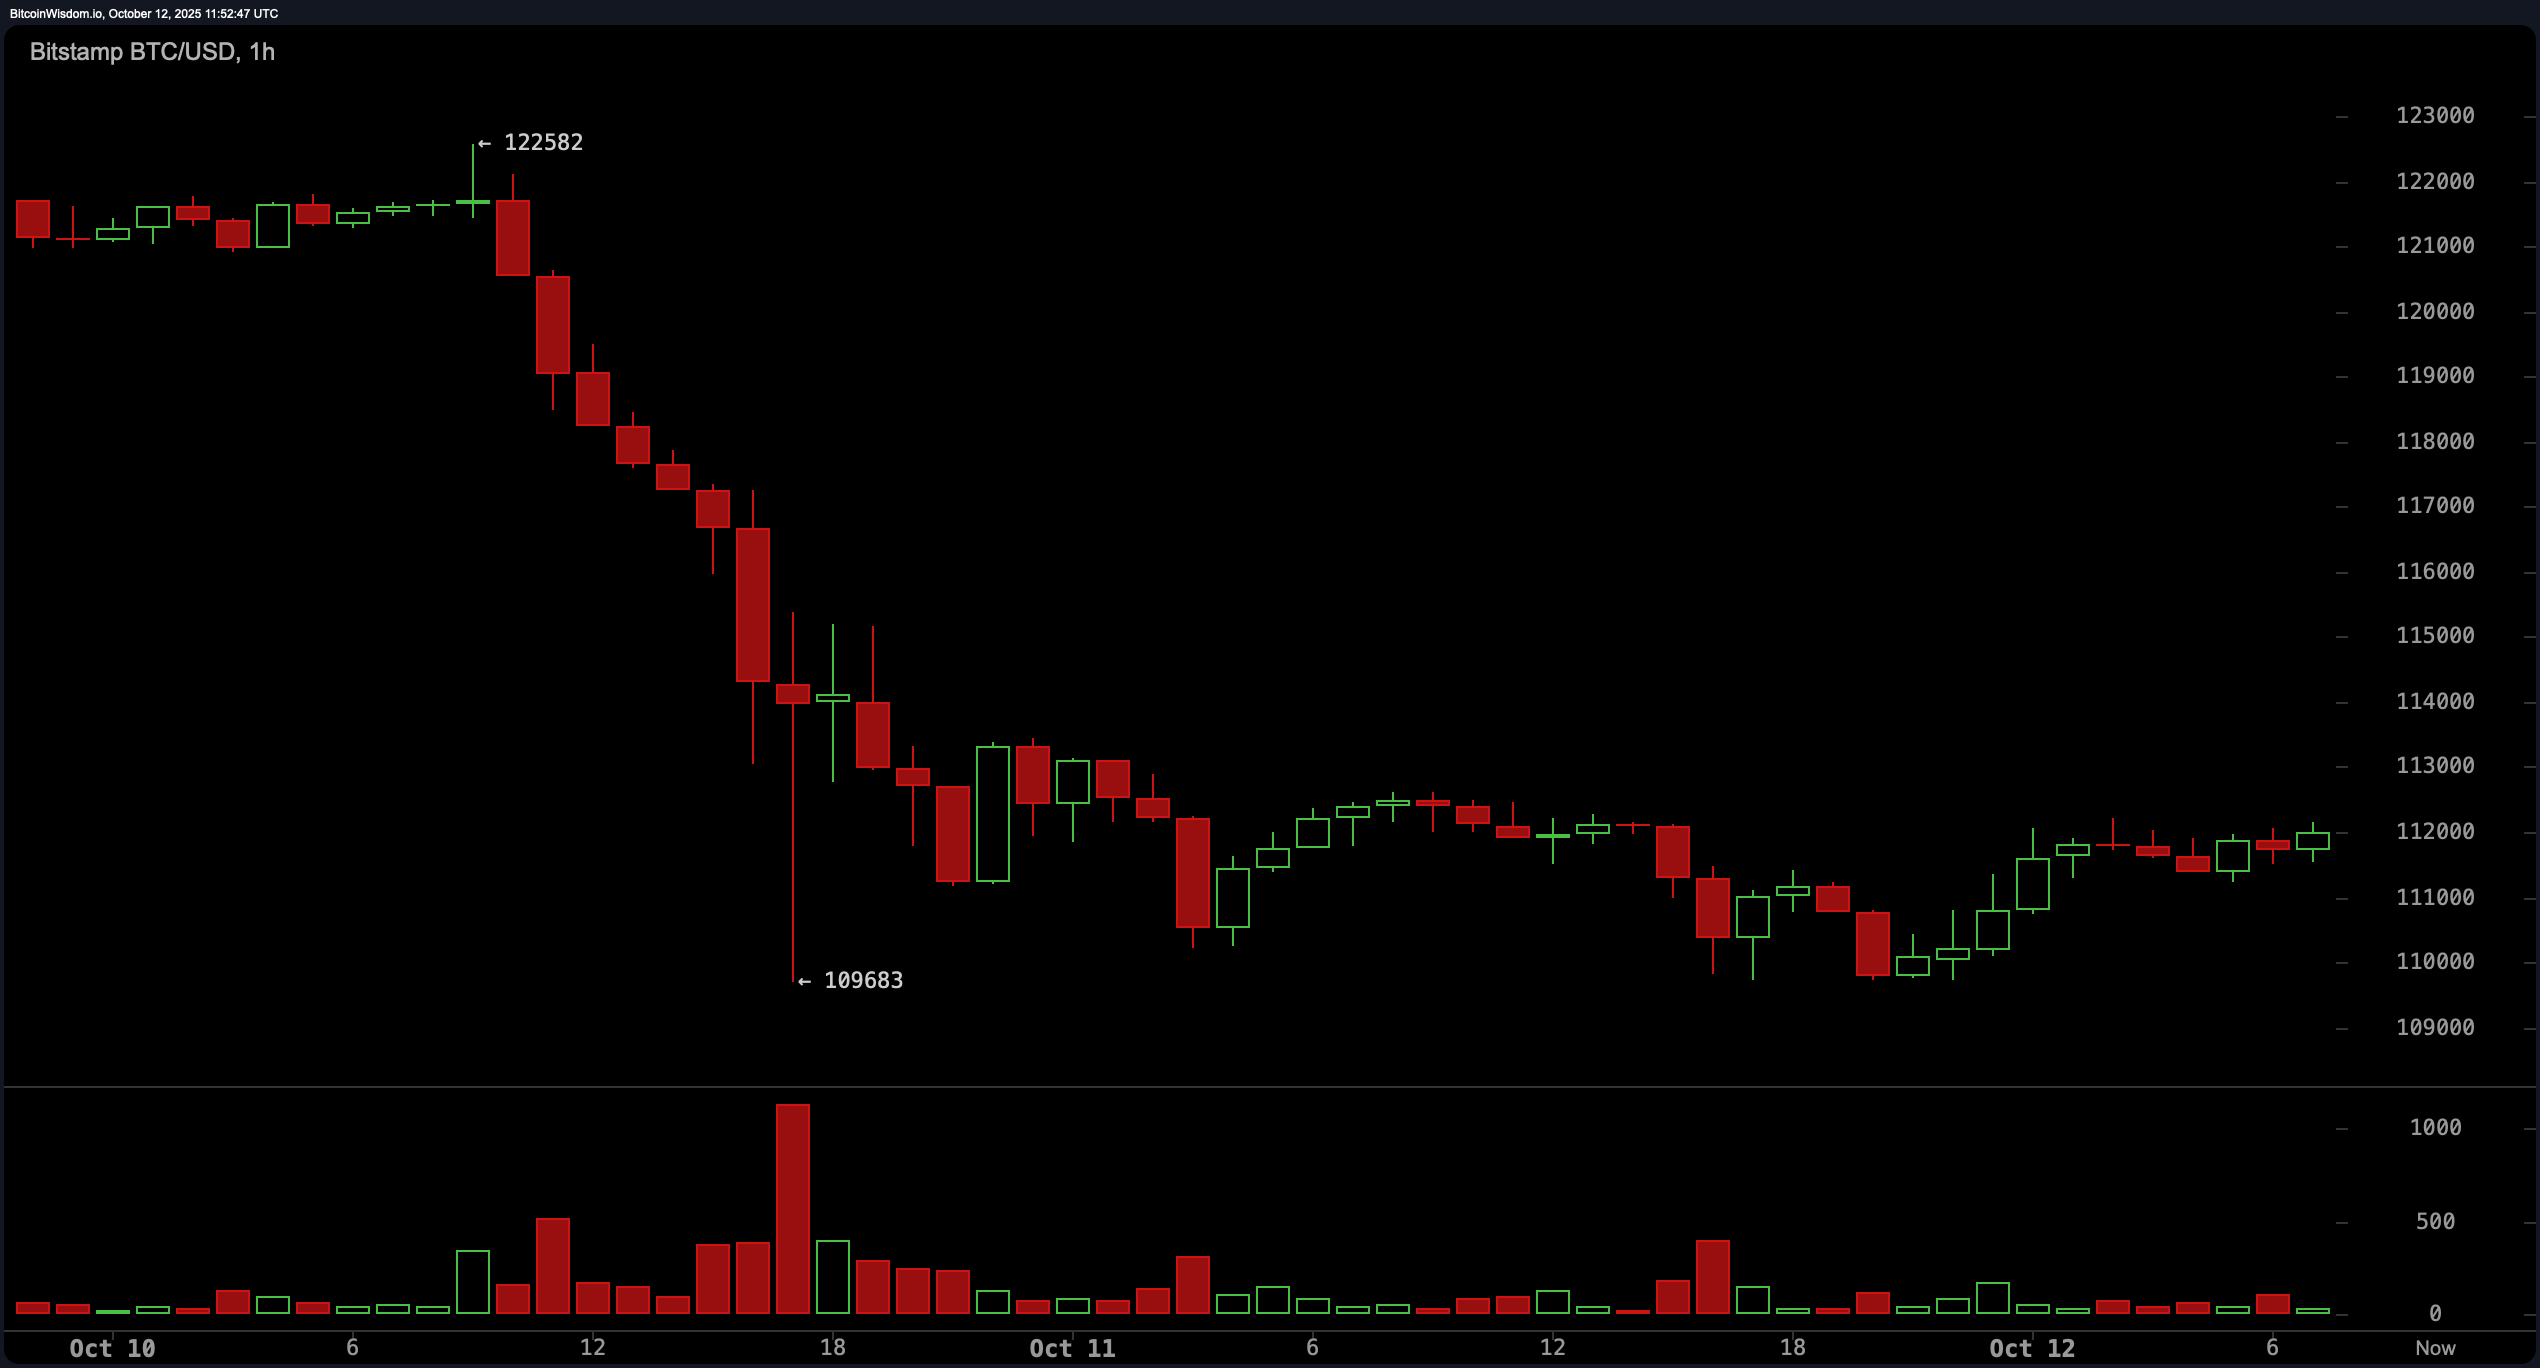
From a short-term perspective, the 1-hour chart shows bitcoin in a consolidation phase after a sharp decline from $122,582 to $109,683. Current price behavior appears to be coiling, which could indicate either accumulation or distribution, depending on the next breakout direction. Volume has notably decreased during the recent bounce, contrasting with the heavier volume observed during the drop—an indicator that current upward movement lacks strength. A clear push above $113,000 with supporting volume would suggest short-term bullish momentum, though the prevailing structure still leans bearish.

BTC/USD 1-hour chart via Bitstamp on Oct. 12, 2025.
A review of key indicators highlights the prevailing indecision and downward tilt in momentum. The relative strength index (RSI) sits at 42, suggesting neutral market conditions. The stochastic oscillator reads 15, and the commodity channel index (CCI) is at −69, both indicating lackluster momentum. The average directional index (ADX) at 28 points to a trend that has not yet reached strong directional clarity. Meanwhile, the momentum indicator stands at −8,571, and the moving average convergence divergence (MACD) level is 429—both suggesting weakness in the recent price trend.
The moving average (MA) summary also reflects persistent downside pressure. Every short- and mid-term exponential moving average (EMA) and simple moving average (SMA) up to the 100-period shows the current price trending below their respective levels. These include the 10, 20, 30, 50, and 100-period EMA and SMA metrics. In contrast, the 200-period EMA and 200-period SMA show the current price above those longer-term averages, indicating potential long-term support near $107,000. This divergence between short-term weakness and long-term structure suggests that while the broader uptrend may still be intact, immediate market sentiment remains cautious.
Bull Verdict:
Despite recent price weakness, bitcoin maintains structural integrity above key long-term moving averages, suggesting potential for recovery if buyers reclaim the $114,000–$116,000 range. A decisive breakout with volume above $113,000 could signal renewed bullish momentum and continuation of the broader uptrend.
Bear Verdict:
With momentum indicators leaning negative and price consistently rejected at lower resistance zones, bitcoin remains vulnerable to further downside. Failure to reclaim the $114,000–$115,000 range increases the probability of a retest of $109,000 or even a move toward $107,000, in line with the dominant short-term bearish trend.
🧠 FAQ
- Why is bitcoin’s price consolidating right now?
Bitcoin is trading in a tight range as traders wait for a clear breakout above $113,000 or a breakdown below $109,000. - What levels are critical for bitcoin’s next move?
Resistance sits near $114,000–$115,000, while support remains around $107,000, defining the current trading battleground. - Is the broader bitcoin trend still bullish?
Despite short-term weakness, bitcoin holds above its 200-day moving averages, signaling that the long-term uptrend remains intact. - What could trigger renewed bullish momentum?
A volume-backed move above $113,000–$116,000 could shift sentiment and confirm a return of buyer strength.
免责声明:本文章仅代表作者个人观点,不代表本平台的立场和观点。本文章仅供信息分享,不构成对任何人的任何投资建议。用户与作者之间的任何争议,与本平台无关。如网页中刊载的文章或图片涉及侵权,请提供相关的权利证明和身份证明发送邮件到support@aicoin.com,本平台相关工作人员将会进行核查。


