Analyst Chen Shu: Approaching the High Breakthrough on October 4th, Analysis of Bitcoin and Ethereum Trends
From the daily chart of Bitcoin, the price has closed with large red candles for three consecutive days, nearing the previous high of 12.4. Currently, the daily chart shows a strong upward trend, and the probability of breaking through is quite high. However, it is important to note the selling pressure at the previous high point of 12.4. On the 4-hour chart, the short-term trend is steadily moving upwards along the MA5/10 daily moving averages. As long as it does not break below the 5/10 daily moving averages, it should be treated as a one-sided bullish trend, using this level as short-term support.
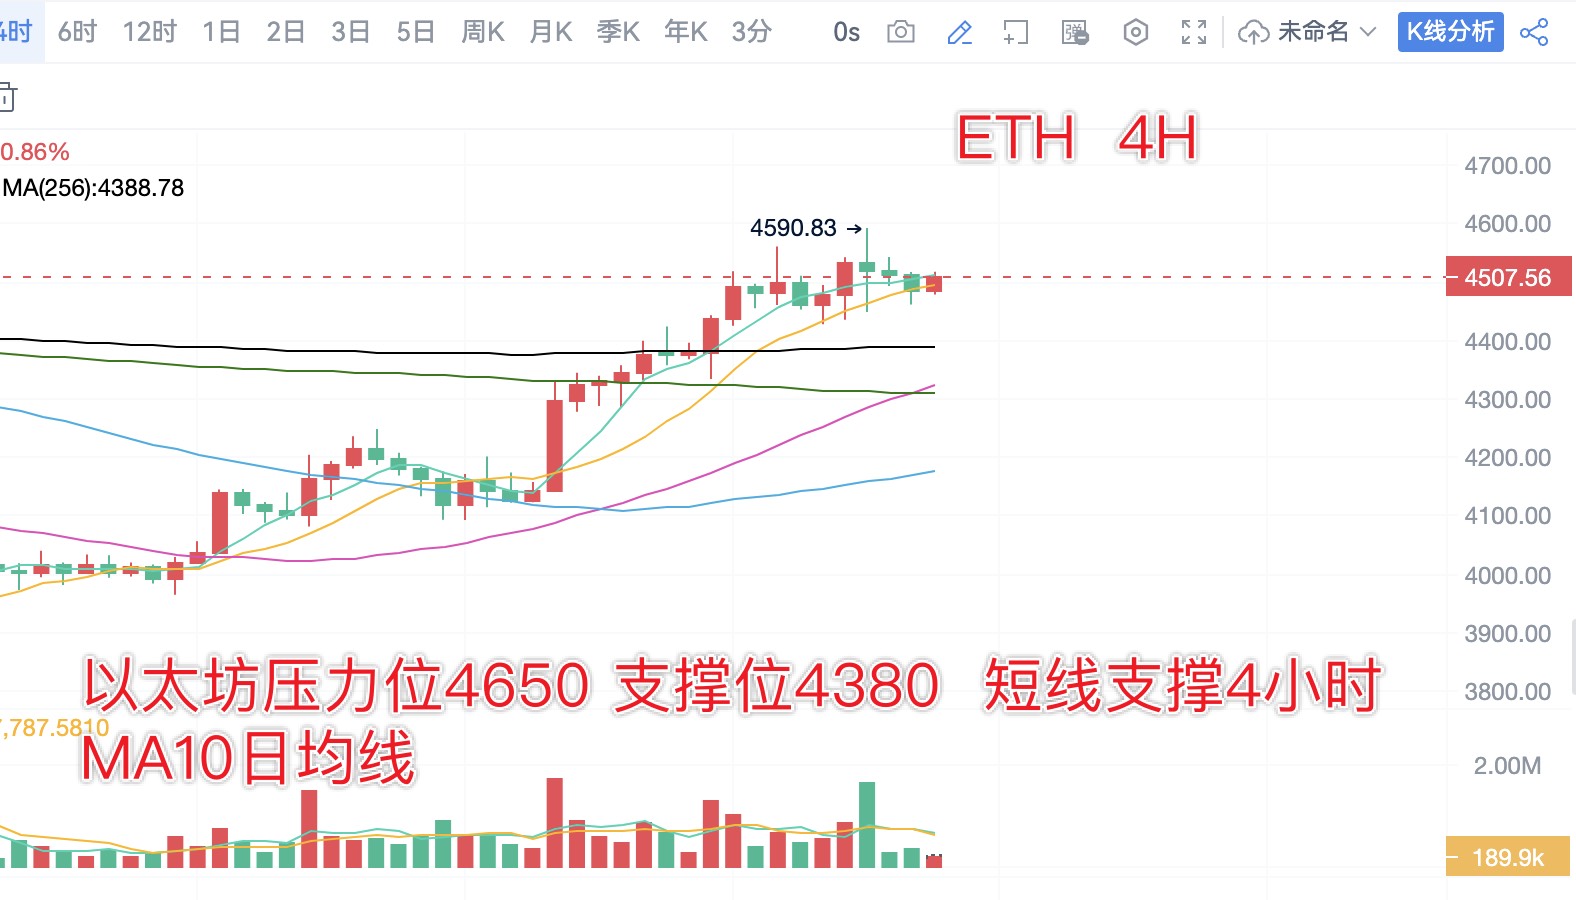
From the daily chart of Ethereum, it also shows consecutive bullish candles, with the price stabilizing above the MA60 daily moving average. The key short-term support is at the 4360 level, while the resistance remains at the 4650 level. If there is a pullback in the short term, pay attention to the MA256 daily moving average at the 4400 level on the 4-hour chart. As long as it does not break below the 4-hour MA10 daily moving average, it should still be treated with a slightly bullish trend.
Midday Operation Strategy (Written at: 15:00):
BTC: On Saturday, with little fluctuation, treat it as a range trading between 12.3-12.15, selling high and buying low.
ETH: Treat it as a range trading between 4550-4450.
The daily analysis strategy has a very high win rate! Analysis is not easy, and I hope everyone can give a free follow, bookmark, like, and comment. Thank you all, and feel free to leave comments below; I will reply to each one.

免责声明:本文章仅代表作者个人观点,不代表本平台的立场和观点。本文章仅供信息分享,不构成对任何人的任何投资建议。用户与作者之间的任何争议,与本平台无关。如网页中刊载的文章或图片涉及侵权,请提供相关的权利证明和身份证明发送邮件到support@aicoin.com,本平台相关工作人员将会进行核查。


