The crypto market is riding high as “Uptober” delivers on its historical promise. Bitcoin hovers near a new all-time high, Ethereum pushes toward $4,500, and altcoins are catching fire.
But one token stands out: BNB, formerly known as Binance Coin, is up 24% in the past month and flashing technical signals that suggest either a moonshot to $2,000 or a face-melting correction is imminent.
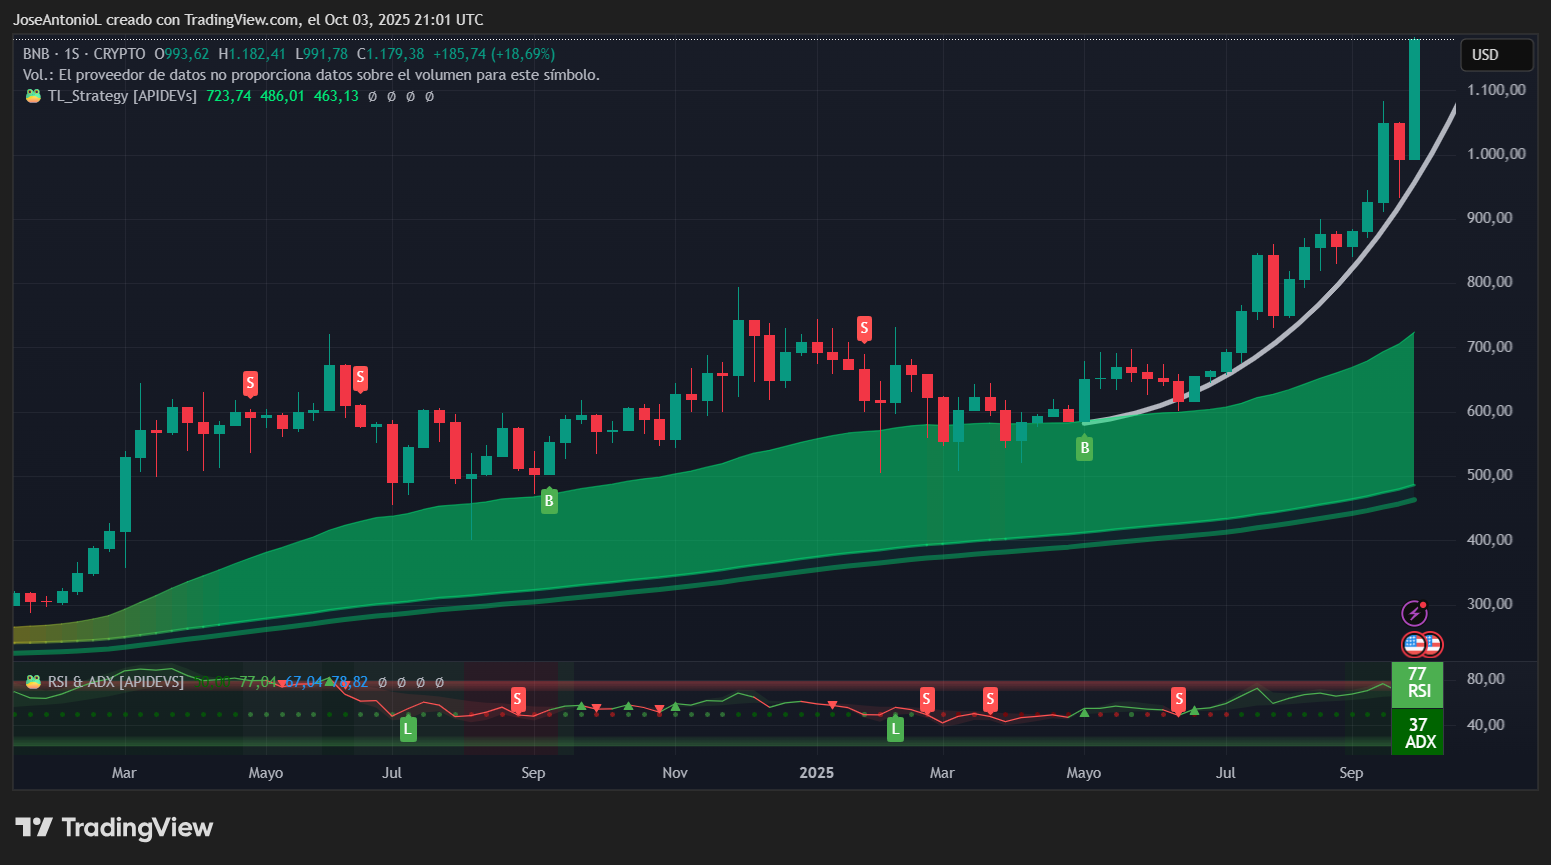
BNB opened today at $1,090.97 and closed at $1,157.05, marking a solid 6.06% daily gain after hitting a new all-time high. The intraday high of $1,168.39 shows bulls are in complete control, with the token breaking through resistance levels like they’re made of paper.
Adding fuel to the rally, Kazakhstan’s newly launched Alem Crypto Fund made BNB its first national reserve asset this week, providing institutional legitimacy at the nation-state level. Meanwhile, BNB Chain posted record Q3 growth with DEX volume surging 185% to $37.1 billion, driven by the Aster DEX generating over $29 million in daily fees.
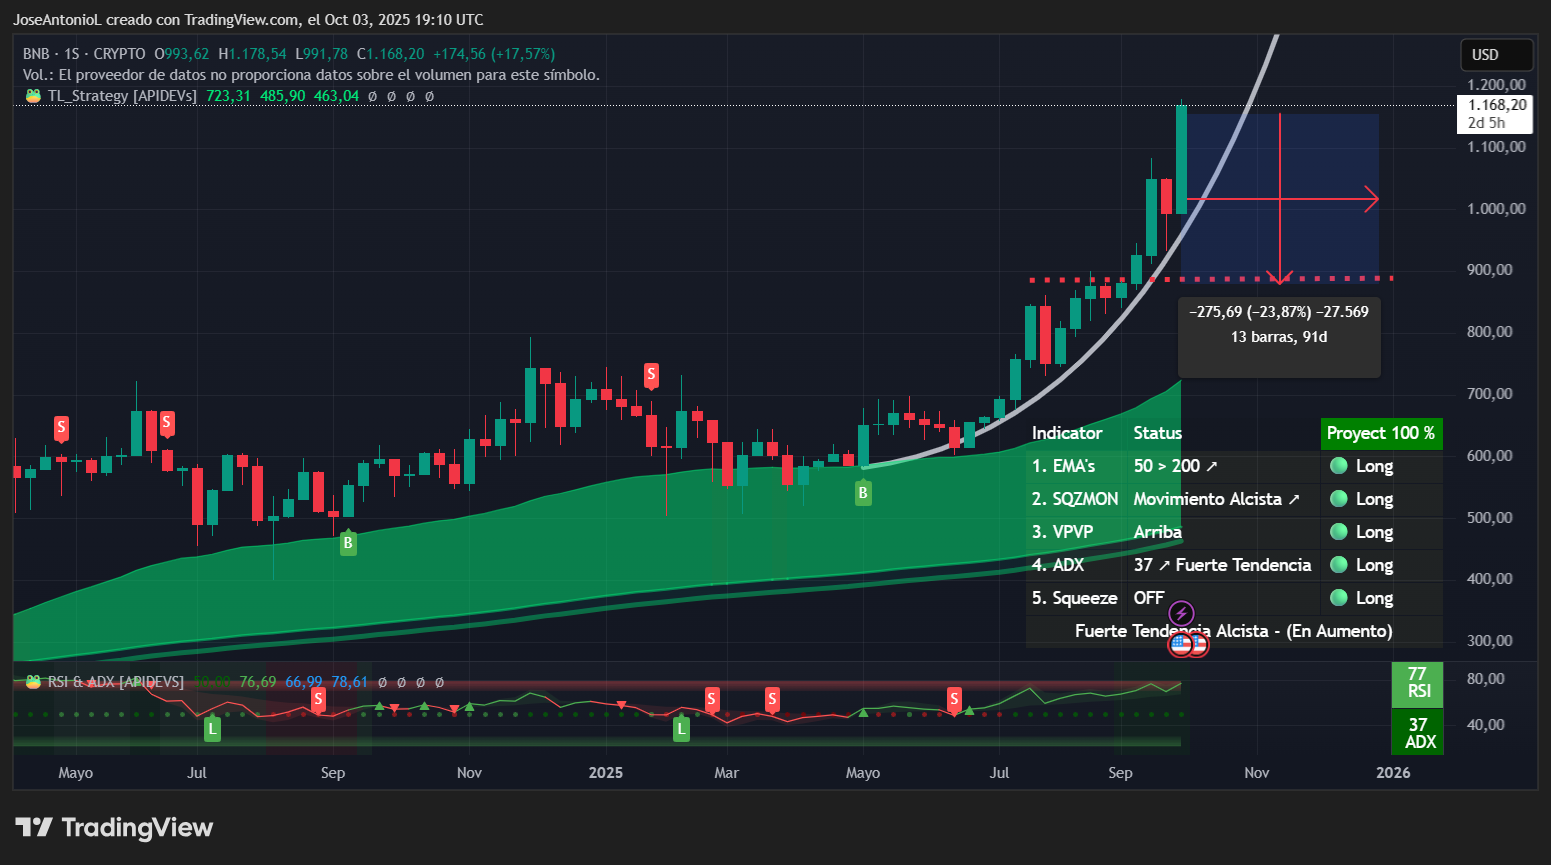
But here’s where things get interesting: BNB has been riding a powerful parabolic support line since mid-year. The chart shows a clear parabolic advance—the kind that can deliver explosive gains but also tends to end with equally explosive corrections. Looking at the projection, if this trajectory continues uninterrupted, BNB could be trading near $2,000 by December 31, potentially delivering another 67% gain from current levels over the next 89 days.
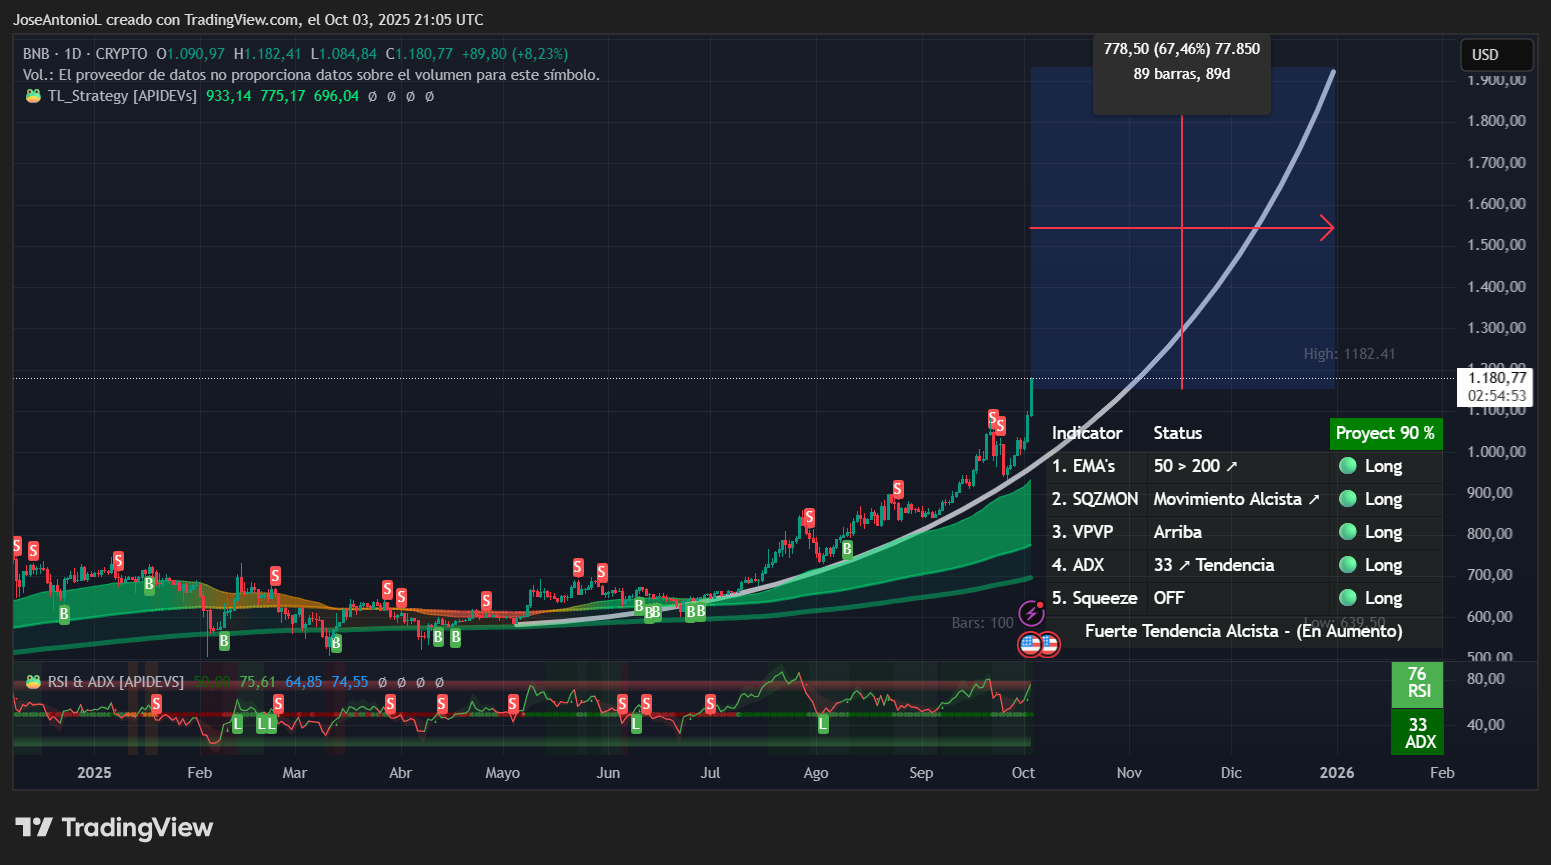
BNB price data. Image: Tradingview
That is, of course, if you trust that the planets will align and the trend will remain valid until new year’s eve.
The Average Directional Index, or ADX, sits at 33, well above the critical 25 threshold that confirms a strong trending market. Think of ADX as your “trend strength meter”—it doesn’t care about direction, just whether a real trend exists. Below 20, you’re in choppy waters where false breakouts are common. Above 25, you’ve got momentum. At 33, BNB is firmly in trending territory, meaning institutions and retail are moving in the same direction, creating sustained buying pressure that can carry prices significantly higher.
However—and this is crucial—ADX measures strength, not sustainability. A strong reading can persist right until the moment a trend exhausts and reverses, some random whale dumps the coin, or a FUD episode triggers a flash crash. It’s like a speedometer showing you’re going fast without telling you how much fuel remains.
The exponential moving averages, or EMAs, paint an even prettier picture. These weighted averages give more importance to recent price action, helping identify dynamic support and resistance. For BNB, the setup is textbook: the 50-day EMA rises beneath current price around $1,050-$1,070, providing a cushion for pullbacks. The 200-day EMA sits lower still, confirming the longer-term uptrend.
When shorter-term EMAs trade above longer-term ones like this, traders see it as a good sign. This configuration suggests money is positioned bullishly across multiple timeframes, from swing traders watching the 50-day to long-term holders focusing on the 200-day. Watch the candlesticks on weekly timeframes, and the gap between both averages is also bullish, and increasing over time.
BNB price data. Image: Tradingview
Now the semaphore’s yellow light:
The Relative Strength Index measures momentum on a 0-100 scale, with readings above 70 considered “overbought.” At 76, BNB is at the edge of that danger zone. One or two more strong days push it above 80, where algorithmic systems typically trigger sell orders and profit-taking historically accelerates.
This matters because markets don’t move in straight lines. BNB’s 6% daily gain and 21% weekly surge attract short-term traders looking for quick flips. Once momentum stalls—and it always stalls eventually—those traders rush for exits simultaneously, creating violent corrections that wipe out leveraged positions in minutes.
Also, the candlesticks have started to show signs of extreme FOMO. A parabolic chart is already hyperbullish, but a parabolic chart in which the bodies of the latest candlesticks are moving faster than the support, is probably too good to be true. Common sense says there must be a correction for markets to find some balance.
The Two scenarios: Moonshot vs. meltdown
The bullish case is straightforward: If BNB holds its parabolic support line through year-end, the chart projection suggests a path to around $2,000. That’s a 67% gain over 89 days—ambitious but not impossible given current momentum.
For this to play out, BNB needs:
- Continued BNB Chain growth and real-life applications that boost the economic value of the BNB token (like what Aster, the Hyperliquid competitor, and other protocols are doing);
- More institutional adoption to inject liquidity (like what Kazakhstan is doing);
- Bitcoin holding above $115,000 and ideally pushing toward a new all-time high (because altcoins always follow Bitcoin’s lead); and
- Zero major regulatory curveballs from Binance or broader crypto regulation.
The path higher would see BNB break above today’s $1,168 high, consolidate briefly around $1,200, then push toward $1,250-$1,300. That zone becomes the launching pad for $1,500 and ultimately $2,000. Volume would need to confirm each breakout—if BNB tries breaking $1,250 on light volume, it’s probably a false move.
Scenario 2: The correction reality check
Now for the cold shower. Parabolic advances are beautiful until they’re not. They require ever-increasing buying pressure to maintain trajectory, and when that pressure falters, gravity takes over with a vengeance.
At 77, BNB’s RSI is one strong week from breaching 80, where corrections typically trigger. The parabolic structure itself is inherently fragile—if BNB breaks below its rising support line even briefly, it could cascade into a 20-30% correction as stop-losses trigger and profit-takers flood exits.
In fact, even with such a sharp correction, the overall trend could still be considered long-term bullish, with prices still trading above the 50-day EMA.
Traders would consider this correction healthy, allowing the token to consolidate gains and work off overbought conditions, bringing RSI back to neutral 50-60 territory. If $1,050 holds, bulls maintain control and the uptrend stays intact for another leg higher.
In this scenario, BNB would trade sideways for weeks before attempting another leg higher. The conservative year-end target becomes $900-1000 rather than $2,000—still excellent 200% yearly returns.
Choose your risk tolerance
For the BNB bull, the path to $2,000 exists. Record BNB Chain usage, political endorsement, technical momentum, and favorable macro conditions from the U.S. government shutdown creating Fed rate cut expectations—all create a plausible moonshot scenario.
For the bear, here’s the but: The setup is more overbought than sustainable. The parabolic structure is fragile. RSI flirts with danger. And crypto markets are notorious for violent reversals.
What might traders do given these conditions? If holding from lower levels, traders may consider scaling take-profit triggers up according to the price movement (from $1,200, $1,250, and $1,300) while letting the rest ride with a trailing stop. Fresh capital? Traders may wait for a pullback before committing, being mindful of not chasing parabolic moves at all-time highs.
More advanced traders may be inclined to consider selling covered calls. Covered calls benefit from overbought, parabolic rallies—if the rally stalls, you keep the premium; if price indeed explodes, your gains are capped but protected from a sudden selloff.
And for the casual observer: Enjoy the ride. Parabolic rallies are beautiful until they’re not, and in crypto, the transition from “beautiful” to “brutal” can happen in hours.
Key levels to watch:
Resistance:
BNB is in price discovery, so targets are just based on speculation, not past data
- $1,250 (next technical target and key breakout level)
- $1,400 (gateway to $2,000 moonshot in the most bullish scenario)
Support:
- $1,000 (major psychological support and parabola support)
- $900 (consolidation zone between June and September)
The views and opinions expressed by the author are for informational purposes only and do not constitute financial, investment, or other advice.
免责声明:本文章仅代表作者个人观点,不代表本平台的立场和观点。本文章仅供信息分享,不构成对任何人的任何投资建议。用户与作者之间的任何争议,与本平台无关。如网页中刊载的文章或图片涉及侵权,请提供相关的权利证明和身份证明发送邮件到support@aicoin.com,本平台相关工作人员将会进行核查。


