XRP的1小时图表给人强烈的真人秀感觉:戏剧性的波动、突然的反弹,以及让观众不断回来的紧张感。一个微小的上升趋势将价格从$2.76推高至$2.90,然后急刹车,滑入$2.85–$2.87的整合模式。
目前它正处于$2.90的门槛下方——稍微下探至$2.83–$2.85,快速交易可能会找到一个甜蜜点。但如果XRP能再次跃升至$2.90以上,我们可能会迎来一个迅猛的看涨爆发。不过,如果错过这个点,我们可能会看到回到$2.80的谢幕。
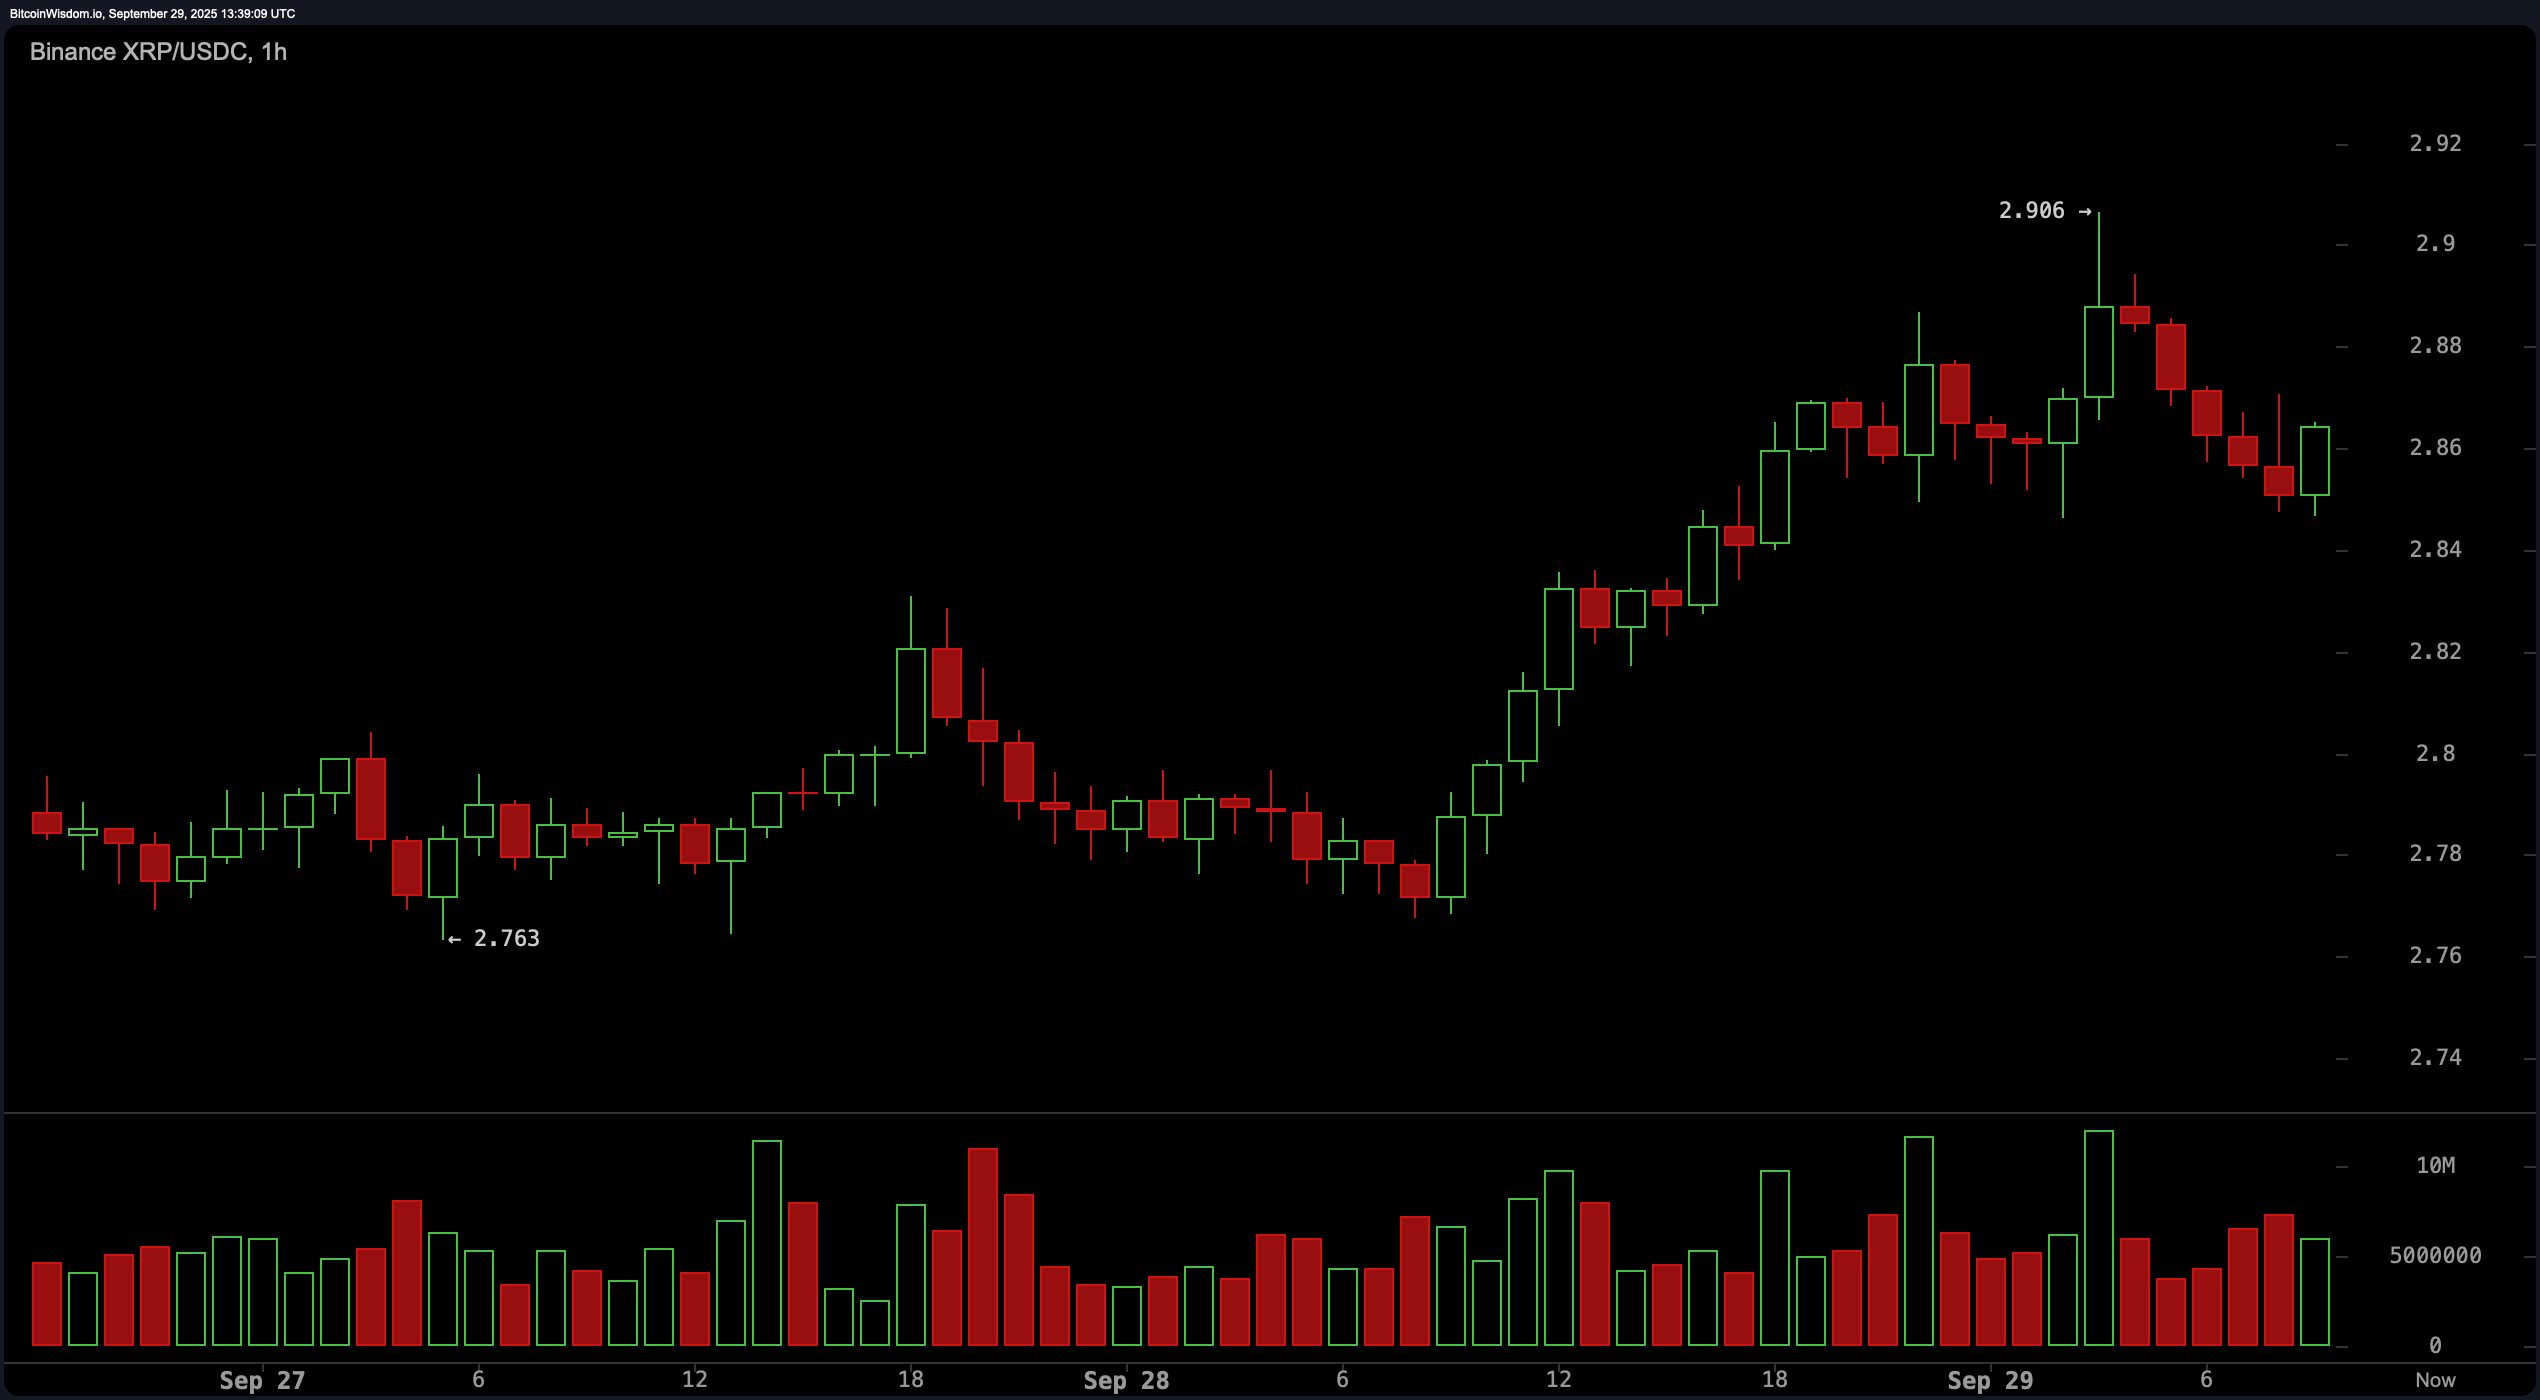
XRP/USDC通过Binance于2025年9月29日的1小时图表。
在4小时的舞台上,XRP扮演了经典的反弹角色。在跌至$2.69(哎呀)后,这个代币以资深加密女神的风采反弹,重新攀升至$2.90。交易量甚至带来了伴舞,随着反弹而激增。但在任何人准备洒彩纸之前,近期蜡烛的动能减弱给了我们一点阴影。短期支撑位在$2.75–$2.80附近,而阻力位则在$2.95–$3.00附近窃窃私语。尽管短期前景仍然带有一丝乐观,但真正的戏剧性在于那个上方价格区间附近。
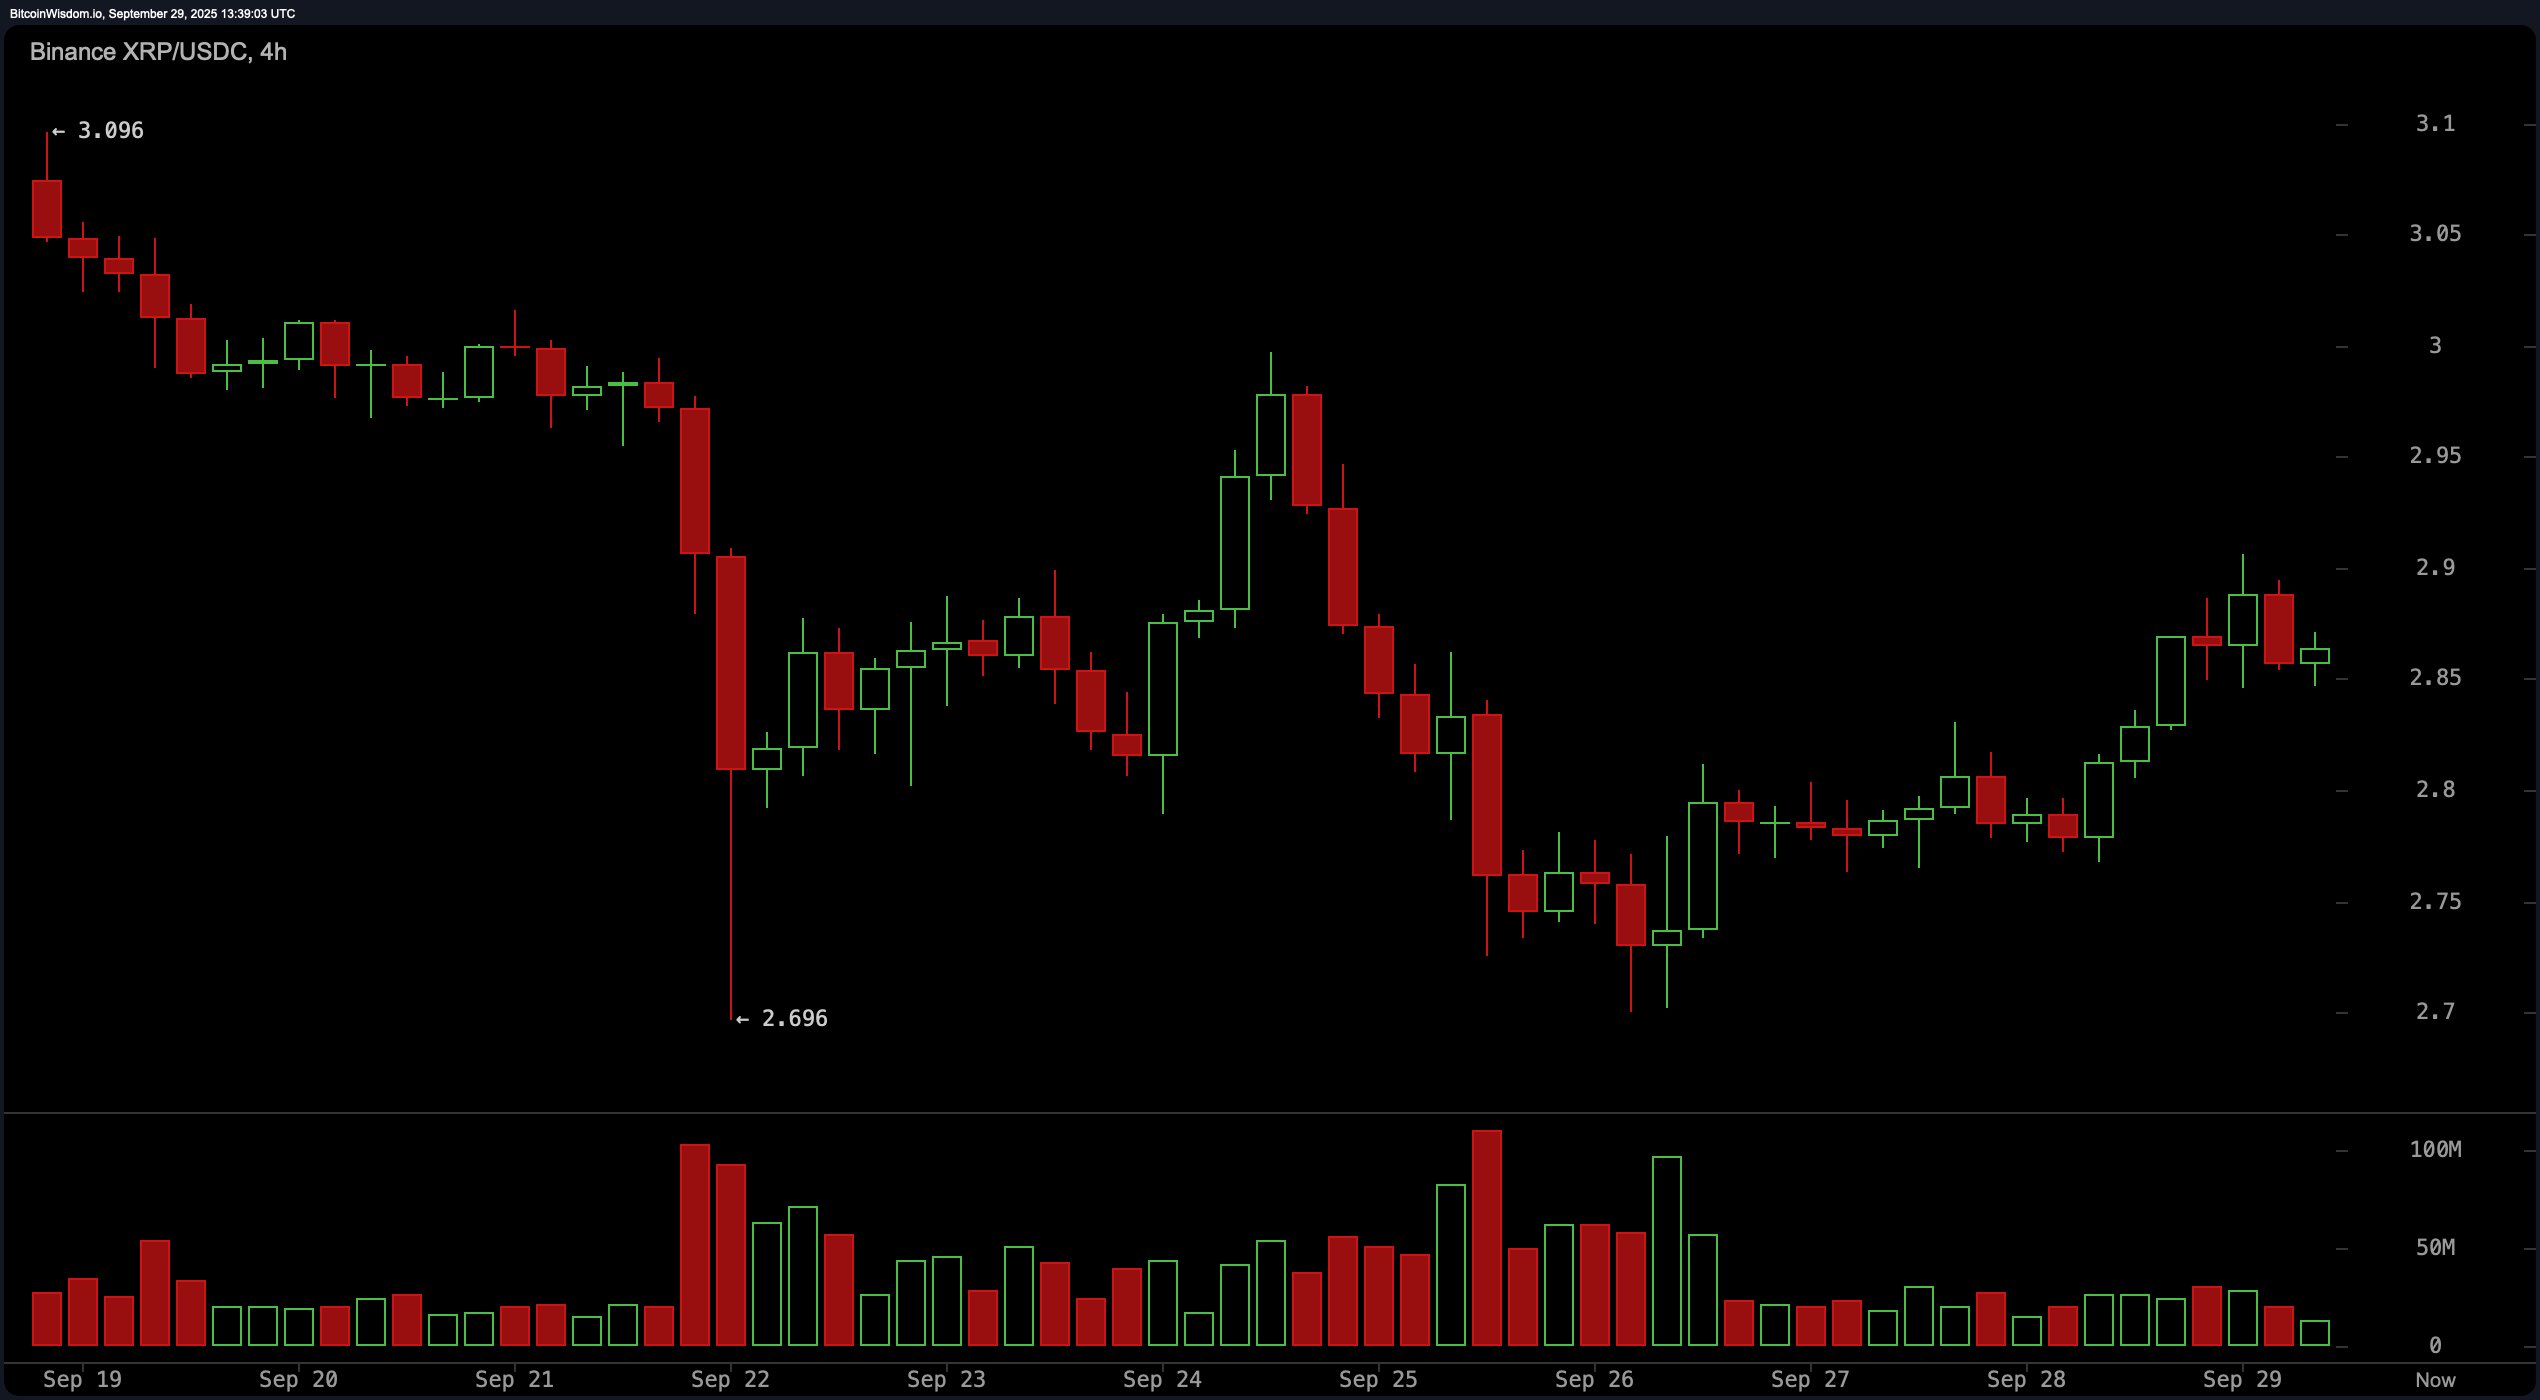
XRP/USDC通过Binance于2025年9月29日的4小时图表。
放大到日线图,XRP在更宽的跑道上摇摆,徘徊在$2.70的支撑位和$3.38的阻力位之间。近期的价格走势暗示了一个看涨的进入——从大约$2.70反弹——但在$3.10以下熄灭了,就像早午餐时的气泡饮料一样。不过,该代币拒绝跌破$2.80为其增添了一点看涨的光彩。就目前而言,偏向保持中立,略带向上的气息——只要XRP不洒出鸡尾酒并跌破$2.70。
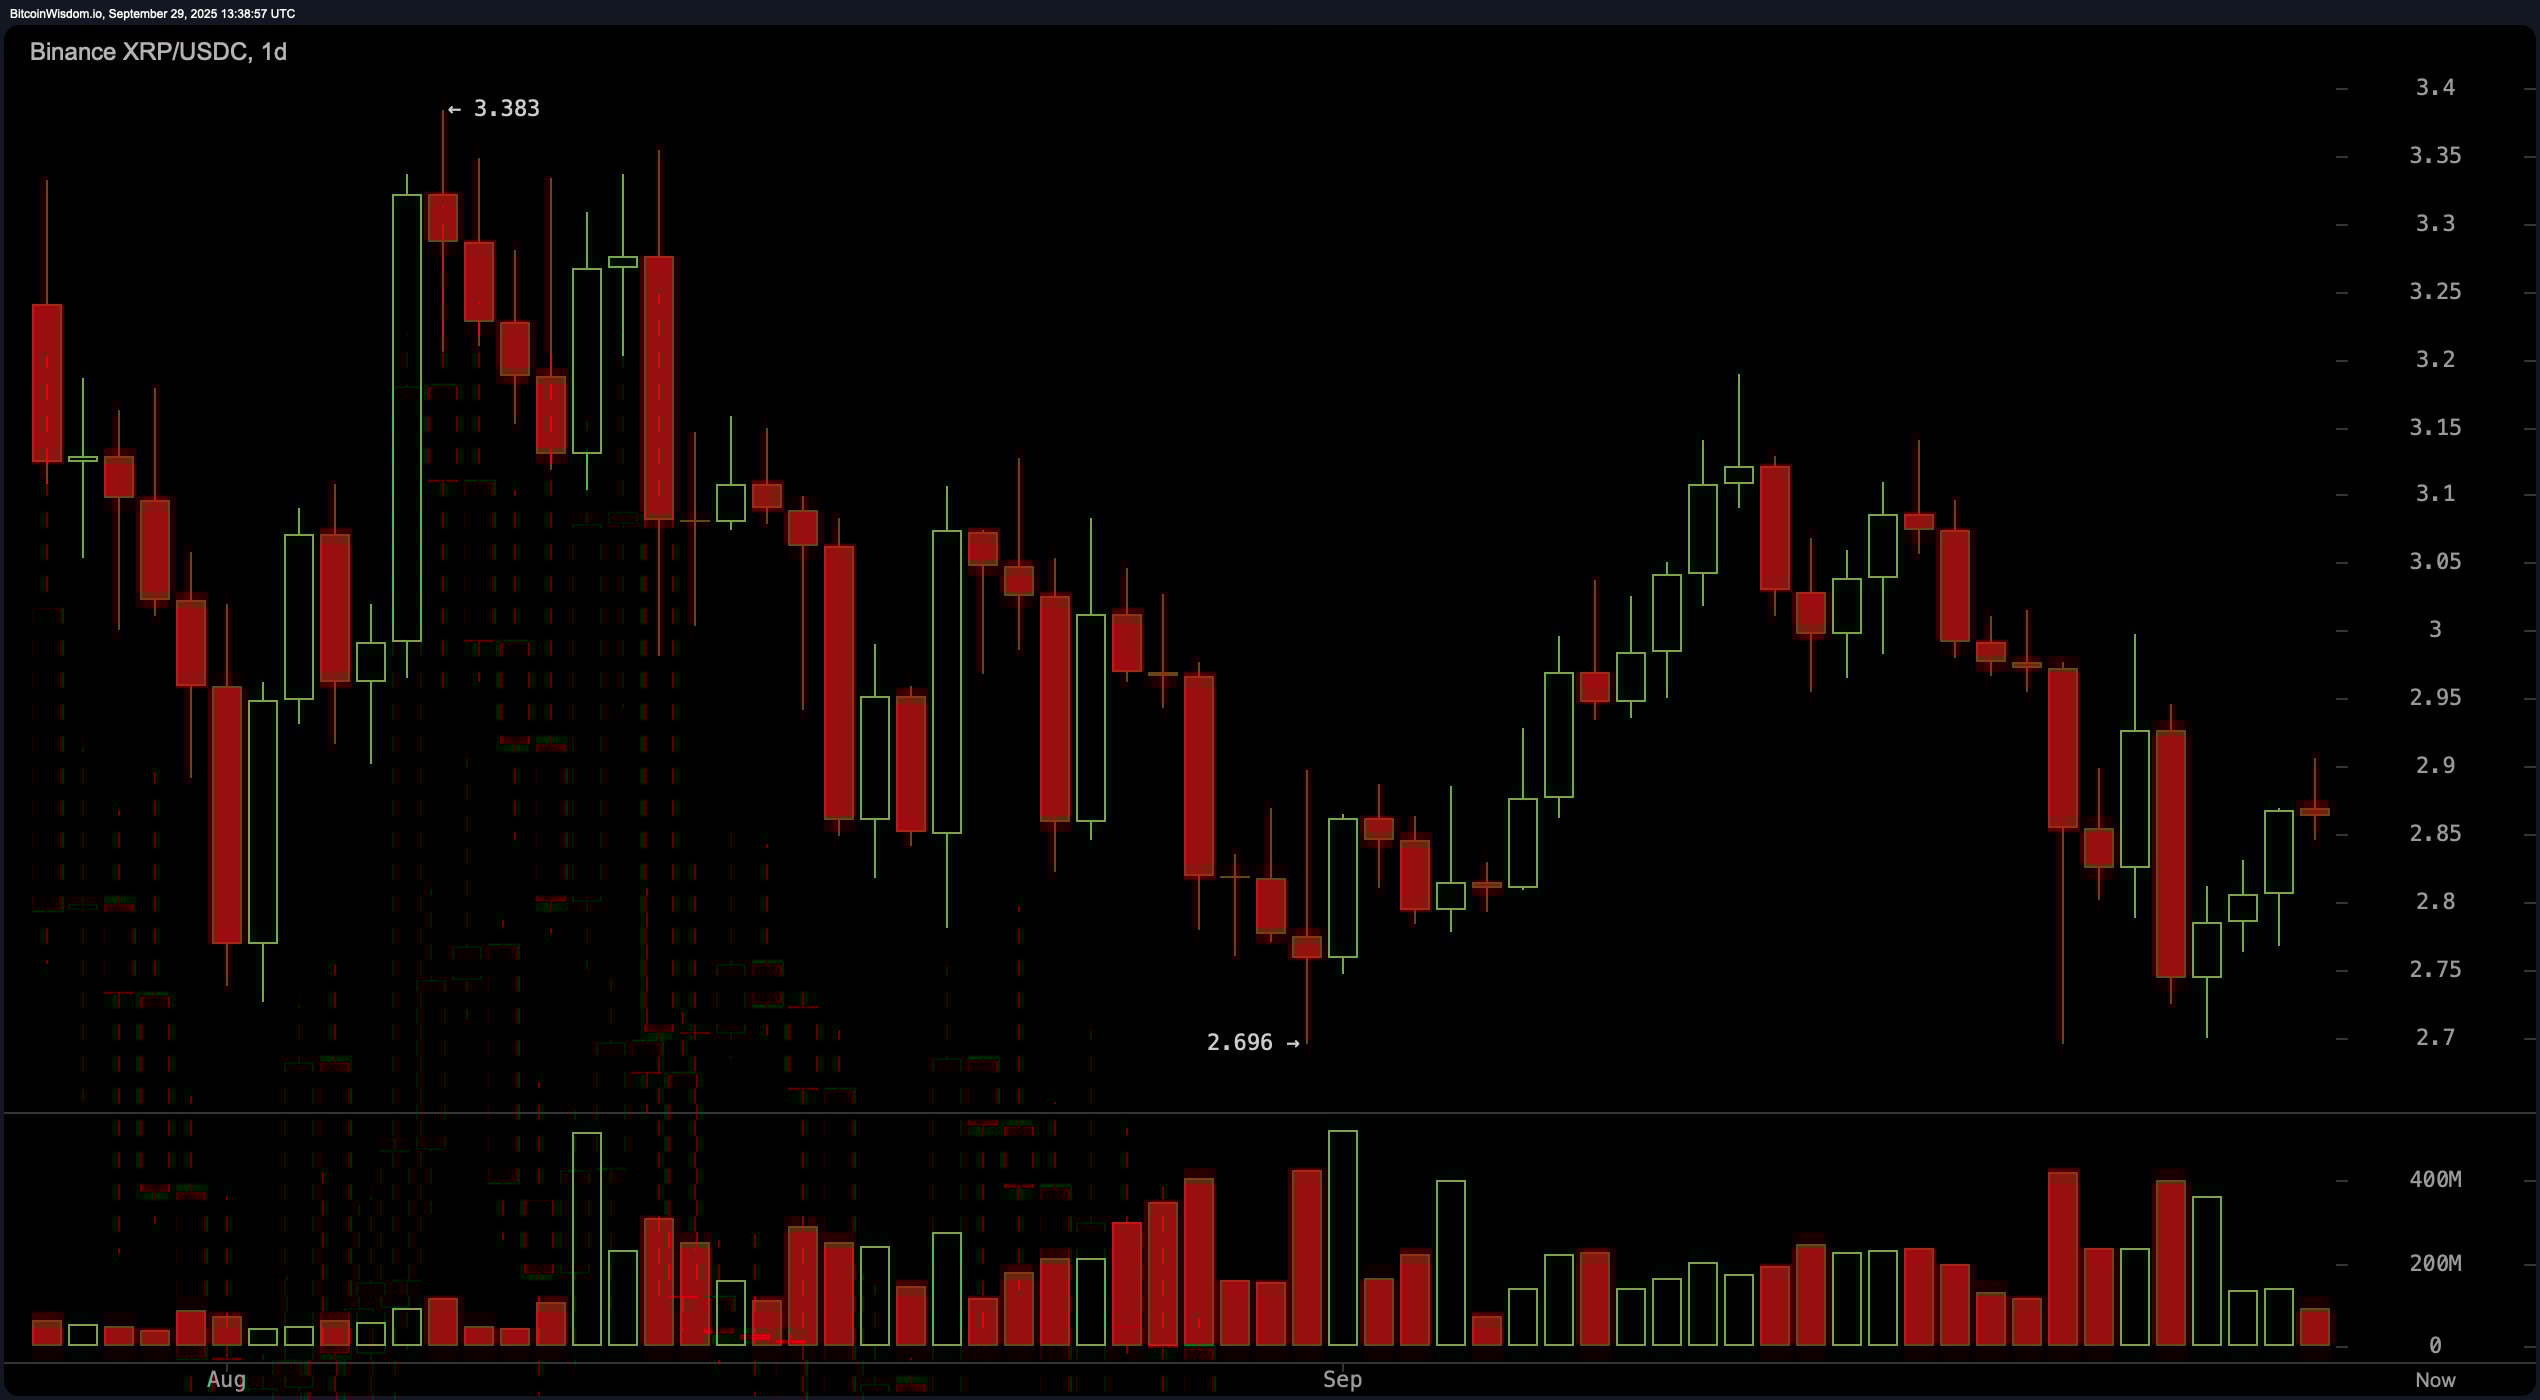
XRP/USDC通过Binance于2025年9月29日的1日图表。
现在让我们谈谈振荡器——交易世界的时尚评论家。相对强弱指数(RSI)、随机振荡器、商品通道指数(CCI)、平均方向指数(ADX)和惊人振荡器(AO)都坐在中立的长椅上,显然对哪个方向欢呼犹豫不决。动能振荡器对其他指标投下阴影,略微看涨。但MACD(移动平均收敛发散指标)则偏向看跌,暗示仍然存在怀疑的暗流。简而言之,这个面板给我们带来了混合的信号——可以把它看作是加密跑道秀上的情绪化评审团。
移动平均线(MAs)则更加戏剧化。短期移动平均线坚定地站在看跌阵营:10、20和30周期的指数移动平均线(EMA)以及它们的简单移动平均线(SMA)都在发出疲软的信号。但深入时间线,情况变得更加华丽。100周期的EMA和200周期的EMA都偏向看涨,200周期的SMA也加入了这个阵营——提供长期支撑。但不要太过安逸——大多数短期平均线仍在XRP的背后低声警告。
看涨判决:
如果XRP能在$2.80的底部保持其风采,并有信心地重新夺回$2.90,牛市可能会迎来它的跑道时刻。今天的日内高点显示这是可能的。再加上长期移动平均线闪烁着支撑信号和坚韧的日内结构,XRP可能正准备走向$3.10及更高——只要不在那条阻力地毯上绊倒。
看跌判决:
如果XRP跌破$2.80并徘徊在$2.70附近,熊市将准备好彩纸和警戒带。随着短期移动平均线转身背对,动能指标犹豫不决,跌破关键支撑可能会解开看涨的织物,削弱XRP对$2的把握。
免责声明:本文章仅代表作者个人观点,不代表本平台的立场和观点。本文章仅供信息分享,不构成对任何人的任何投资建议。用户与作者之间的任何争议,与本平台无关。如网页中刊载的文章或图片涉及侵权,请提供相关的权利证明和身份证明发送邮件到support@aicoin.com,本平台相关工作人员将会进行核查。


