Bitcoin Price Watch: Bulls Bite Back as BTC Holds $112K Range

CN
2 hours ago

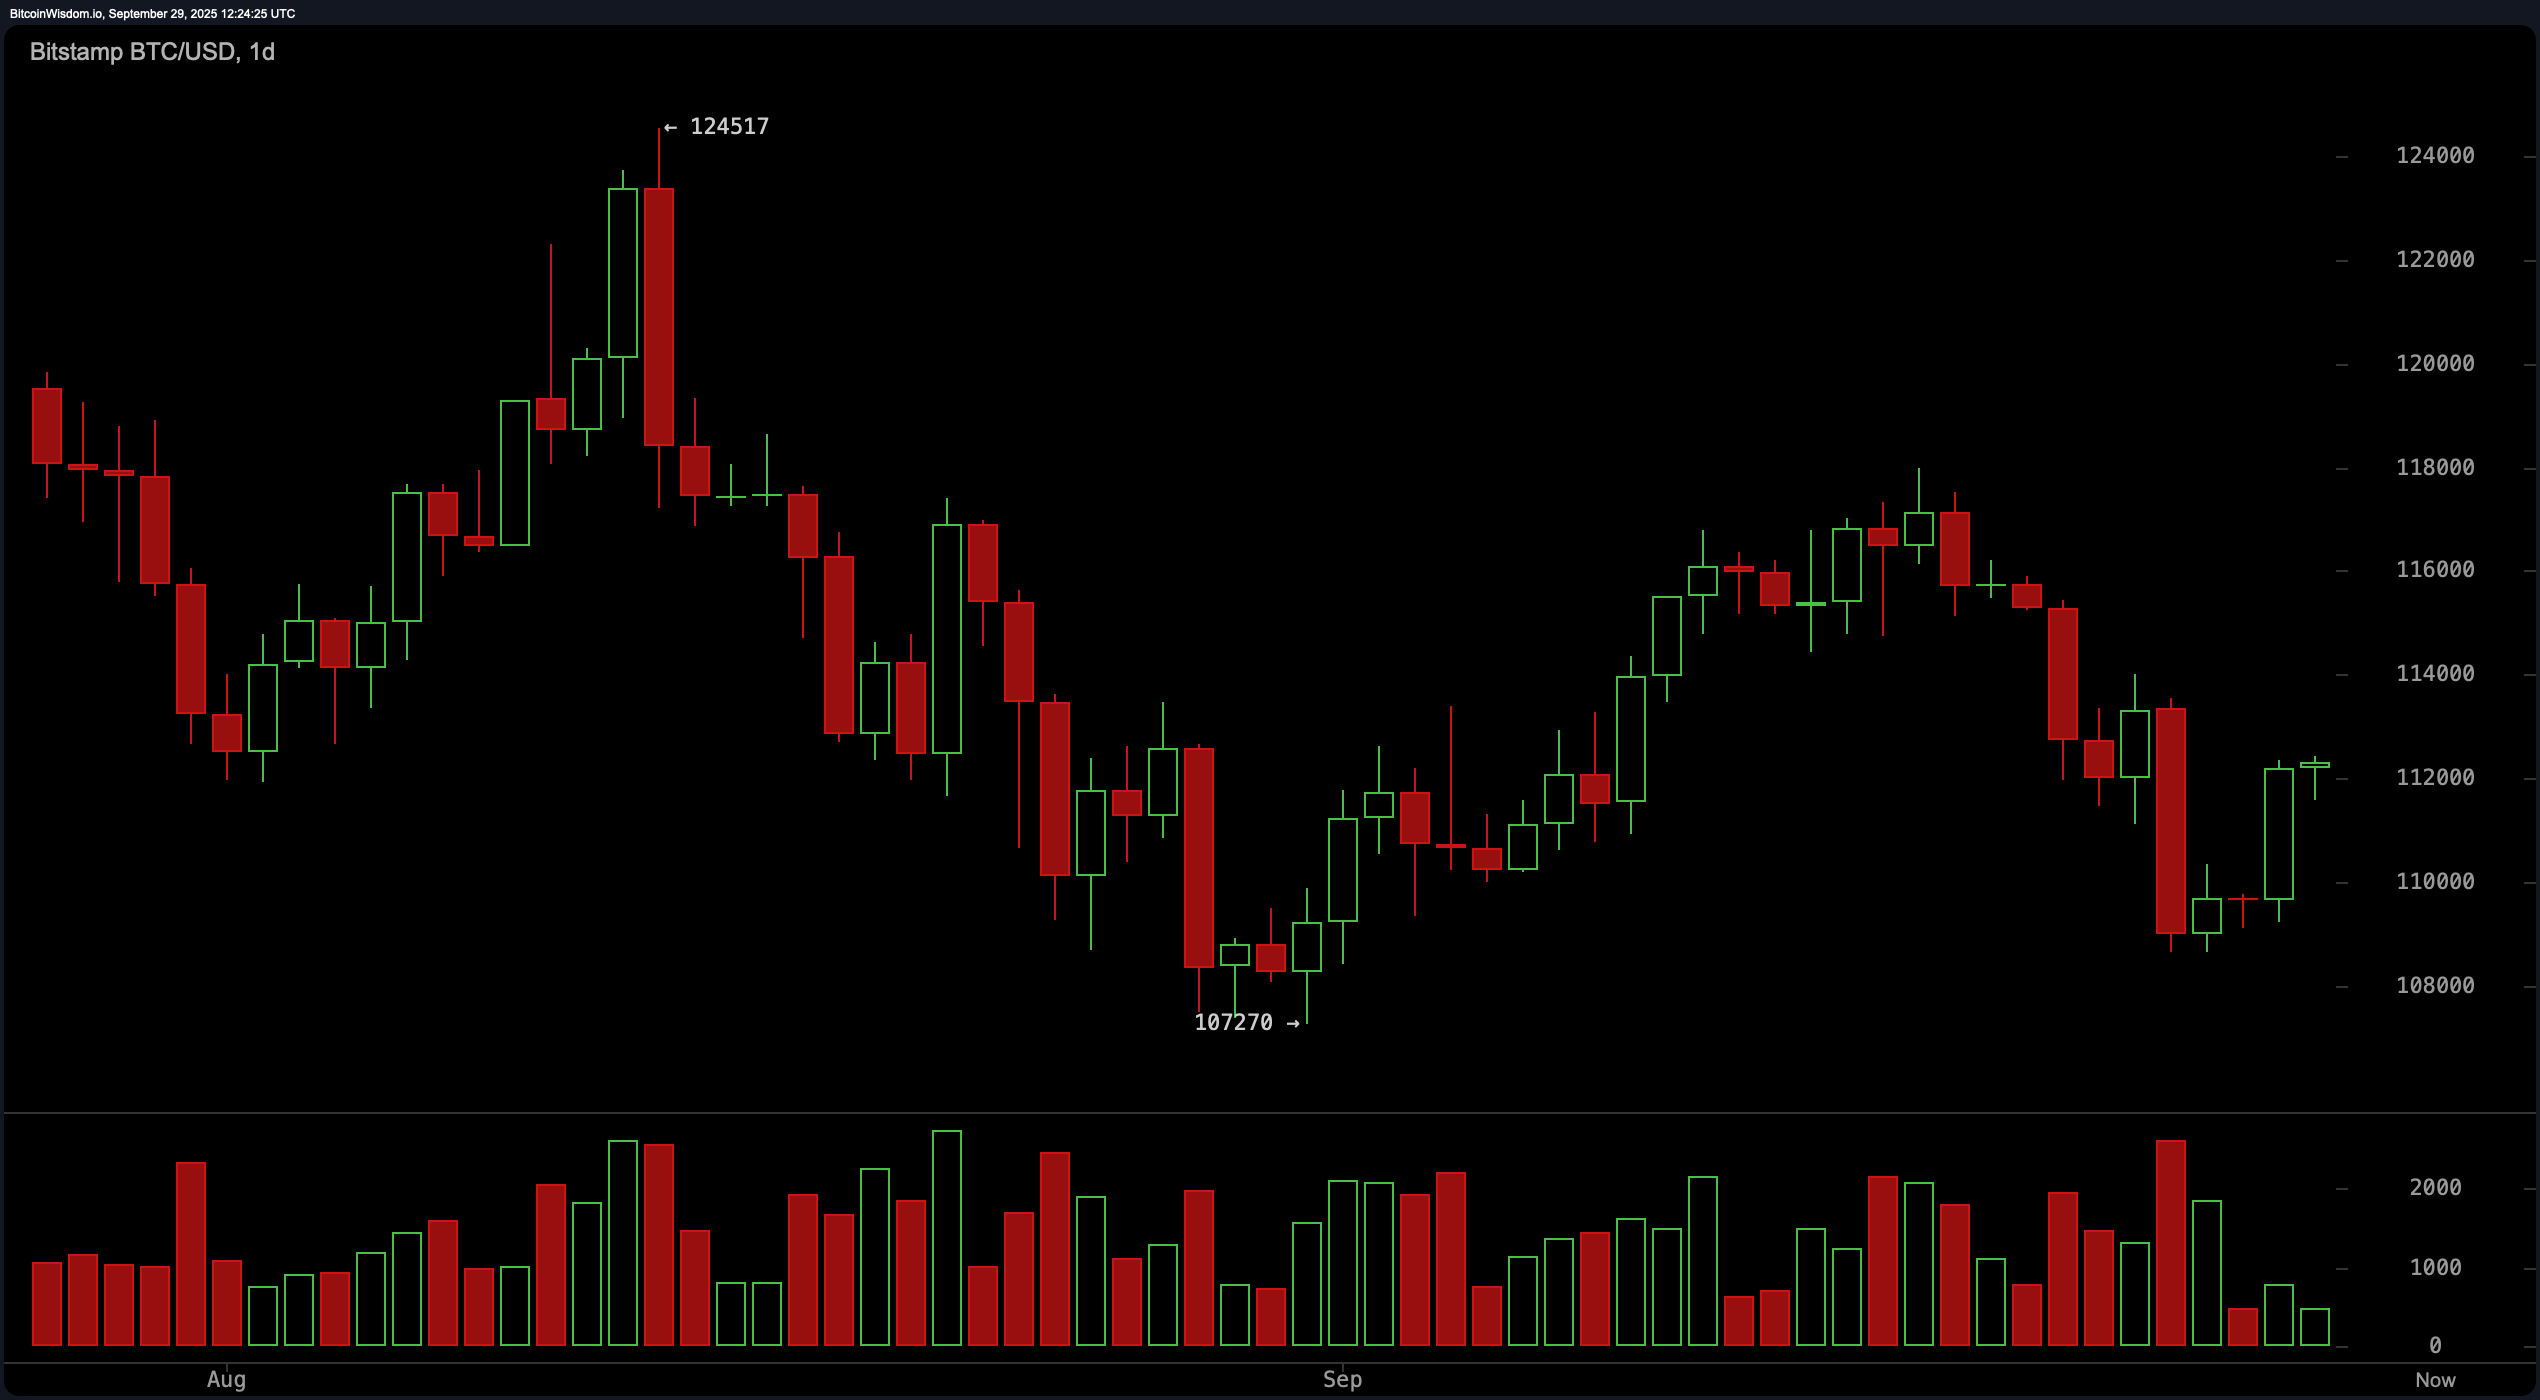
Looking at the daily chart, bitcoin seems to have thrown a textbook tantrum in early September, sliding down into the $107,000 zone. But then—cue dramatic music—it double-bottomed like a seasoned pro and came charging back with conviction. Green candles printed with muscle and volume suggest a fresh surge in bullish sentiment.

The potential long entry around $110,000 to $111,000 now seems well-validated, with resistance looming at $117,000 to $118,000. The breakout from consolidation has been supported by strong volume, which gives this rally a real shot at sticking the landing—assuming buyers don’t ghost the scene.

Bitcoin Price Watch: Bulls Bite Back as BTC Holds $112K Range

BTC/USD via Bitstamp on Sept. 29, 2025, daily chart.

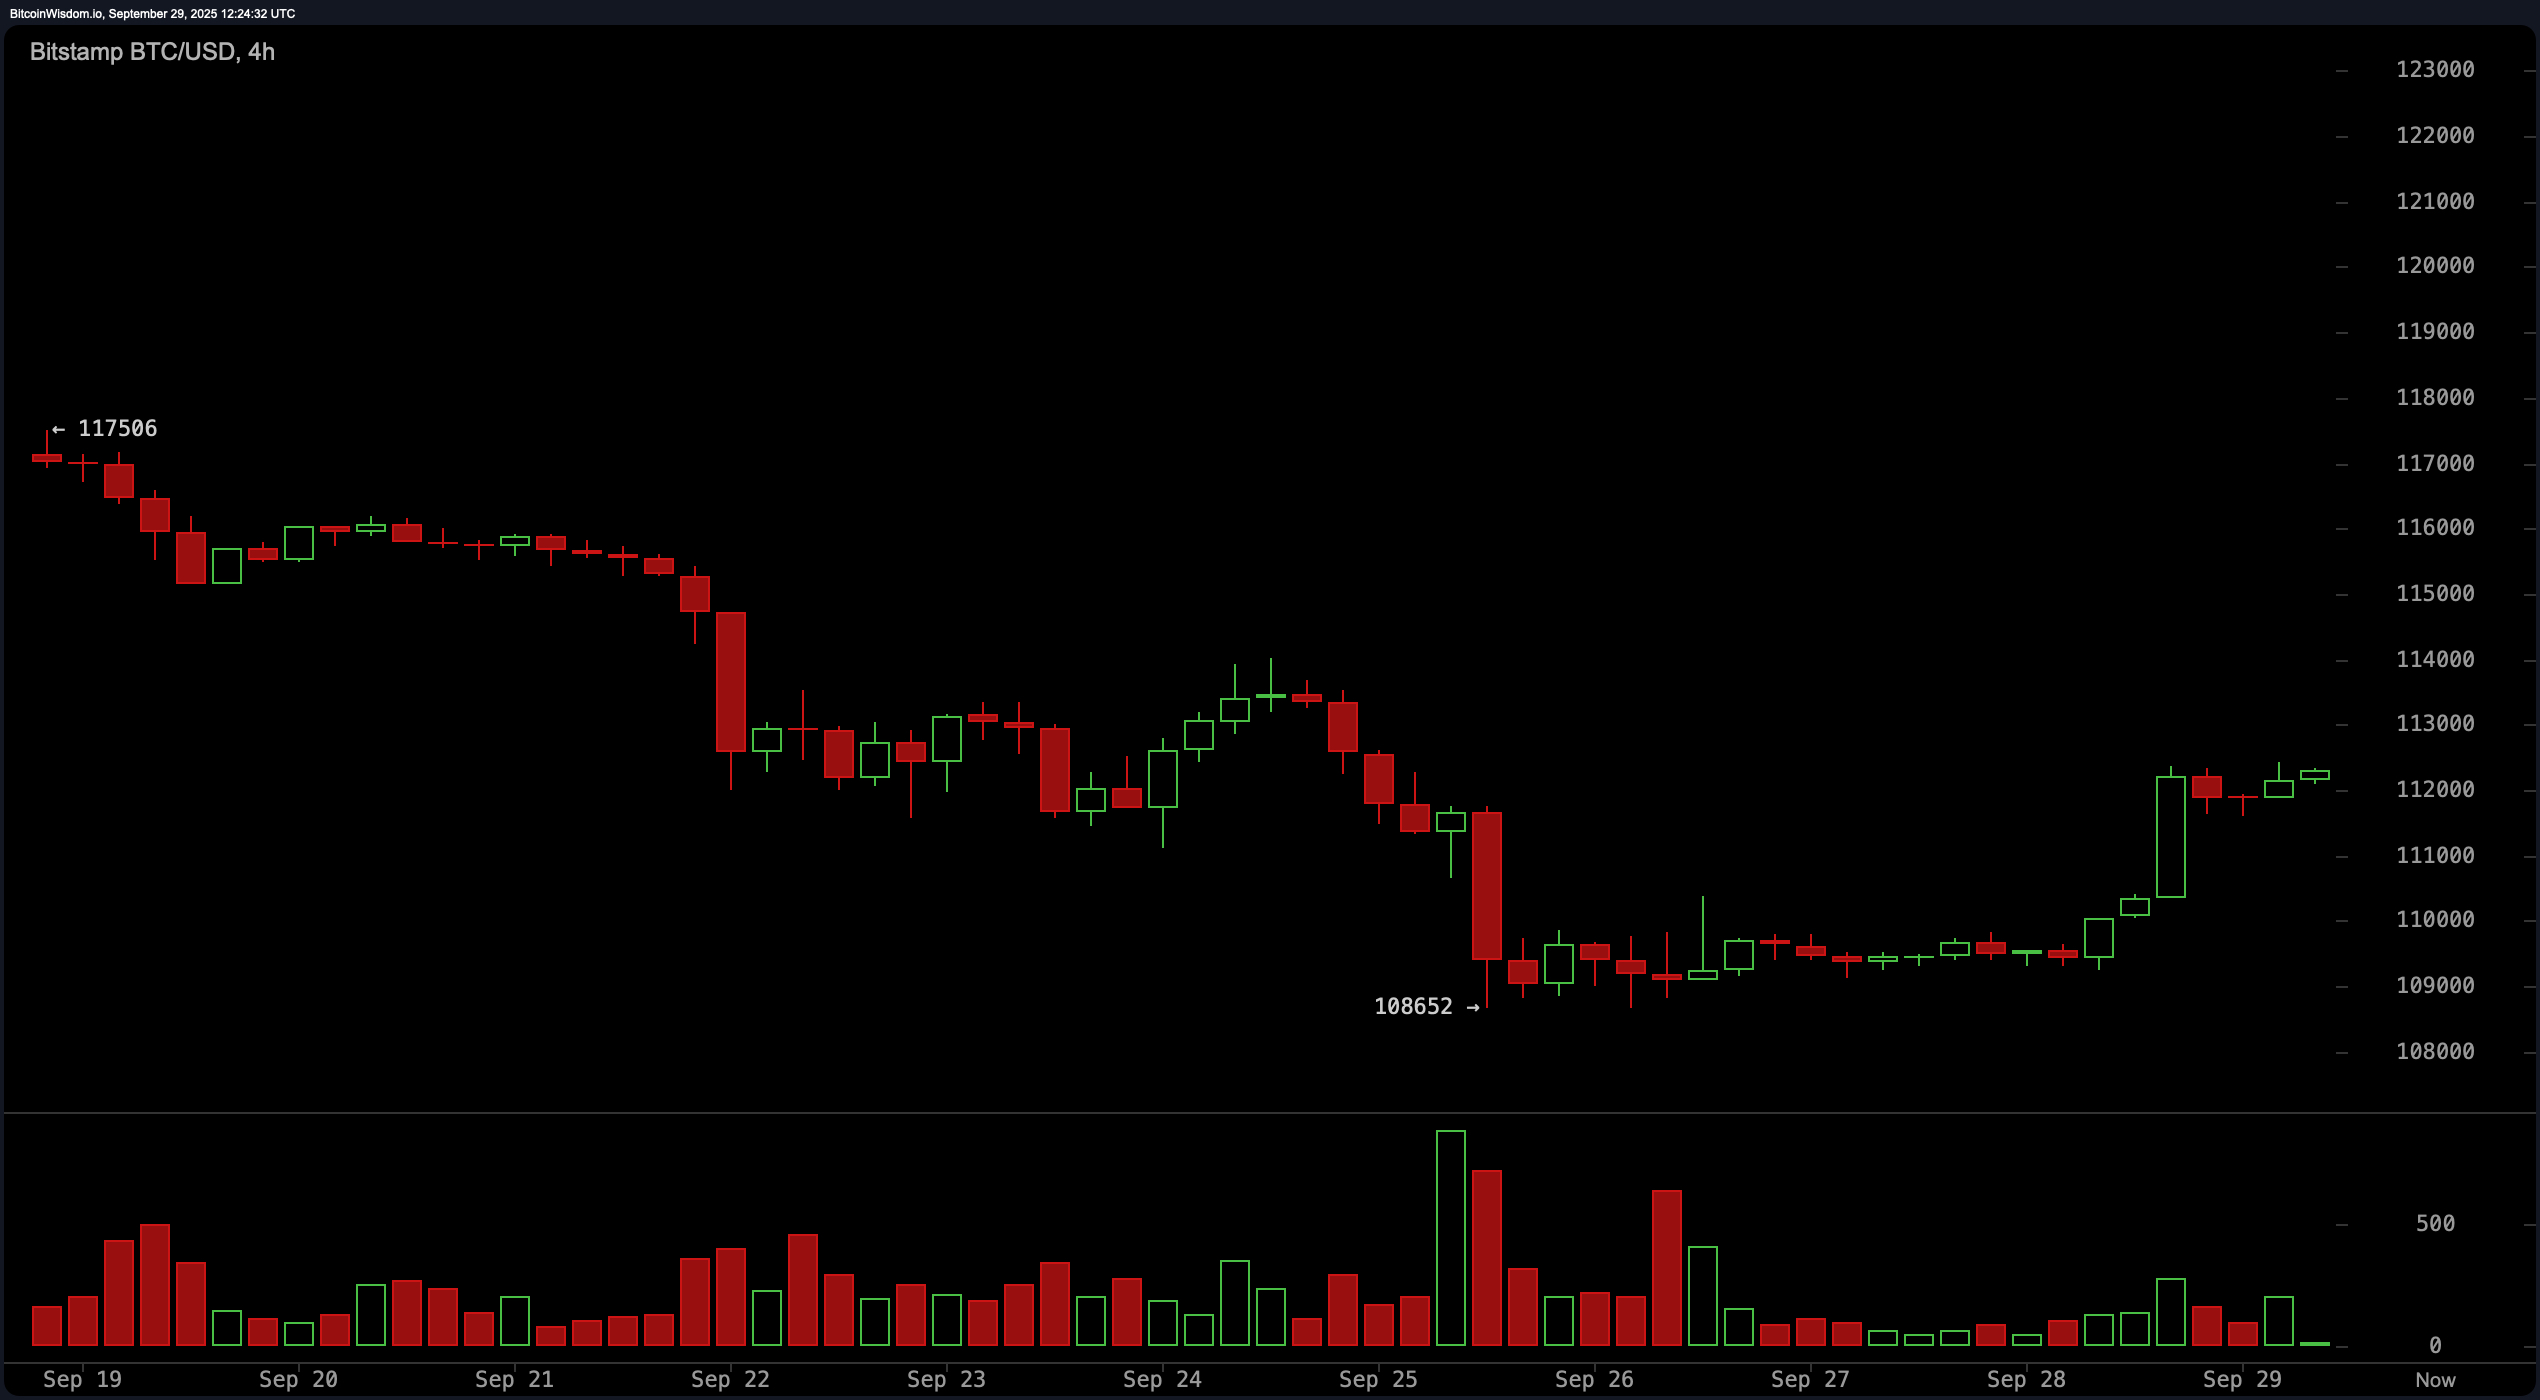
The 4-hour bitcoin chart tells a story of resilience. Following a brutal sell-off that plunged bitcoin to $108,652, the asset bounced back with vengeance, reclaiming $112,000 in short order. What we’re seeing here is a classic V-shaped recovery on steroids, with higher lows stacking like pancakes. Entry around $109,000 to $110,500 was prime territory, with resistance ahead at $113,500 to $114,000. If price gets smacked down there, expect some consolidation—though as long as we hold above $108,500, the bulls remain firmly in the driver’s seat.

Bitcoin Price Watch: Bulls Bite Back as BTC Holds $112K Range

BTC/USD via Bitstamp on Sept. 29, 2025, 4-hour chart.

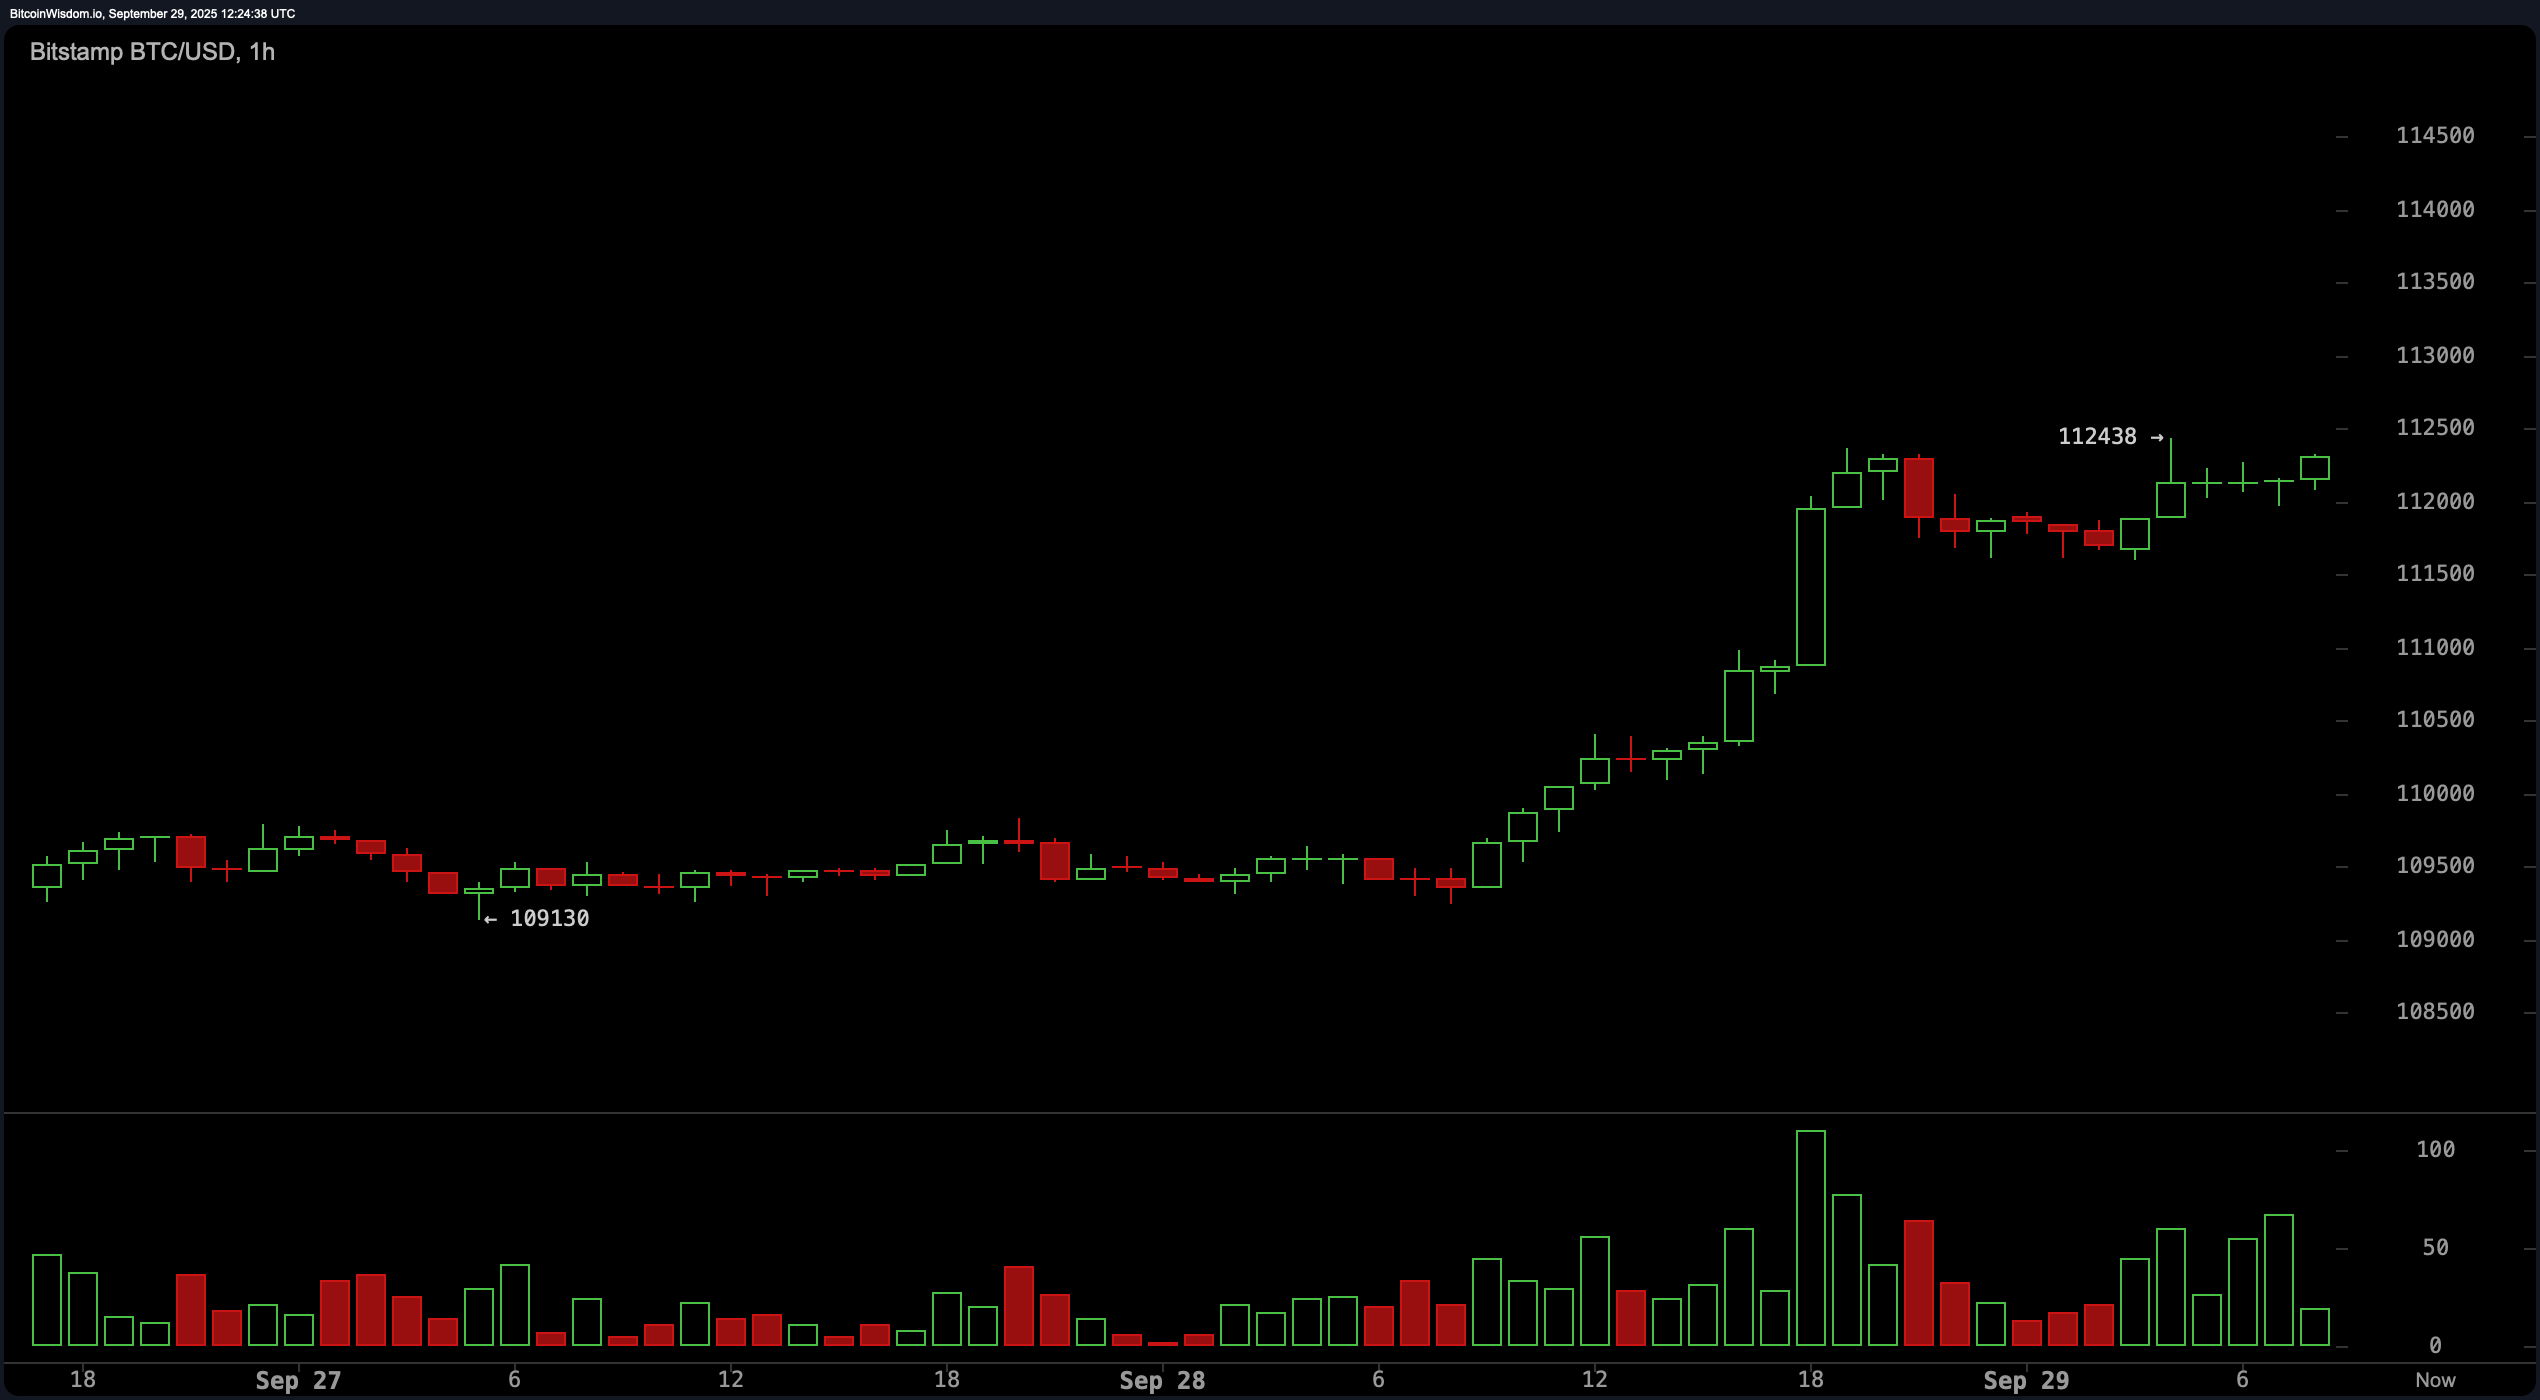
Zooming in on the 1-hour bitcoin chart, the microstructure shows a tidy consolidation zone between $109,100 and $112,500—nothing too chaotic, just good old-fashioned accumulation. The breakout candle that fired off around 18:00 UTC on September 28 was the short-term signal bulls were waiting for. It cleared $110,500–$111,000 with conviction and hasn’t looked back. As long as bitcoin maintains its posture above $112,000, the next logical short-term take-profit range sits in the $112,500–$113,000 window. Keep an eye out for bearish divergence in the relative strength index (RSI), though—it’s been known to betray latecomers.

Bitcoin Price Watch: Bulls Bite Back as BTC Holds $112K Range

BTC/USD via Bitstamp on Sept. 29, 2025, 1-hour chart.

Now, let’s talk indicators. Oscillators were the definition of diplomatic today—neutral across the board. The relative strength index (RSI) clocked in at 48, while the Stochastic sat at 30 and the commodity channel index (CCI) drifted at −58—all neutral reads. Even the average directional index (ADX), usually the drama queen of trend strength, came in at a sleepy 17. The Awesome oscillator (AO) dipped to −1,986 (also neutral), but momentum stood out with a cheeky bullish signal at −3,390. The moving average convergence divergence (MACD) wasn’t in the mood to join the rally, flashing a bearish signal at −658. So while oscillators played it safe, momentum whispers, “Buy the dip,” and MACD muttered, “Not yet, fam.”

The moving averages (MAs) were the financial equivalent of a family Thanksgiving: some in favor, some not. The 10-period exponential moving average (EMA) and simple moving average (SMA) both waved bullish flags at $112,153 and $112,209, respectively. But the 20, 30, and 50-period MAs—both EMA and SMA—were all flashing red. That’s four bearish signals in a row, for those counting. The 100-period EMA offered some hope with a bullish signal at $111,792, and the long-term 200-period MAs are solidly positive: EMA at $106,343 and SMA at $104,609. Translation? The long-term trend still favors the bulls, but the short-to-medium-term crowd is split.

In sum, bitcoin has regained its footing across multiple time frames with strong volume support and technically bullish setups. Traders looking for entries should keep their eyes peeled for pullbacks to the $110,000–$111,000 zone. If $108,500 holds firm, the current breakout rally has room to run. But don’t ignore mixed signals from key oscillators and MAs—the path forward won’t be without its plot twists.

Bull Verdict:

The bulls are back in the saddle and showing no signs of letting go. With breakout confirmations across all timeframes, strong support holding at $108,500, and high-volume rallies off recent lows, the setup leans favorably bullish. Momentum is quietly building behind the scenes, and the 200-period moving averages are fully aligned with the longer-term trend. As long as bitcoin doesn’t trip below $110,000 on low volume, this party has room to run straight into the $117,000–$118,000 zone.

Bear Verdict:

Not so fast, cowboy. While the recent bounce looks convincing, several key moving averages remain stacked against the bulls, and the MACD’s sell signal isn’t something to dismiss lightly. Oscillators are neutral at best—hardly a rousing endorsement. If bitcoin fails to break above $113,500 and starts rolling over with declining volume, we could be looking at a bull trap in progress. A slip below $108,500 would invalidate the entire short-term rally and reopen the gates to the sub-$107,000 lows.

免责声明:本文章仅代表作者个人观点,不代表本平台的立场和观点。本文章仅供信息分享,不构成对任何人的任何投资建议。用户与作者之间的任何争议,与本平台无关。如网页中刊载的文章或图片涉及侵权,请提供相关的权利证明和身份证明发送邮件到support@aicoin.com,本平台相关工作人员将会进行核查。

Share To
APP

X

Telegram

Facebook

Reddit

CopyLink