Stop Just Looking at Candlesticks! Understand These "Gaps" on Charts to Discover High-Probability Trading Opportunities Early
Brothers battling in the crypto world, do you often feel exhausted?
The market is always unpredictable. Just when you’ve diligently studied various indicators and are ready to enter with full confidence, the market has already surged ahead, leaving you confused in the wind. Do you often feel like those "market big shots" seem to have a sixth sense?
Don’t panic; they might just have mastered a "map cheat" that you don’t know about—Fair Value Gaps (FVG). This tool, commonly seen in professional circles, allows you to see through the "trading vacuum areas" on charts at a glance, easily understand the intentions of capital, and say goodbye to the fate of being a "retail trader"!
### 1. What is FVG? A Super Simple Analogy
Imagine the market as a crowded supermarket where buyers and sellers of a popular product (like BTC) are fiercely bidding.
Normal Situation: The price rises from $10 to $11 after some haggling.
Situation with FVG: Suddenly, a huge buy order appears, skipping all intermediate prices like $10.5 and $10.6, clearing all sell orders at $11.
Thus, on the chart, the price "jumps" from $10 to $11. The blank area between $10 and $11 is the Fair Value Gap.
Core Concept: FVG means that almost no trading has occurred in this price range. The market considers this area "unfair" and chooses to skip over it quickly. Therefore, this gap acts like a "vacuum zone" or "gravitational zone," exerting a strong pull on future prices.
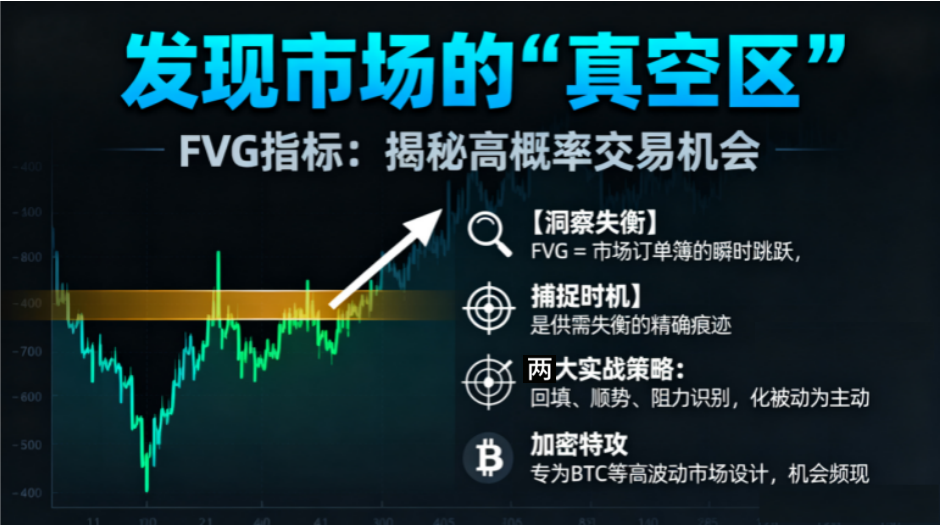
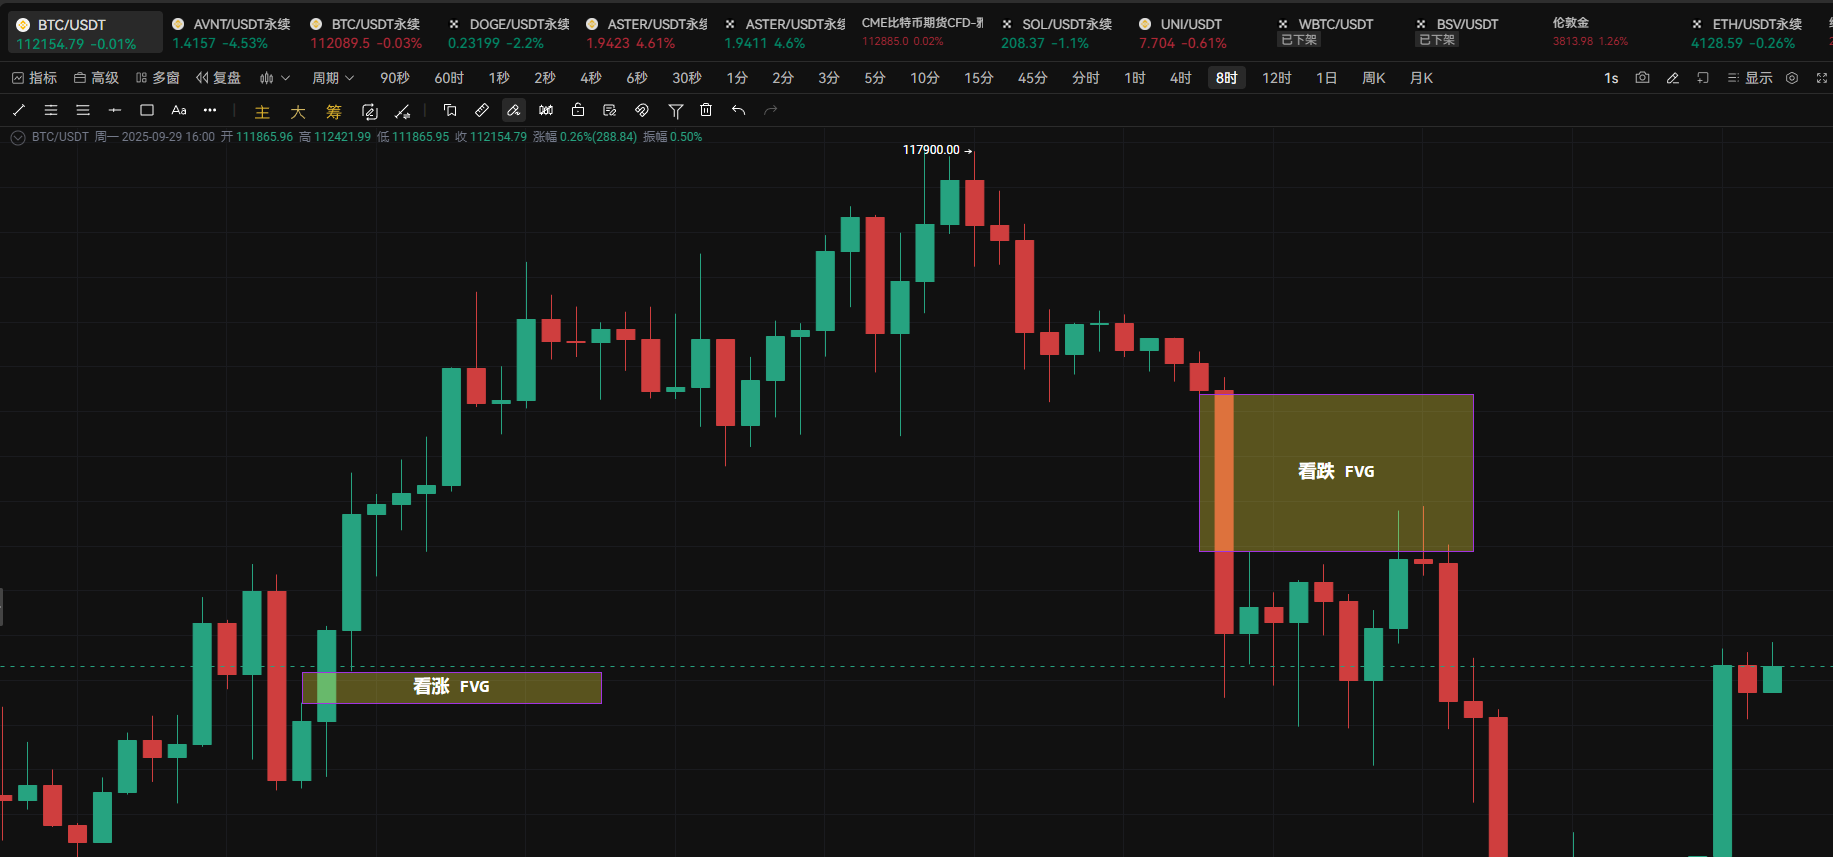
FVG can be divided into bullish and bearish types.
In an uptrend, a bullish FVG starts from the high of the first candle and ends at the low of the third candle; this gap usually acts as a support level. (The analogy just mentioned is a bullish FVG.)
In a downtrend, a bearish FVG starts from the low of the first candle and ends at the high of the third candle; this gap acts as a resistance level.
The above explanation of FVG is commonly recognized among technical traders.
### 2. Why is FVG Especially Powerful in the Crypto Market?
1. Continuous Operation and Instantaneous Fluctuations
The cryptocurrency market trades 24/7. When significant news or events (like macro data releases or core news from specific projects) erupt at any moment, the instantaneous imbalance in the market order book can directly lead to price jumps, creating significant FVGs. These gaps can occur at any time of the day.
2. Frequent Opportunities from High Volatility
Mainstream cryptocurrencies (like BTC) and many popular altcoins typically exhibit extremely high volatility. This causes prices to "jump" more frequently due to news, sentiment, or large orders, resulting in a much higher probability and density of FVG occurrences compared to many traditional assets, providing traders with numerous potential entry or risk control reference points.
3. Market Sentiment Amplifier
FVG is a direct reflection of extreme greed or fear in the market. An upward FVG represents strong FOMO (Fear of Missing Out), while a downward FVG indicates extreme panic selling.
### 3. Practical Guide: How to Trade FVG? (Two Core Strategies)
Theoretical discussions are no match for practical application.
Function Location: Indicators - Indicator Library - Search "CME Gap" - Subscribe - Display on Candlestick Chart
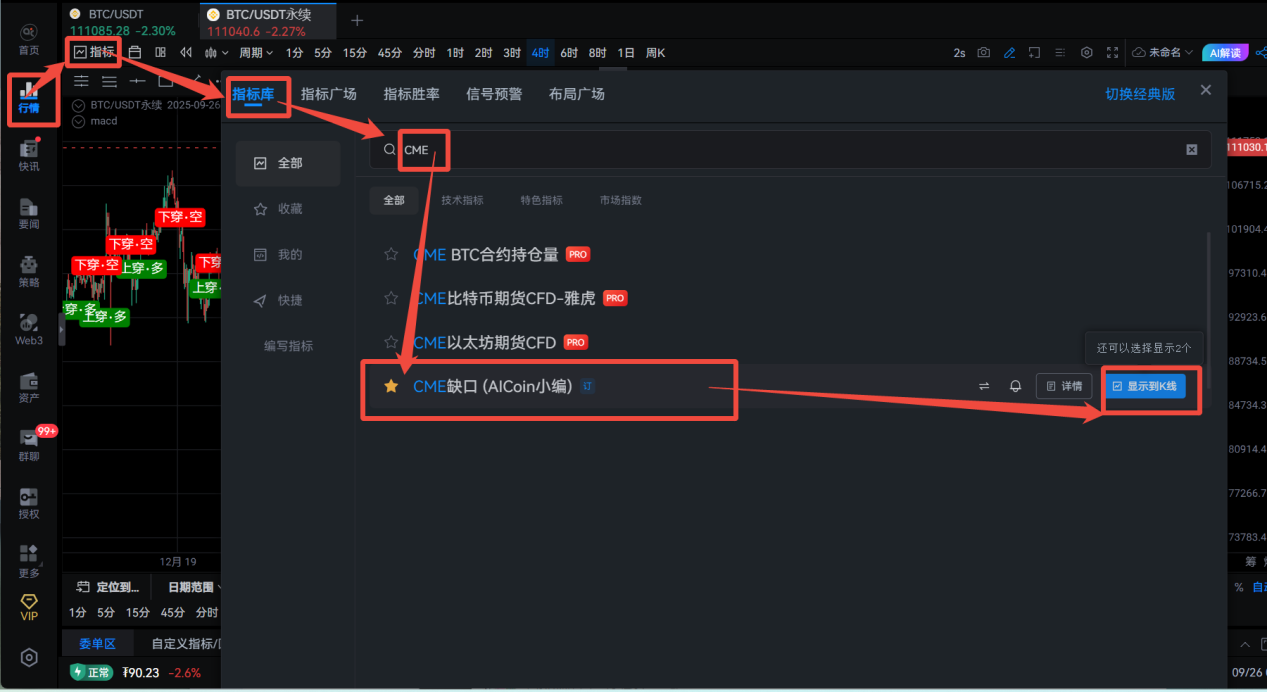
Want to understand FVG more intuitively? The "CME Gap" indicator in the AiCoin indicator library is a perfect ready-made example. You can think of it as the "most punctual" member of the FVG family.
Its occurrence is very regular: since the crypto market never sleeps, while the CME Bitcoin futures market takes weekends off, it’s like two gears moving at different speeds. Every Monday when the CME "starts work," its quotes often "gap" directly, creating a discrepancy with the actual prices in the crypto market over the weekend—this orderly gap is the CME gap, the most classic and easily observable type of FVG.
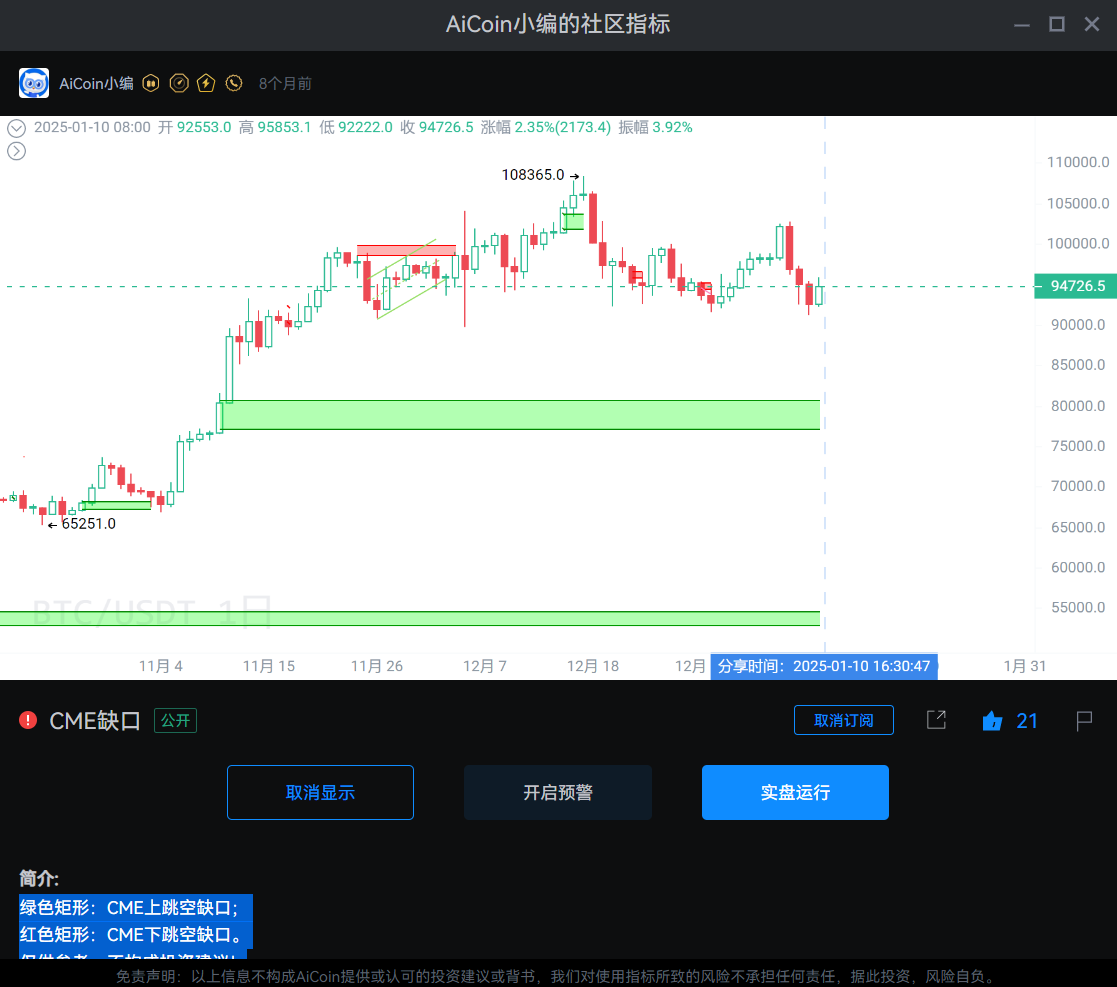
Green Rectangle: CME upward gap (i.e., bullish FVG);
Red Rectangle: CME downward gap (i.e., bearish FVG).
The trading logic of FVG remains consistent: the price has a very high probability of returning to this "vacuum zone" to fill it.
Strategy One: Entering on Pullbacks in an Uptrend—Going Long
Scenario: In a clear uptrend, a bullish FVG appears. The price then pulls back from the high point and begins to retrace.
Operation:
Wait for the Pullback: Wait for the price to retrace to the bullish FVG area.
Confirmation Signal: Look for signs of price finding support and resuming upward movement within the FVG area (such as bullish engulfing, hammer candlestick, small double bottom, etc.).
Choose to Go Long: Enter a long position after the signal appears, setting a stop loss below the FVG area.
Strict Risk Control: Target the previous high or the next resistance level.
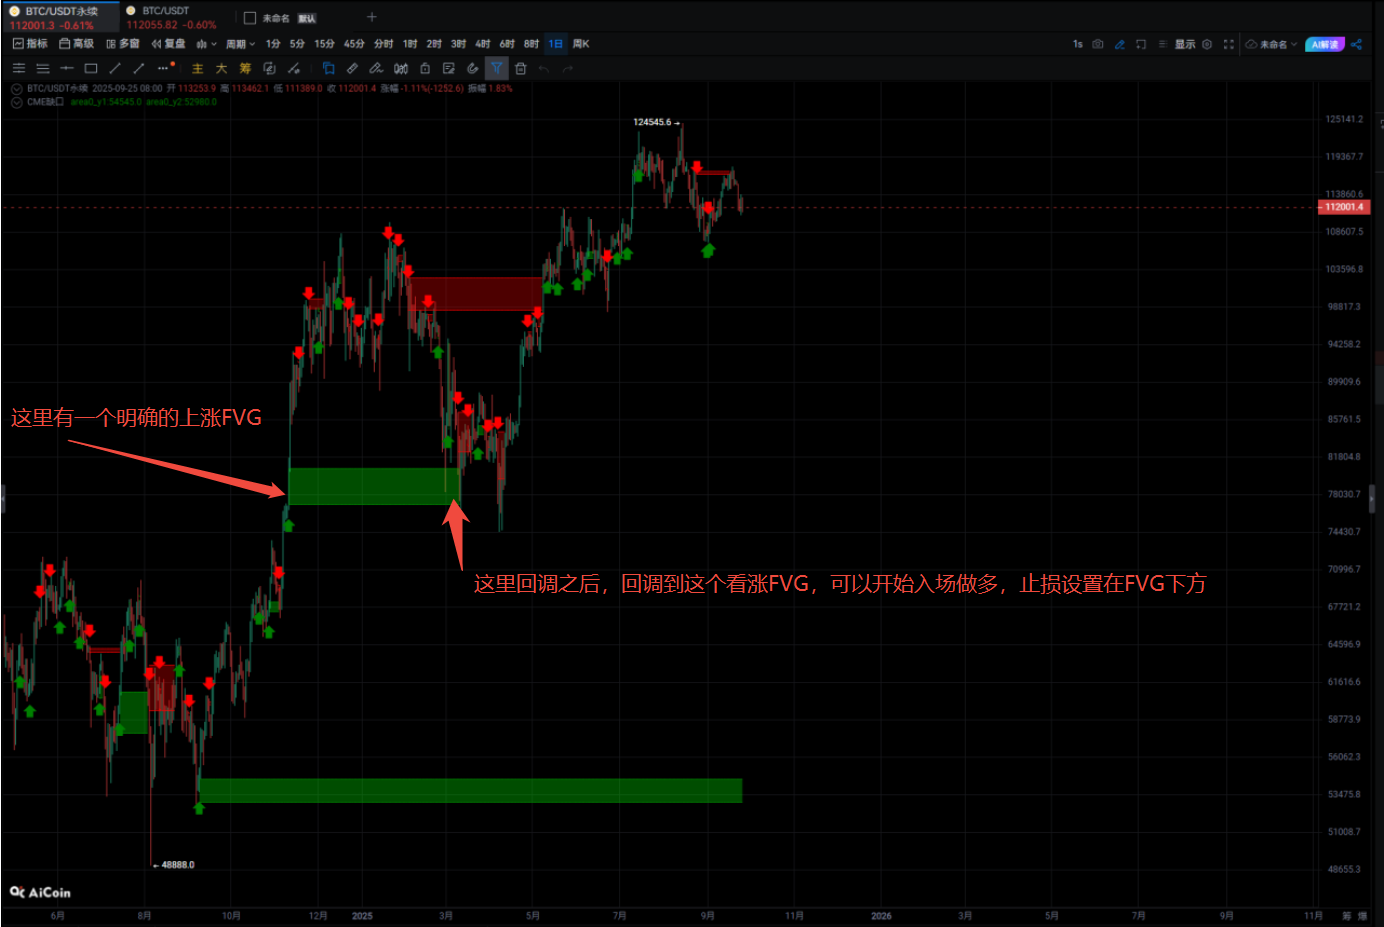
Logical Interpretation: This is a strategy for finding "discount entry tickets" within a trend. FVG acts as a dynamic support level in an uptrend. Pulling back to go long is a trend-following trade.
Strategy Two: Turning Bearish FVG into a Dynamic Resistance Zone—Shorting on Rebounds
Scenario: In a downtrend, the price rebounds upward, but there is an unfilled bearish FVG above.
Operation:
Wait for the Rebound: Patiently observe the price rebound until it enters the bearish FVG area.
Confirmation Signal: In the upper part of the FVG area, focus on whether there are signs of weakening upward momentum (such as bearish candlestick patterns, moving average resistance, etc.).
Choose to Short: After confirming the signal, consider it a shorting opportunity.
Strict Risk Control: Set a stop loss above the upper edge of the FVG area.
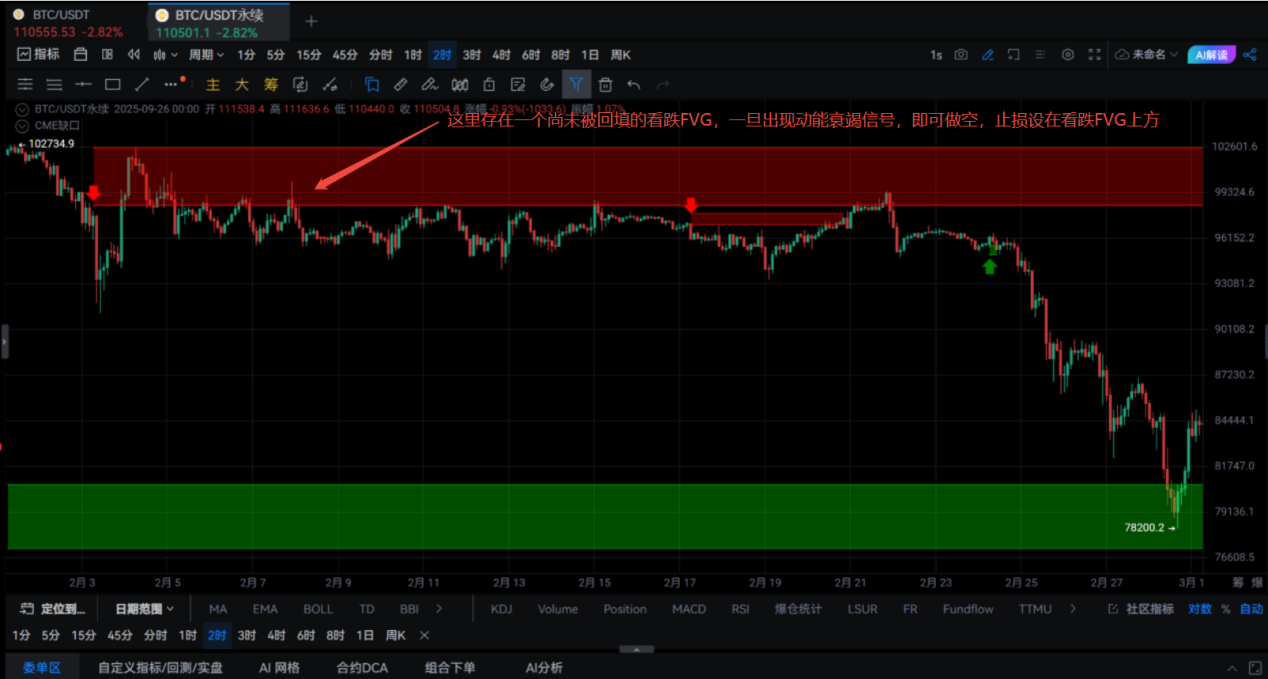
Logic: A bearish FVG is proof of strong selling pressure. When the price rebounds to fill this area, the original sellers and other shorts will see it as an ideal re-entry point, forming concentrated resistance, and the price is likely to face pressure and continue to fall.
### 4. Reminder: Avoid These Pitfalls
1. Not All Gaps Must Be Filled
While the probability is high, not all FVGs will be immediately or completely filled. Especially in strong one-sided trends, multiple overlapping FVGs may occur.
2. Combine with Larger Timeframe Context
FVGs on daily charts are much more important than those on 15-minute charts. Always prioritize gaps from higher timeframes (like 4H, 1D).
3. Confluence is Key
Do not use FVG in isolation! It must resonate with other tools to significantly increase its win rate. For example:
Spatial Confluence: The FVG area overlaps with previous important support or resistance levels.
Trend Confluence: The boundaries of the FVG coincide with key moving averages like the 200-day.
Momentum Confluence: When the price retraces to the FVG, there is also bullish/bearish divergence in RSI or MACD.
Conclusion: From "Watching the Show" to "Understanding the Game"
FVG is not a holy grail that will make you "rich overnight," but it is an extremely efficient market structure analysis tool. It helps you understand the logic behind price behavior, allowing you to shift from passively following candlesticks to actively predicting the market's next moves.
In today's world, where information gaps are gradually narrowing, having a deeper cognitive framework and more professional analytical tools is your core competitive advantage for long-term survival and development in the crypto market. Now, open your charts and start looking for those previously overlooked "Fair Value Gaps" in Bitcoin and Ethereum's daily charts! You will find that the market has suddenly become much "clearer" to you.
Start Your FVG Exploration Journey!
Join our community to discuss and grow stronger together!
Official Telegram Community: t.me/aicoincn
AiCoin Chinese Twitter: https://x.com/AiCoinzh
Group Chat - Wealth Group: https://www.aicoin.com/link/chat?cid=10013
免责声明:本文章仅代表作者个人观点,不代表本平台的立场和观点。本文章仅供信息分享,不构成对任何人的任何投资建议。用户与作者之间的任何争议,与本平台无关。如网页中刊载的文章或图片涉及侵权,请提供相关的权利证明和身份证明发送邮件到support@aicoin.com,本平台相关工作人员将会进行核查。


