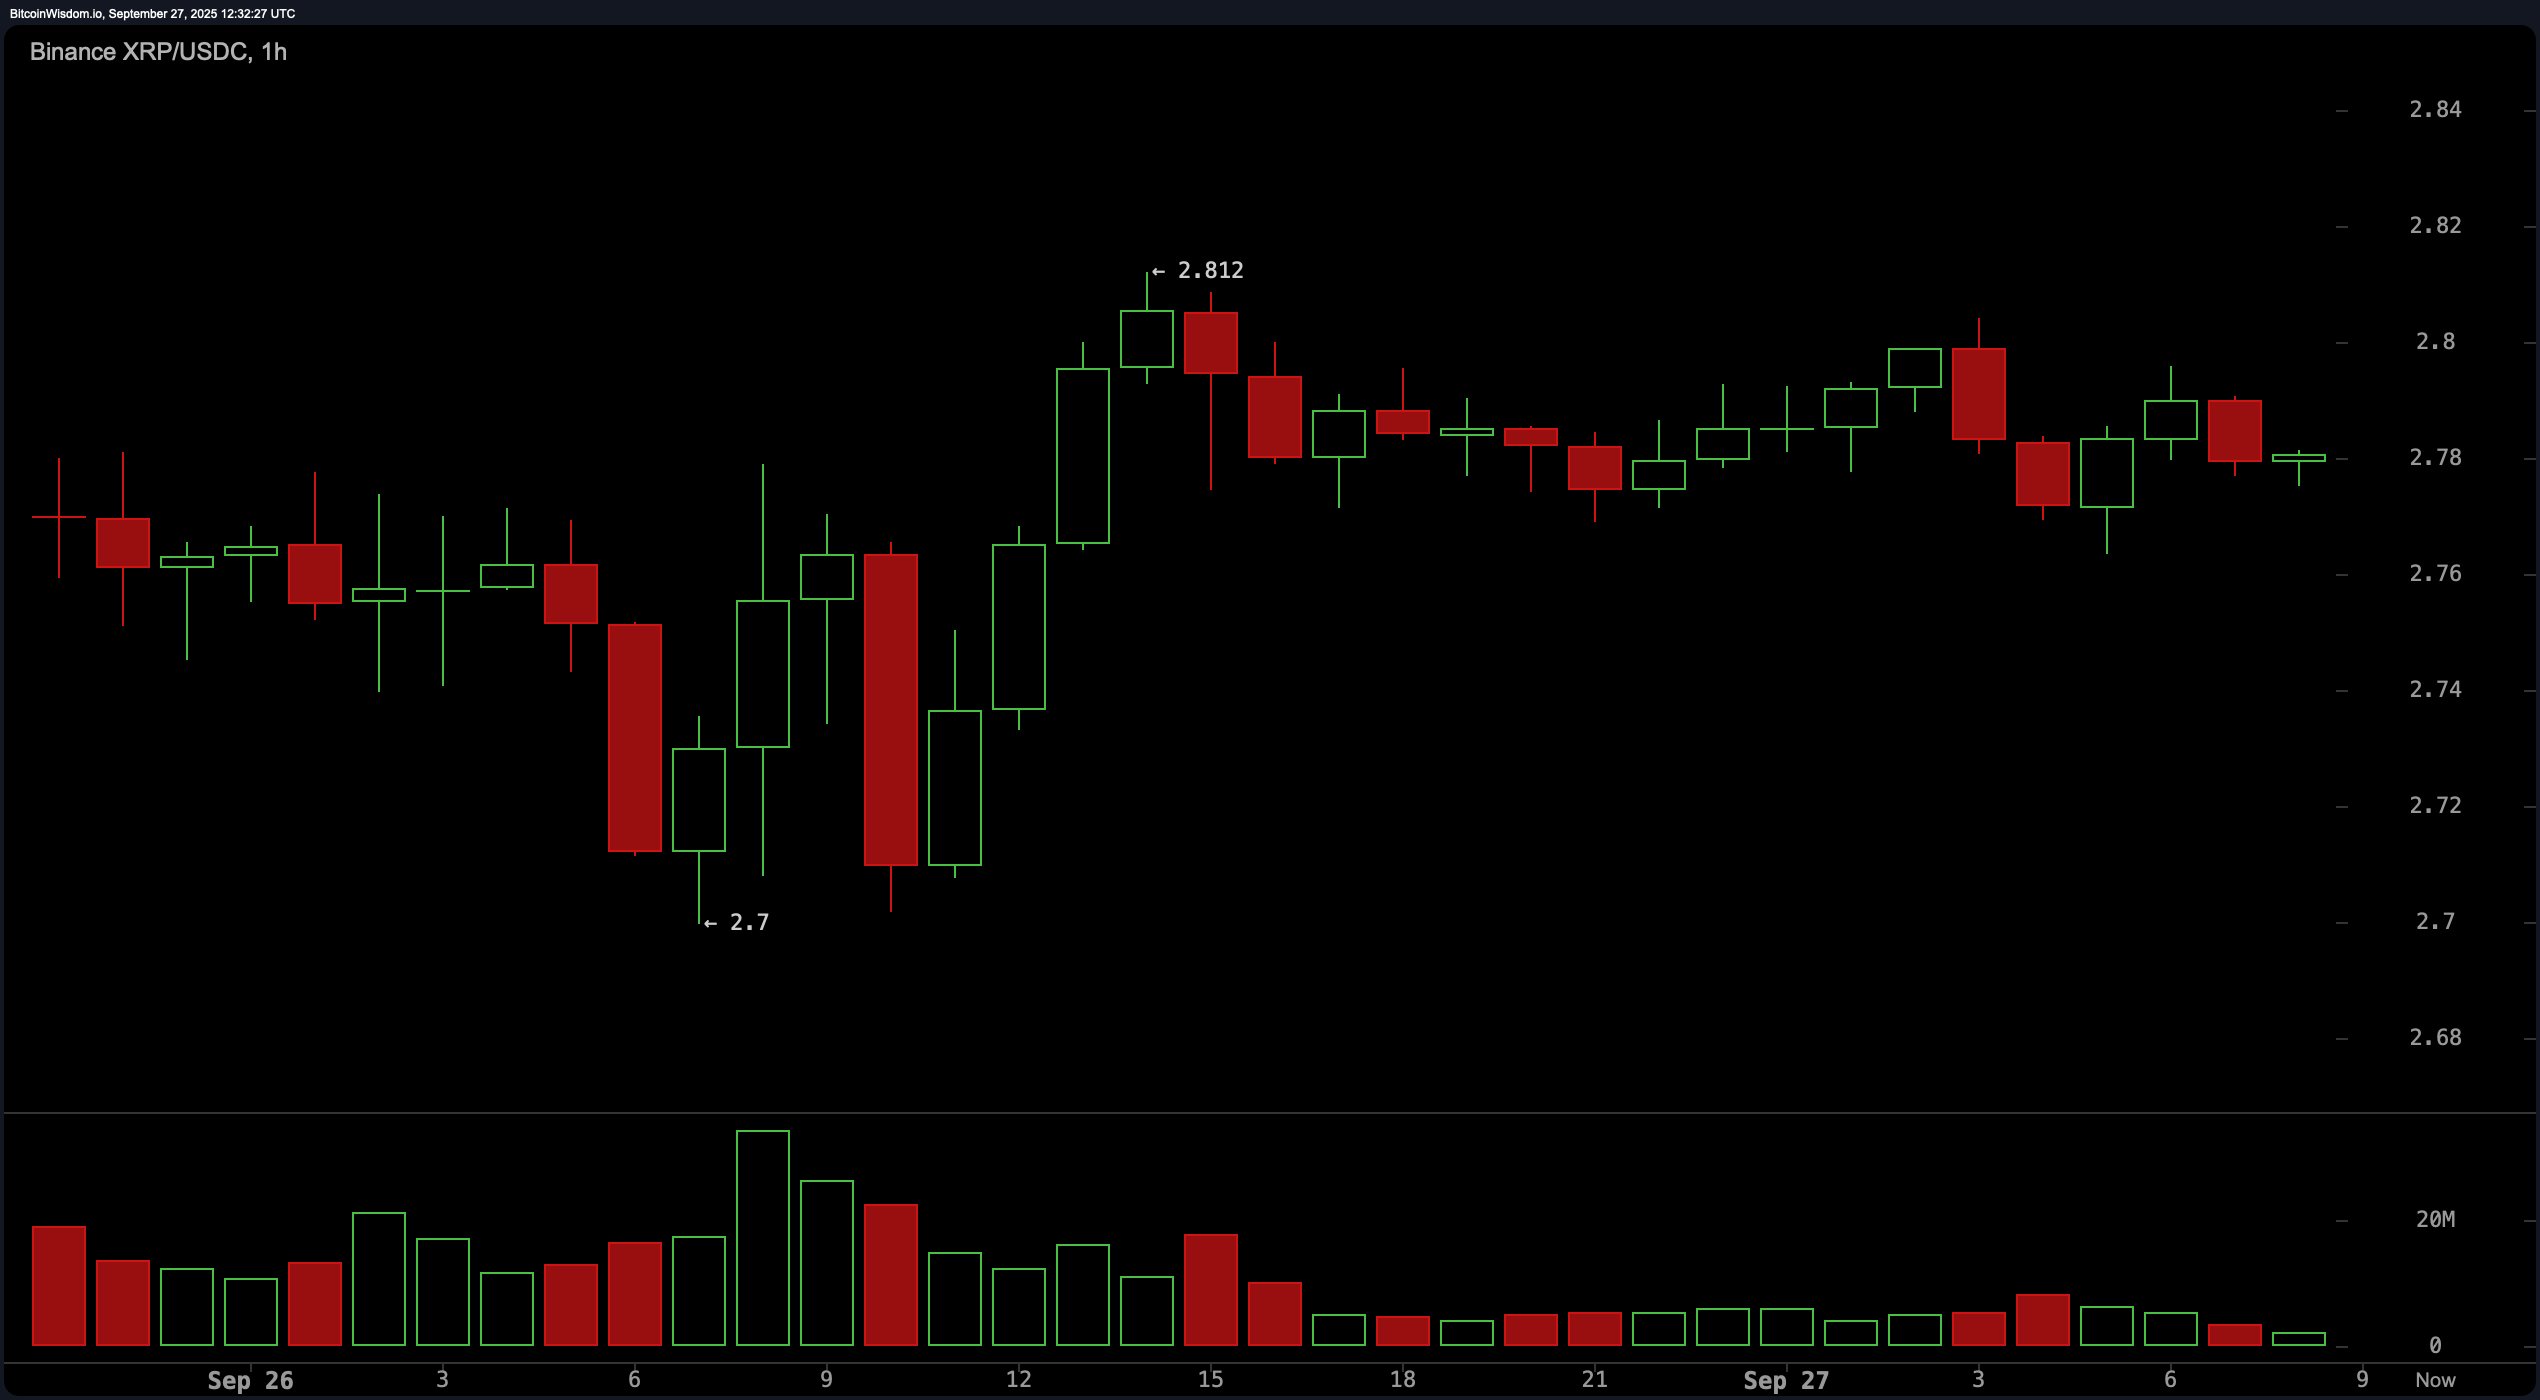
The one-hour chart suggests XRP might be flirting with the idea of a breakout—but right now, it’s stuck in the friend zone. After bouncing from $2.70 to $2.812, it’s been loitering in a tight range, signaling potential accumulation.
Volume has been whisper-quiet, lacking the punch needed to confirm bullish conviction. To flip the short-term script, XRP needs to break and hold above the $2.80 threshold. Otherwise, expect a flirtation with support at $2.70 to resume, possibly dipping just below for a quick test of nerves.

XRP/USDC via Binance on Sept. 27, 2025, 1-hour chart.
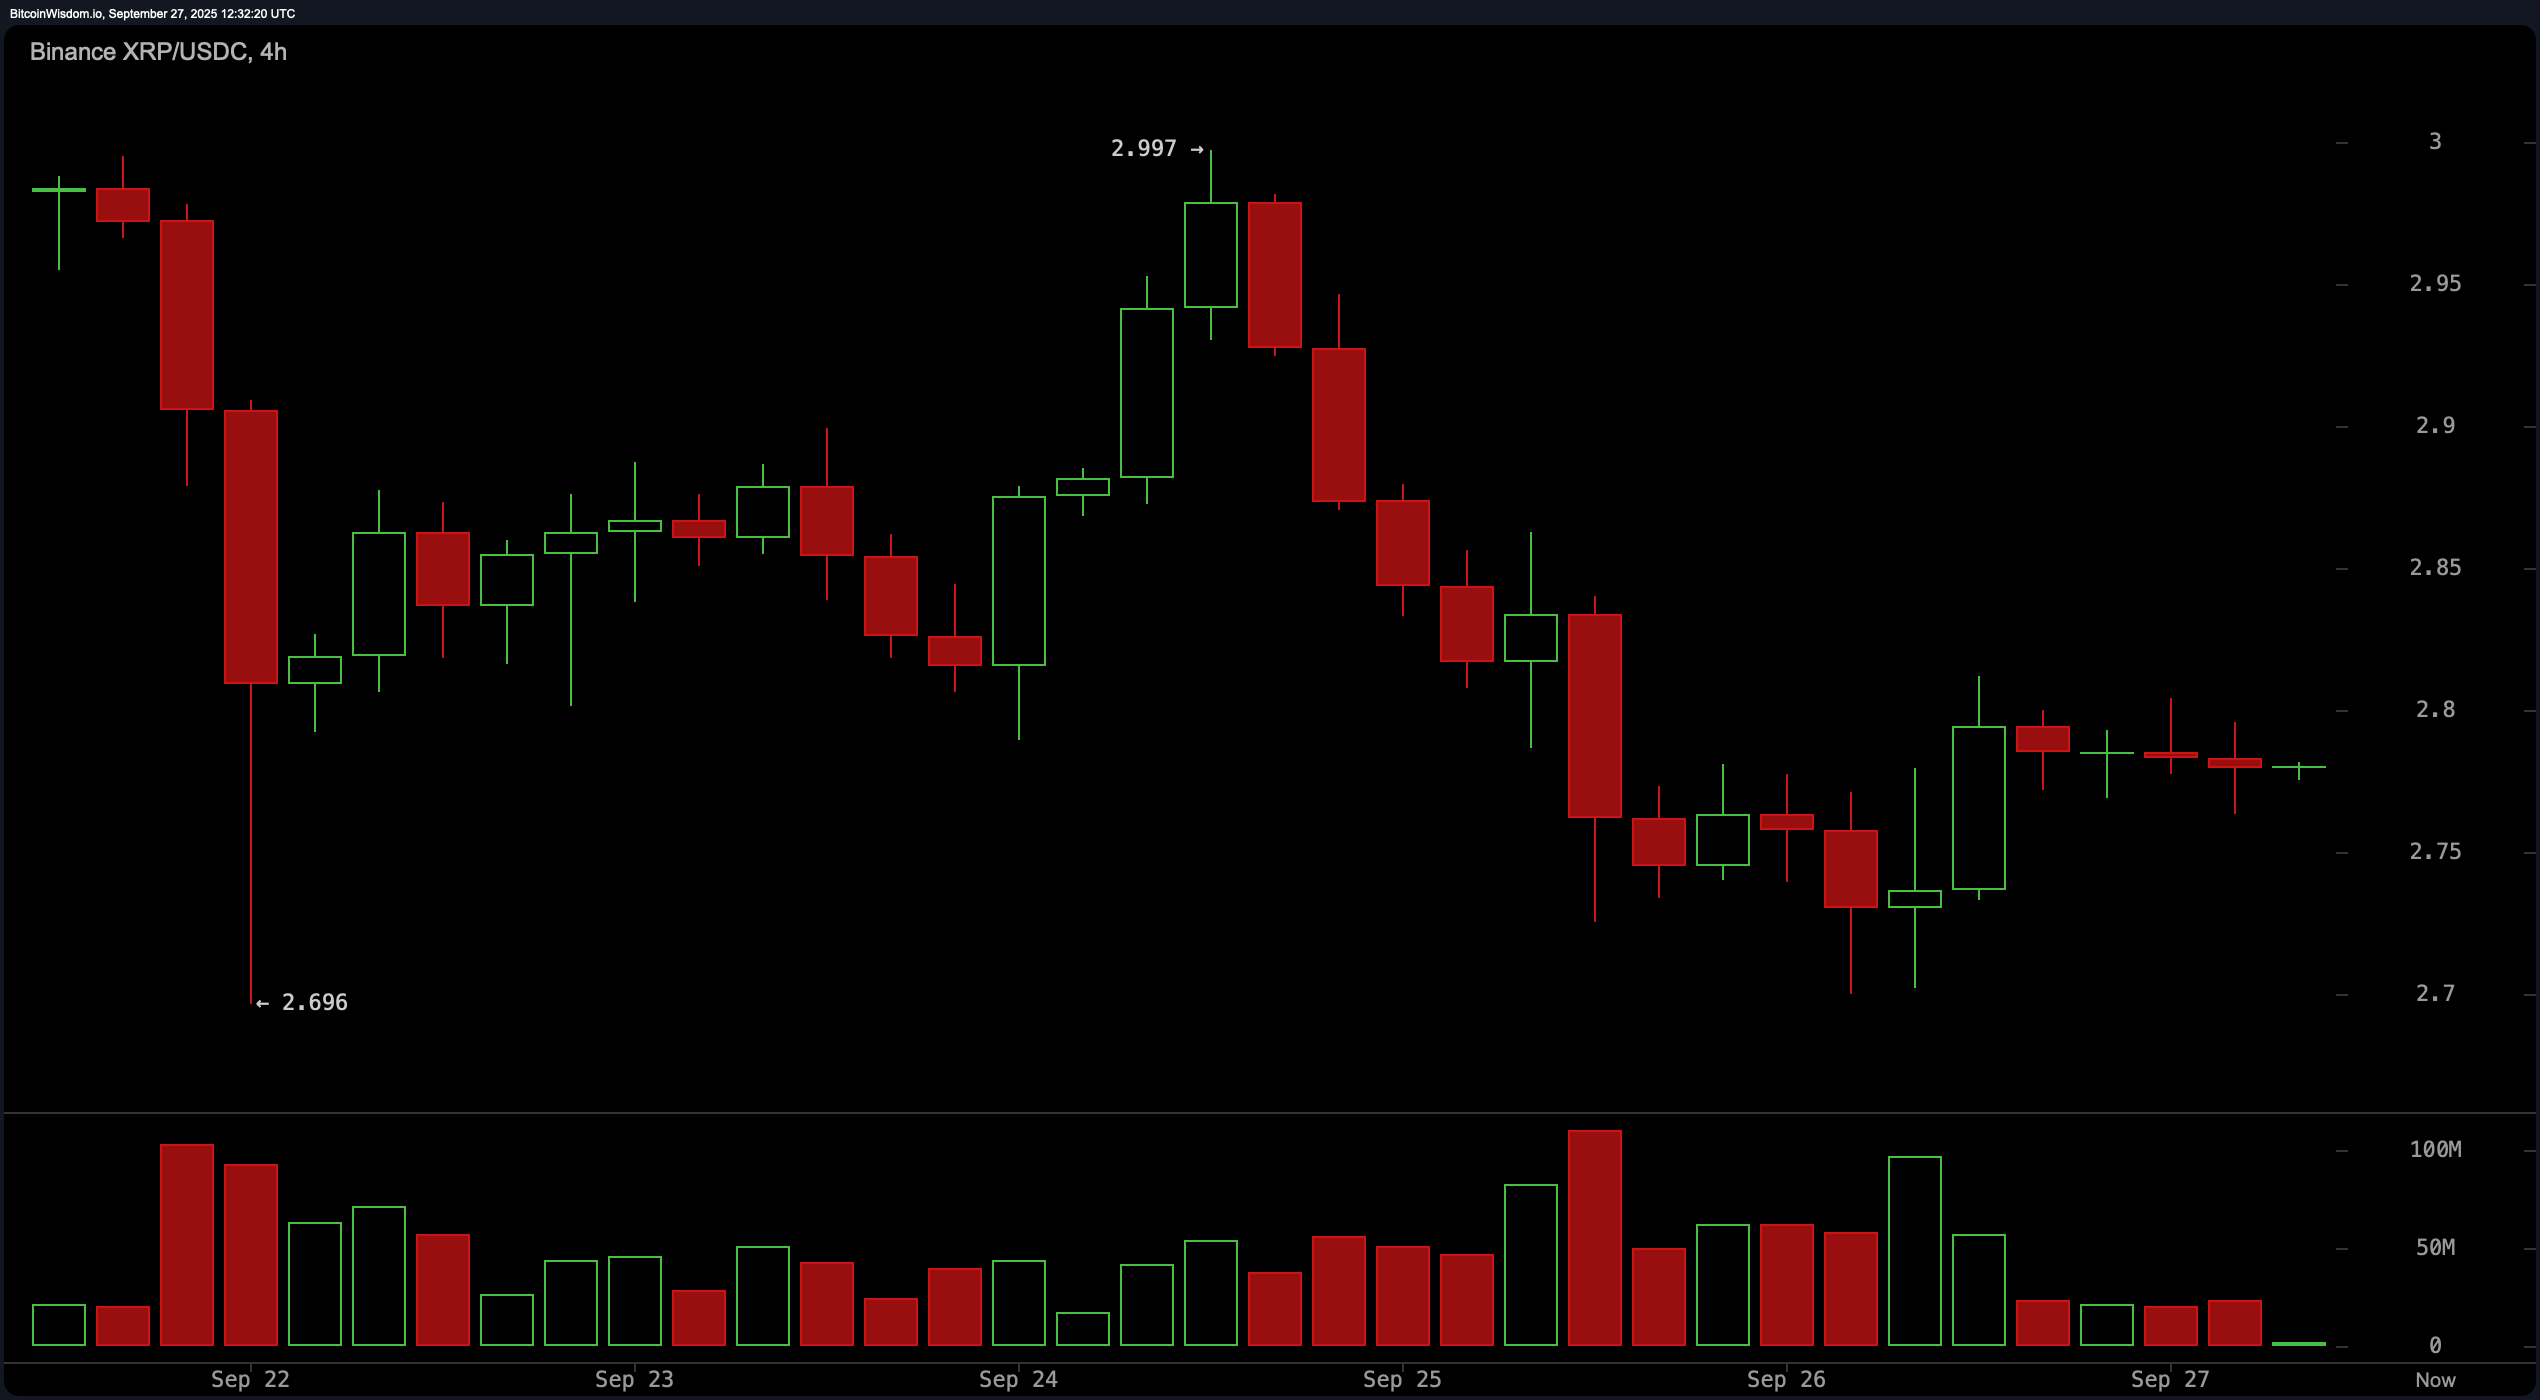
Zooming out to the four-hour chart, XRP is dancing a bearish-to-sideways shuffle. Following a failed rally that peaked at $2.997, the price has slinked back into a lackluster range between $2.75 and $2.80. Lower highs and weaker volume are painting a portrait of indecision. Support at $2.70 is the last line of defense—if it gives way, brace for a drop to the $2.60–$2.65 neighborhood. On the flip side, a breakout past the $2.85–$2.90 resistance could inject some bullish adrenaline into the mix.

XRP/USDC via Binance on Sept. 27, 2025, 4-hour chart.
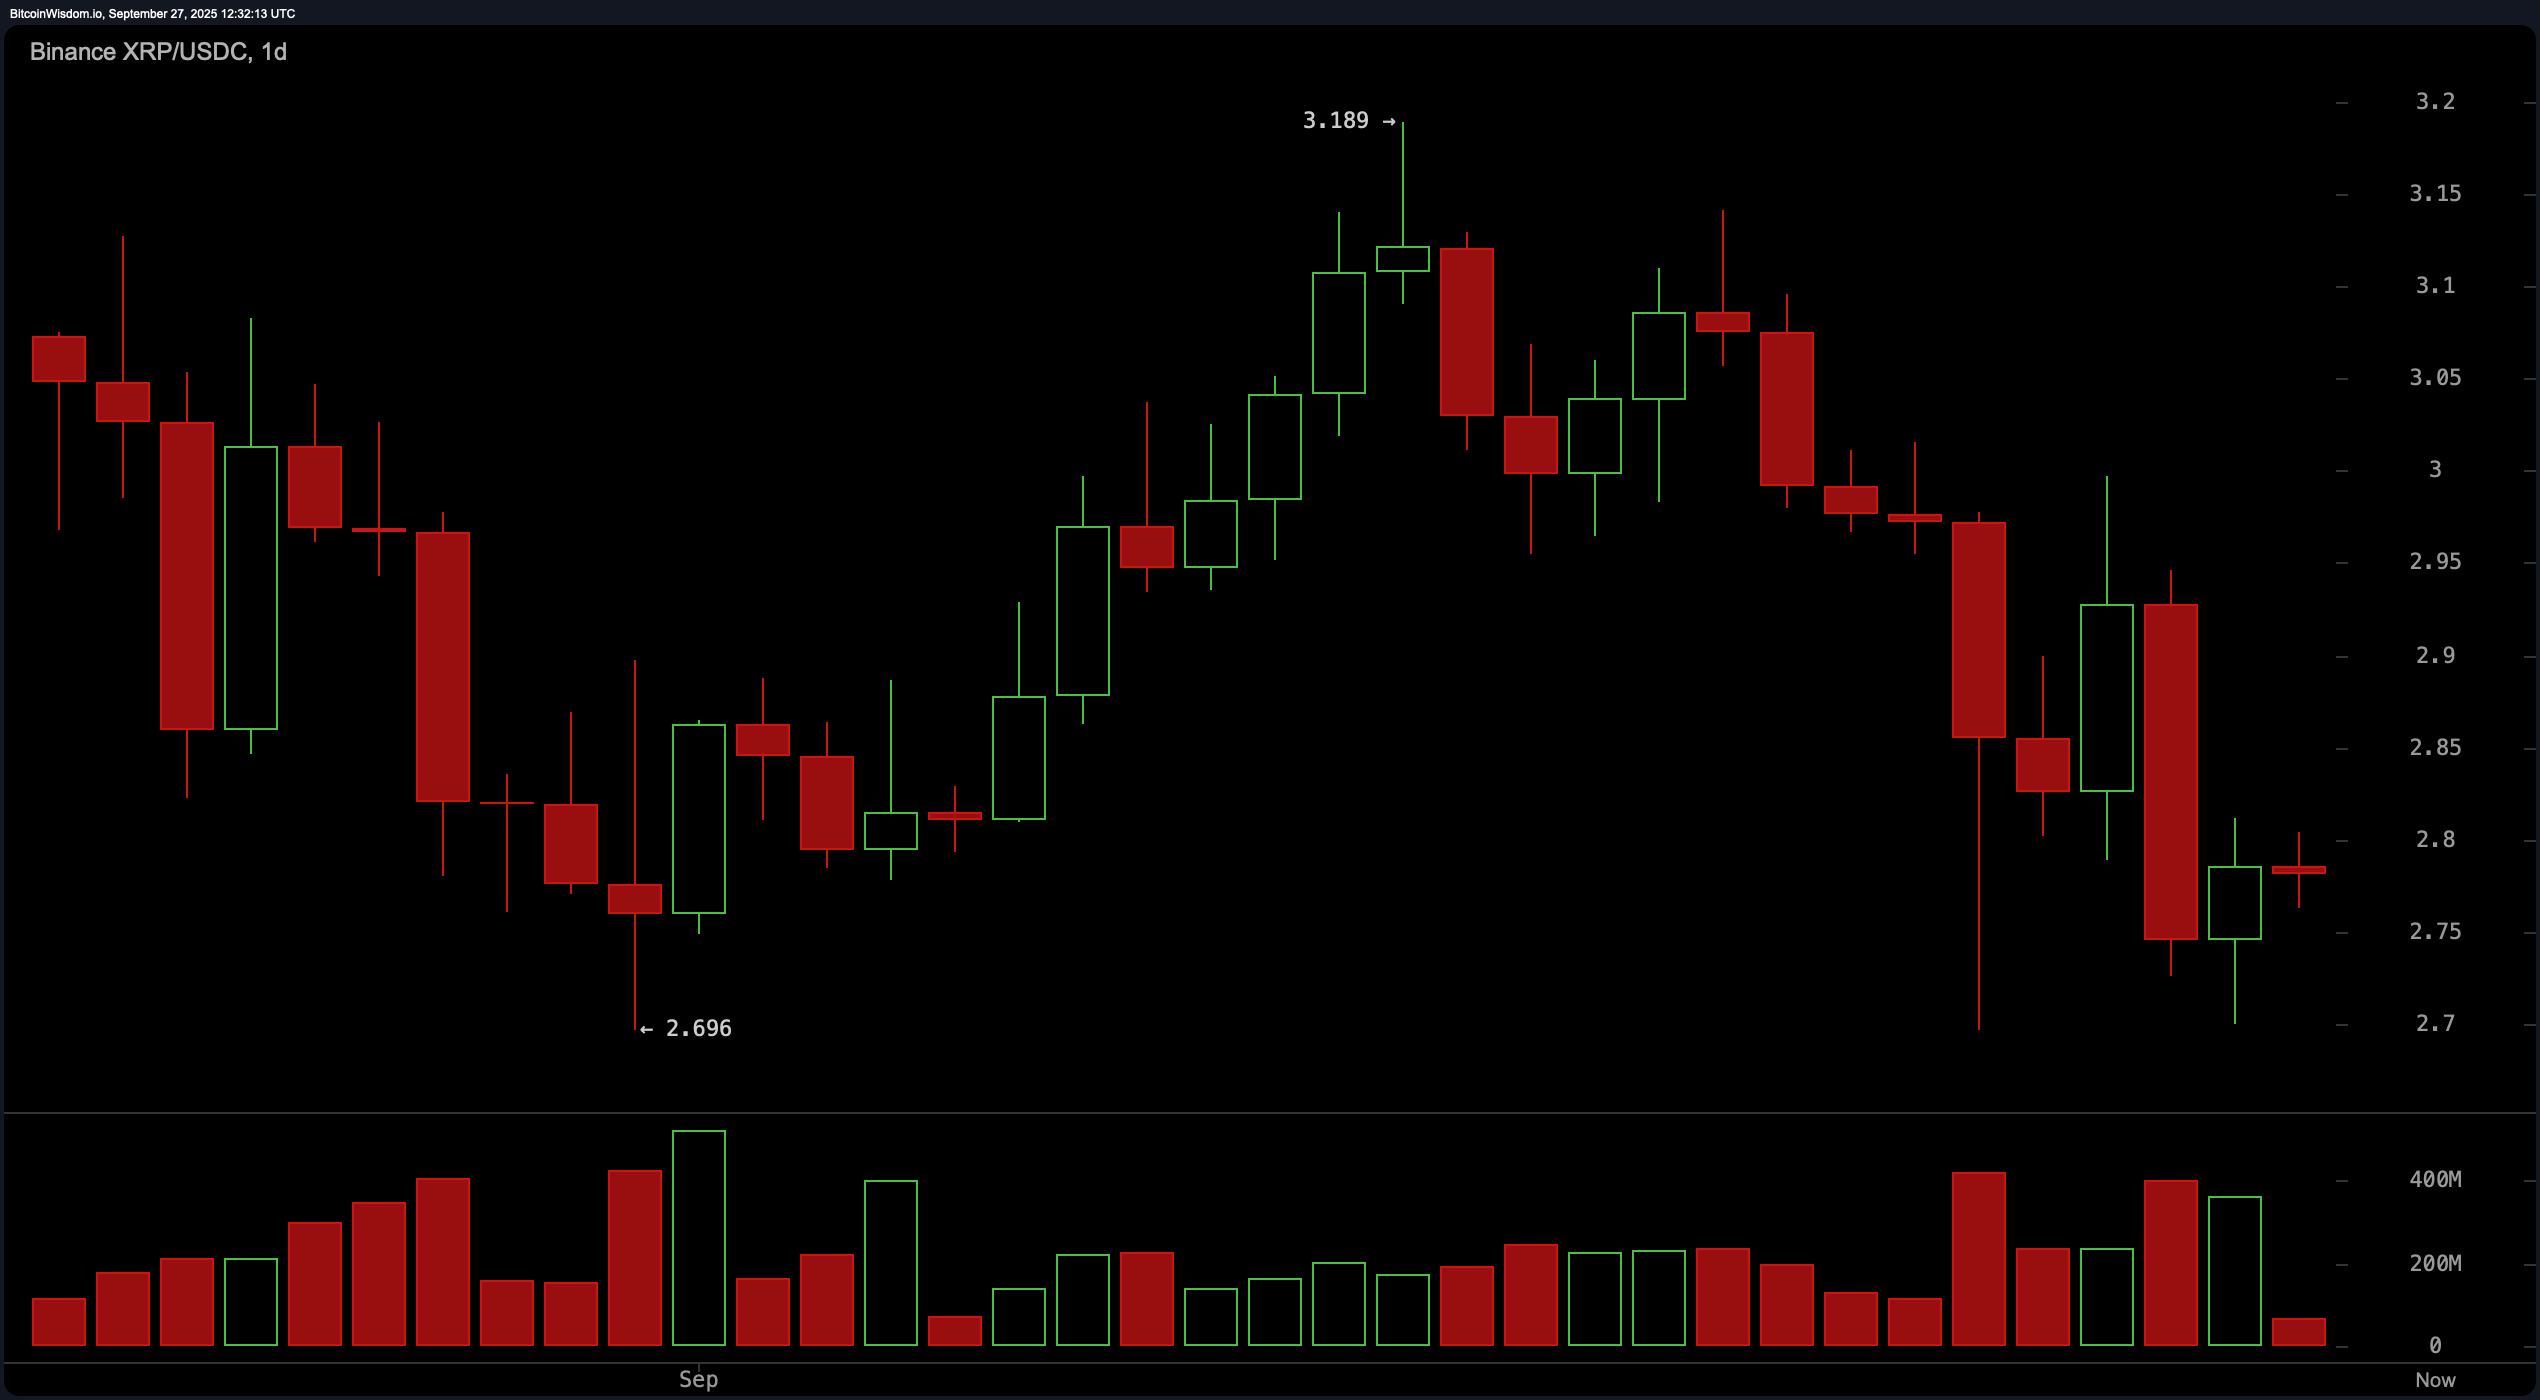
The daily chart reads like a cautionary tale. XRP recently tumbled from a high of $3.189 to a low of $2.70, a classic case of a rounding top gone wrong. That sharp decline brought in hefty red volume bars, signaling aggressive selling pressure. While the $2.70 level has held firm for now, acting as key support, the resistance around $2.9–$3.0 continues to cap any bullish ambitions. Until XRP can push past that ceiling with conviction, the macro trend stays grounded in a bearish-to-sideways narrative.

XRP/USDC via Binance on Sept. 27, 2025, 1-day chart.
On the oscillator front, things are as neutral as a poker-faced dealer. The relative strength index (RSI) stands at 40.46—neither hot nor cold. The Stochastic oscillator is parked at 15.82, also in neutral territory. The commodity channel index (CCI) offers a contrarian bullish view at -140.36, while the average directional index (ADX) at 17.62 tells us this trend lacks muscle. Meanwhile, the Awesome oscillator is sitting at -0.10 with a flat neutral, and the momentum indicator at -0.31 suggests a slow slide. The moving average convergence divergence (MACD) level of -0.04 screams bearishness from across the room. The takeaway? No clear signals, but bearish whispers are getting louder.
And if that weren’t enough, the moving averages (MAs) have formed a bear parade. Every short- and mid-term moving average—from the exponential moving average (EMA) and simple moving average (SMA) over 10, 20, 30, 50, and 100 periods—is flashing bearish signals like XRP’s on clearance. Only the long-term EMAs and SMAs over 200 periods are holding the line with a bullish signal, a sign that the macro structure isn’t entirely broken. Still, without a bullish catalyst, XRP is more likely to test support than to break resistance.
Bull Verdict:
If XRP can punch through the $2.80 ceiling and ride momentum past $2.85 with volume to back it, we’re looking at a potential reversal brewing on the short-term charts. With long-term moving averages still signaling strength, bulls have a narrow window to reclaim control—so long as $2.70 remains unbroken.
Bear Verdict:
Despite today’s modest uptick, the charts are still leaning bearish. Weak volume, stalled momentum, and a conga line of sell signals across short- and mid-term moving averages suggest further downside risk. Unless XRP breaks above $2.85 with conviction, a return to $2.60 territory is still very much in play.
免责声明:本文章仅代表作者个人观点,不代表本平台的立场和观点。本文章仅供信息分享,不构成对任何人的任何投资建议。用户与作者之间的任何争议,与本平台无关。如网页中刊载的文章或图片涉及侵权,请提供相关的权利证明和身份证明发送邮件到support@aicoin.com,本平台相关工作人员将会进行核查。


