原文标题:From Rally to Correction
原文作者:Chris Beamish、 Antoine Colpaert、 CryptoVizArt,Glassnode
原文编译:AididiaoJP,Foresight News
比特币在联邦公开市场委员会引发的上涨后显示出疲软迹象。长期持有者已实现 340 万 BTC 的利润,而 ETF 流入放缓。在现货和期货市场承压的情况下,短期持有者成本基础 11.1 万美元是关键支撑位,若失守则可能面临更深的降温风险。
摘要
· 在 FOMC 驱动的上涨之后,比特币已进入回调阶段,显示出「买谣言,卖事实」的市场迹象,更广泛的市场结构指向动能减弱。
· 8% 的跌幅目前仍较为温和,但 6780 亿美元的已实现市值流入和长期持有者实现的 340 万 BTC 利润,凸显了本轮资本轮换和抛售规模的空前程度。
· ETF 流入在 FOMC 会议前后急剧放缓,同时长期持有者抛售加速,造成了资金流的脆弱平衡。
· 抛售期间现货成交量激增,期货市场出现剧烈去杠杆波动,清算集群揭示了市场双向受流动性驱动波动的脆弱性。
· 期权市场重新定价激进,偏斜度飙升,看跌期权需求旺盛,表明防御性头寸布局,宏观背景表明市场日益疲惫。
从上涨到回调
在 FOMC 驱动、价格接近 11.7 万美元见顶的上涨之后,比特币已过渡到回调阶段,呼应了典型的「买谣言,卖事实」模式。在本期中,我们跳出短期波动,评估更广泛的市场结构,使用长期链上指标、ETF 需求和衍生品头寸来评估此次回撤是健康的盘整还是更深层次收缩的早期阶段。
链上分析
波动性背景
当前从 12.4 万美元的历史高点(ATH)回落至 11.37 万美元的跌幅仅为 8%(最新跌幅已达 12%),与本周期的 28% 跌幅或之前周期的 60% 跌幅相比显得温和。这与波动性减弱的长期趋势一致,无论是在宏观周期之间还是周期内的阶段内,都类似于 2015-2017 年的稳步推进,只是目前尚未出现其末期的暴涨行情。
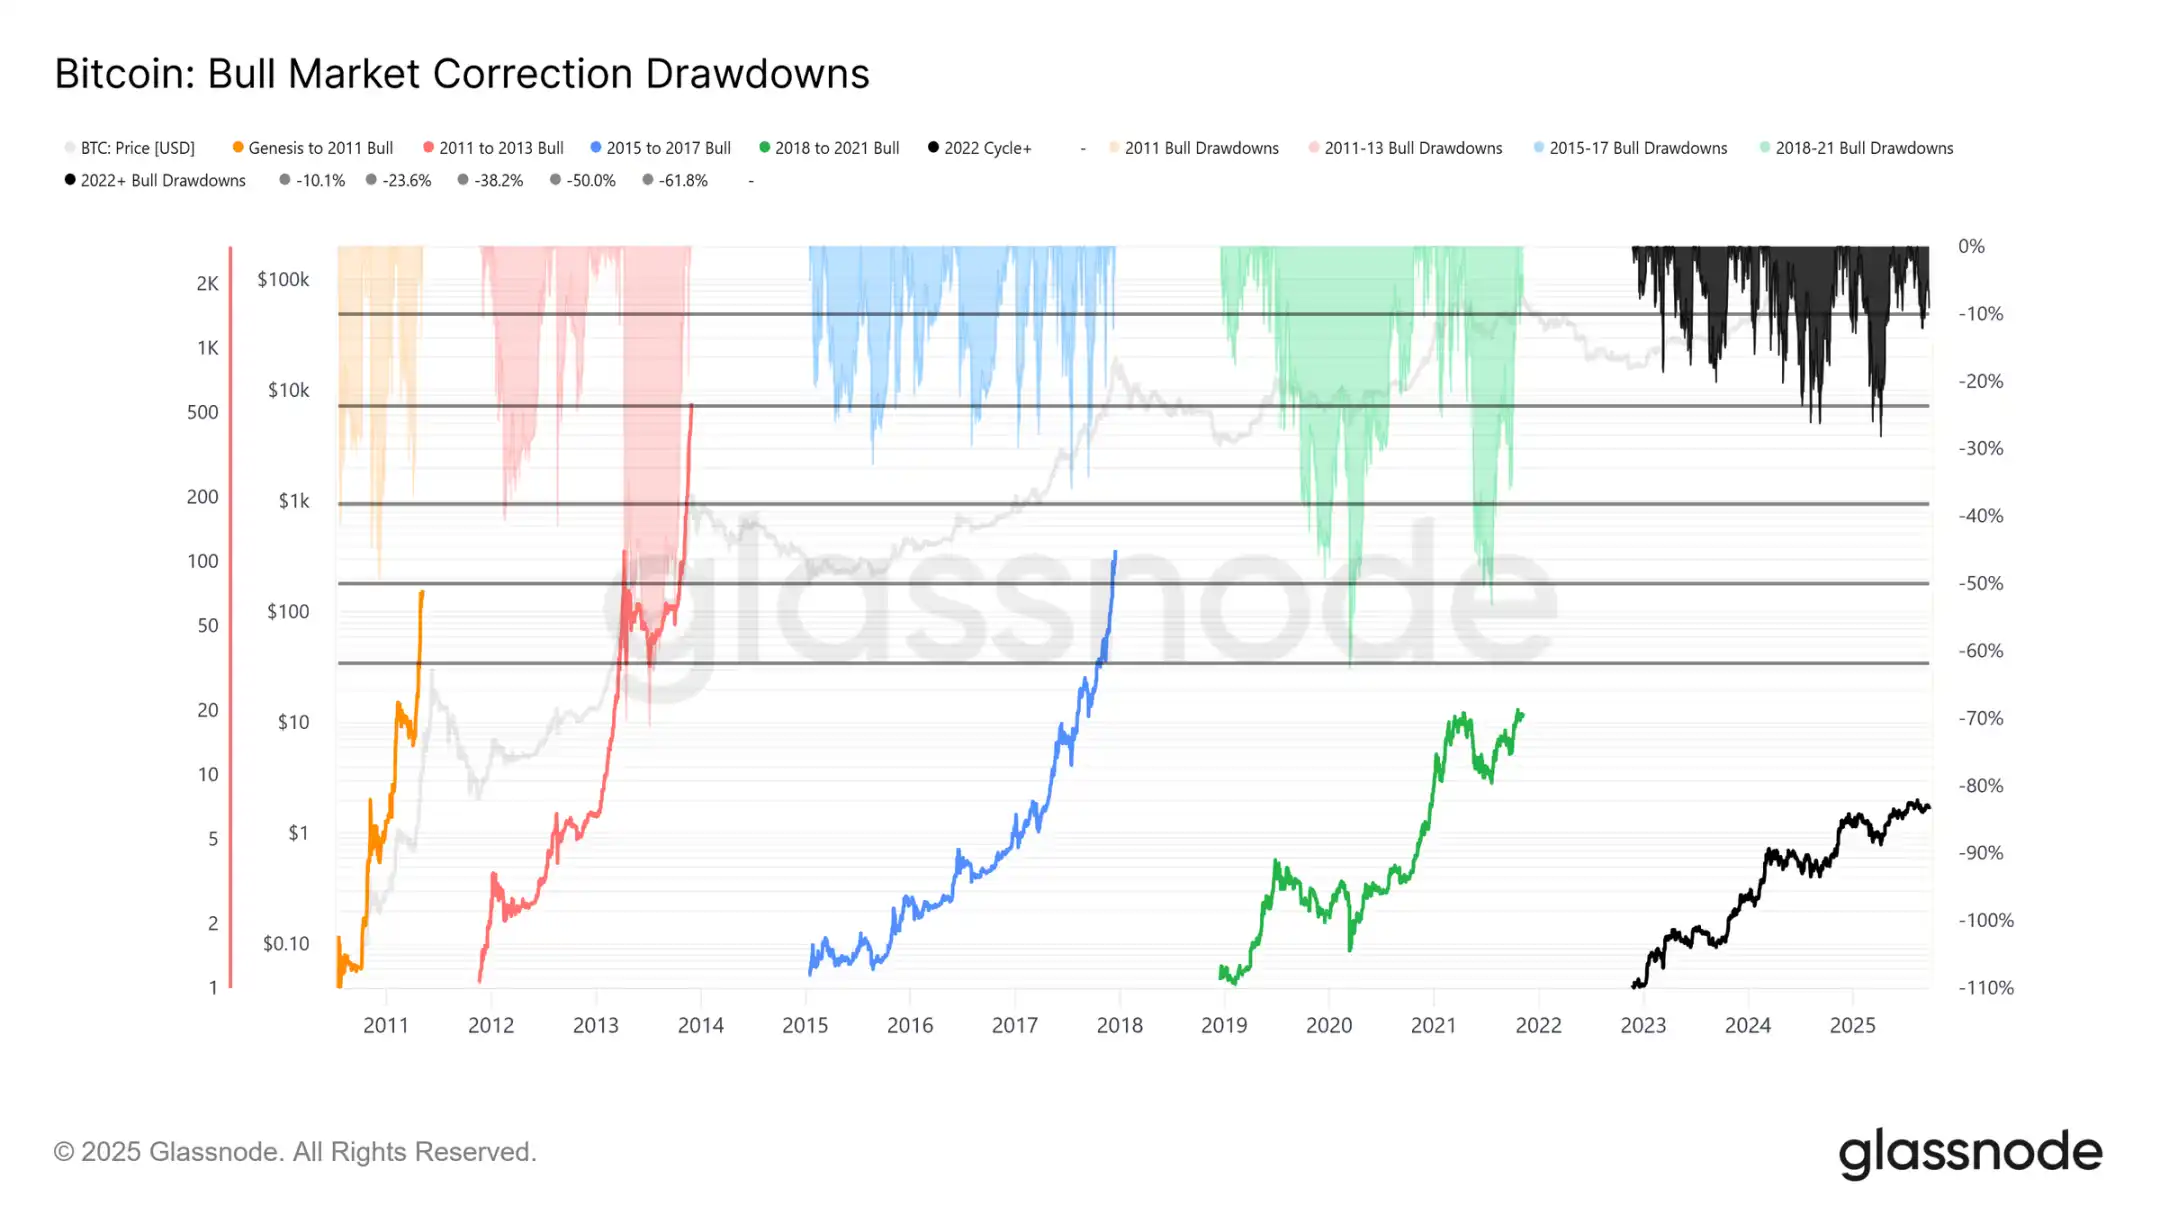
周期持续时间
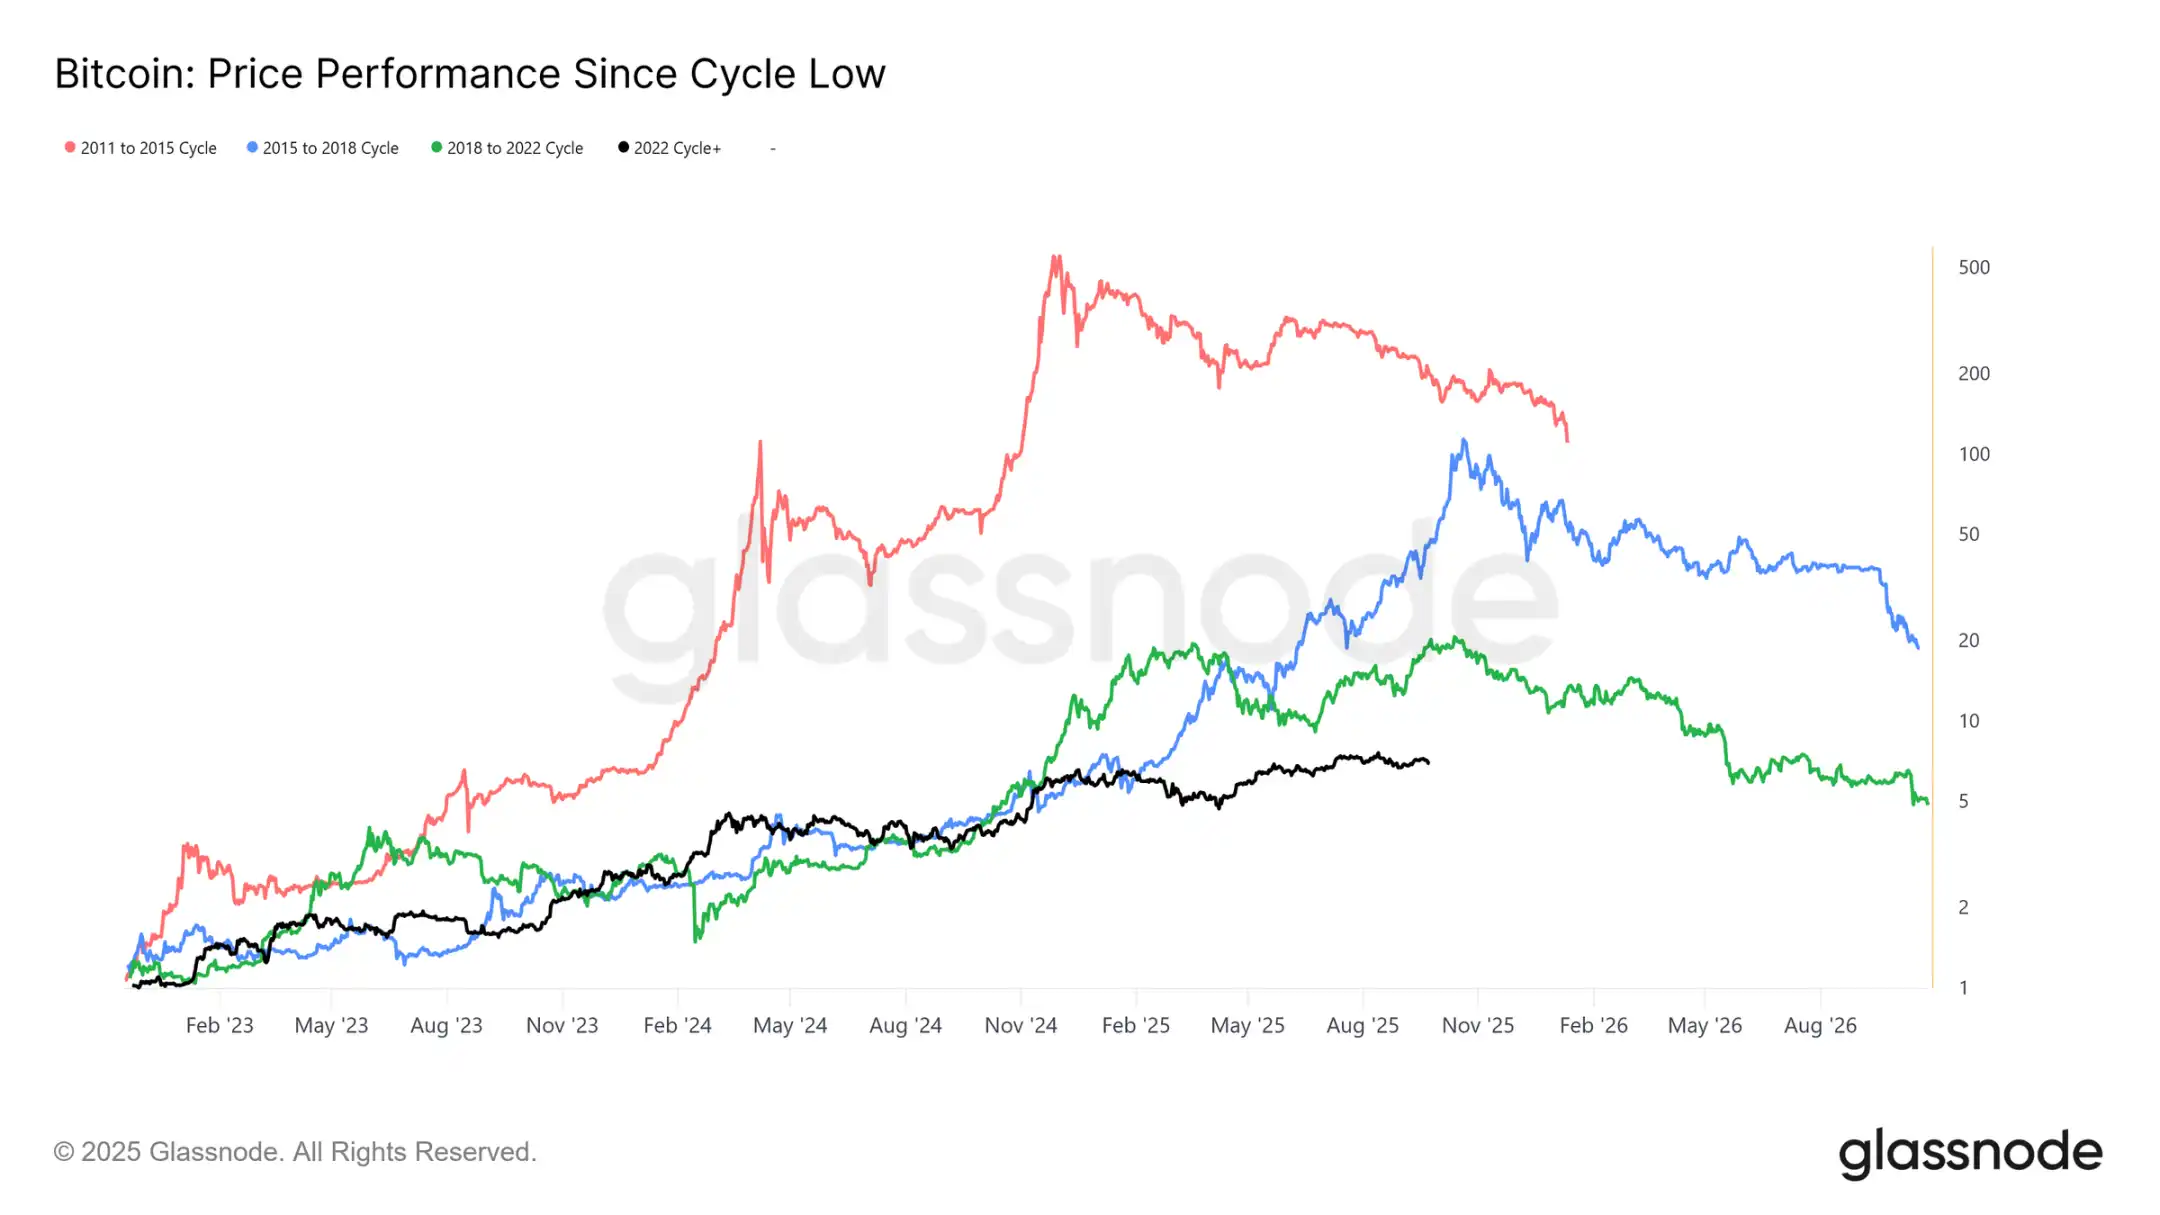
叠加过去四个周期可以看出,即使当前轨迹与前两个周期紧密吻合,峰值回报率也已随时间推移而减弱。假设 12.4 万美元标志着全球顶部,那么本周期已持续约 1030 天,非常接近前两个周期约 1060 天的长度。
资本流入衡量
除了价格走势,资本部署提供了一个更可靠的视角。
已实现市值自 2022 年 11 月以来已出现三波上涨。将总额提升至 1.06 万亿美元,反映了支撑本周期流入资金的规模。
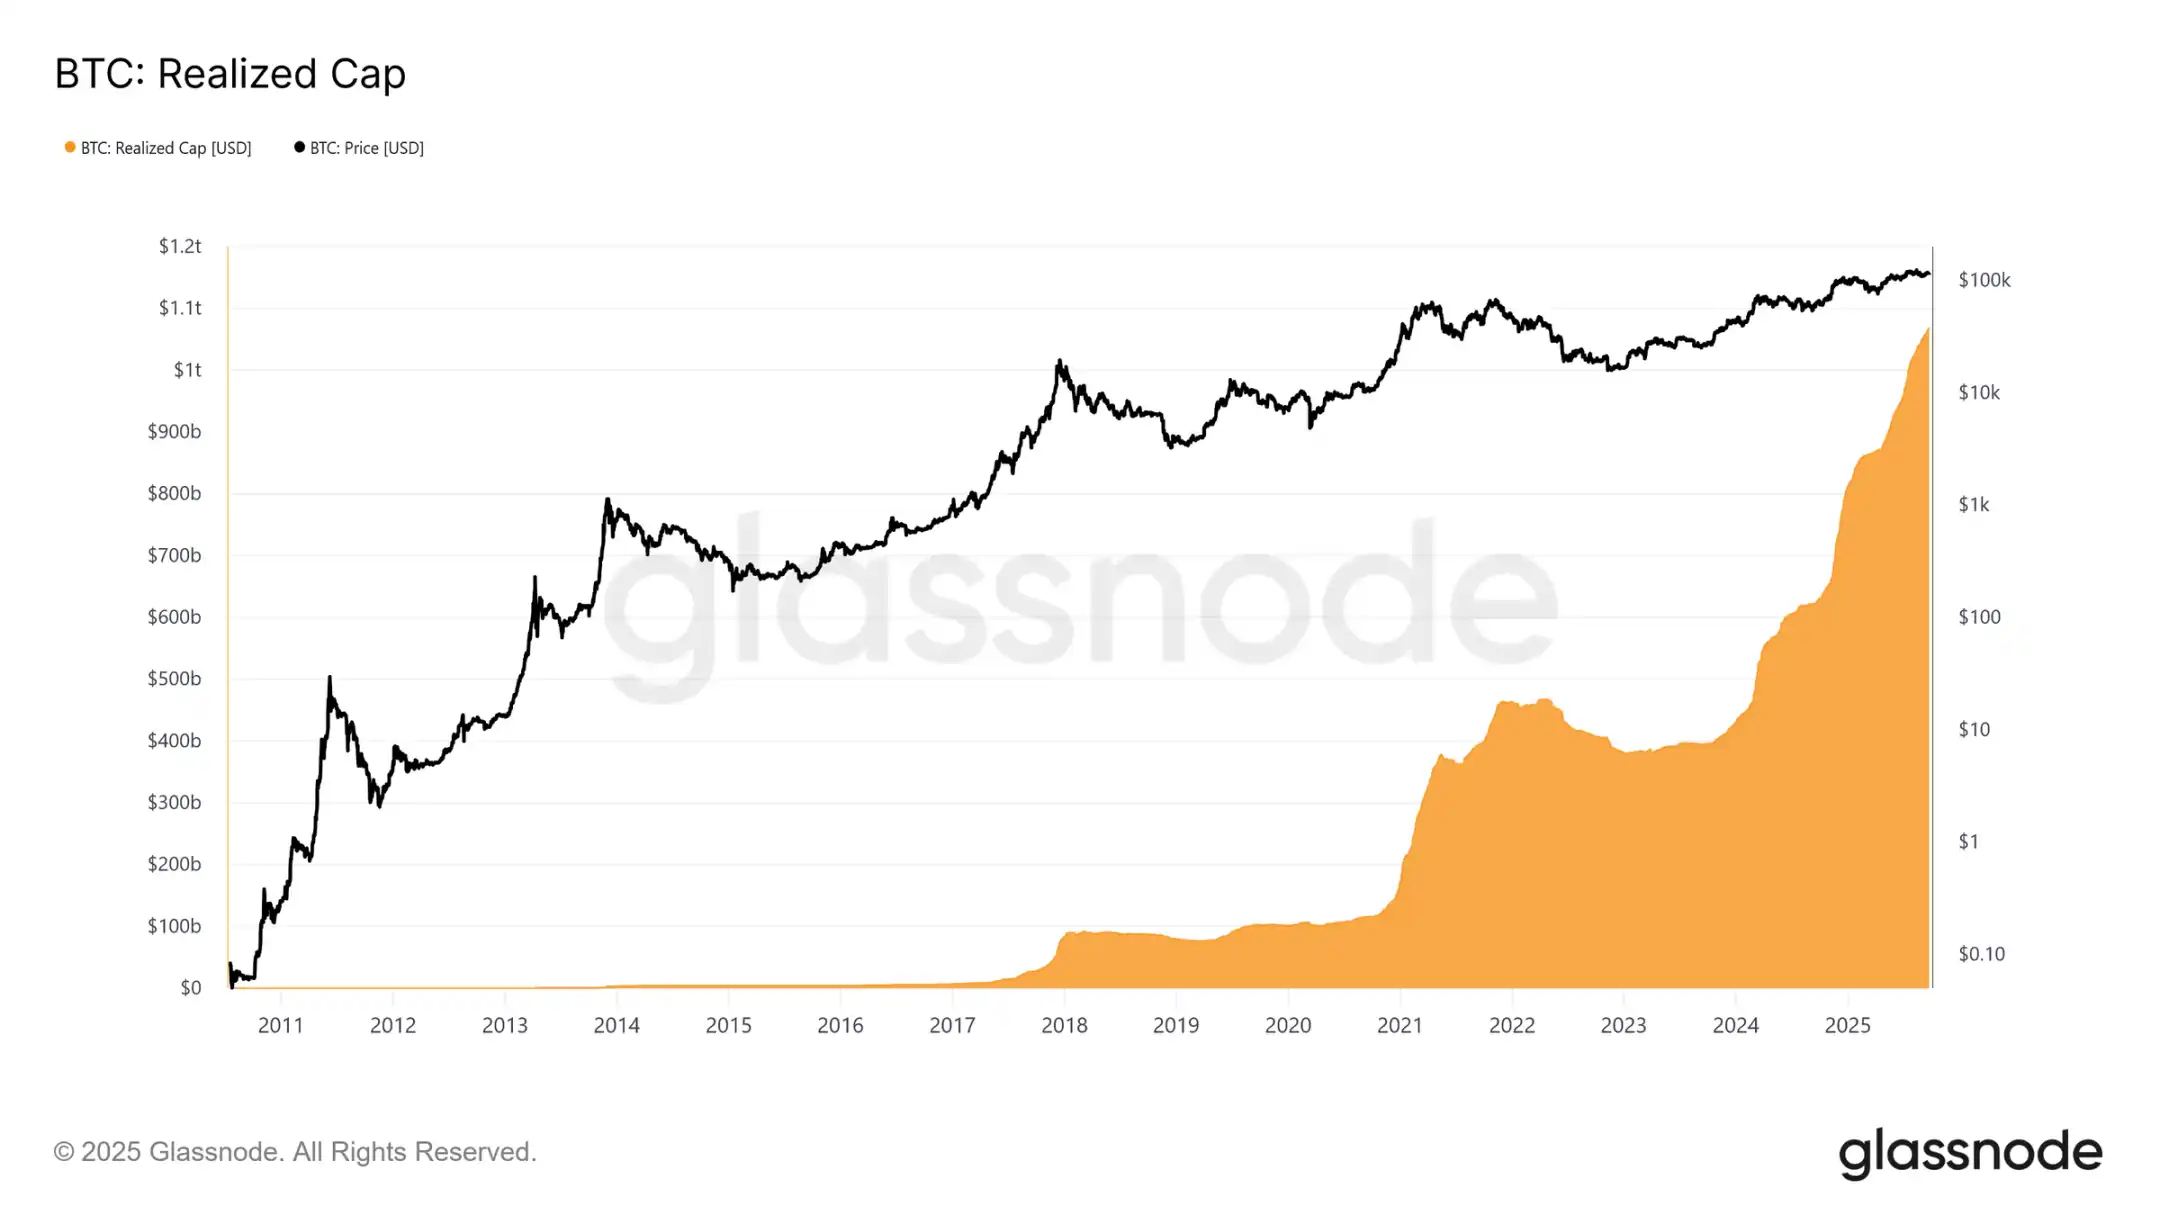
已实现市值增长
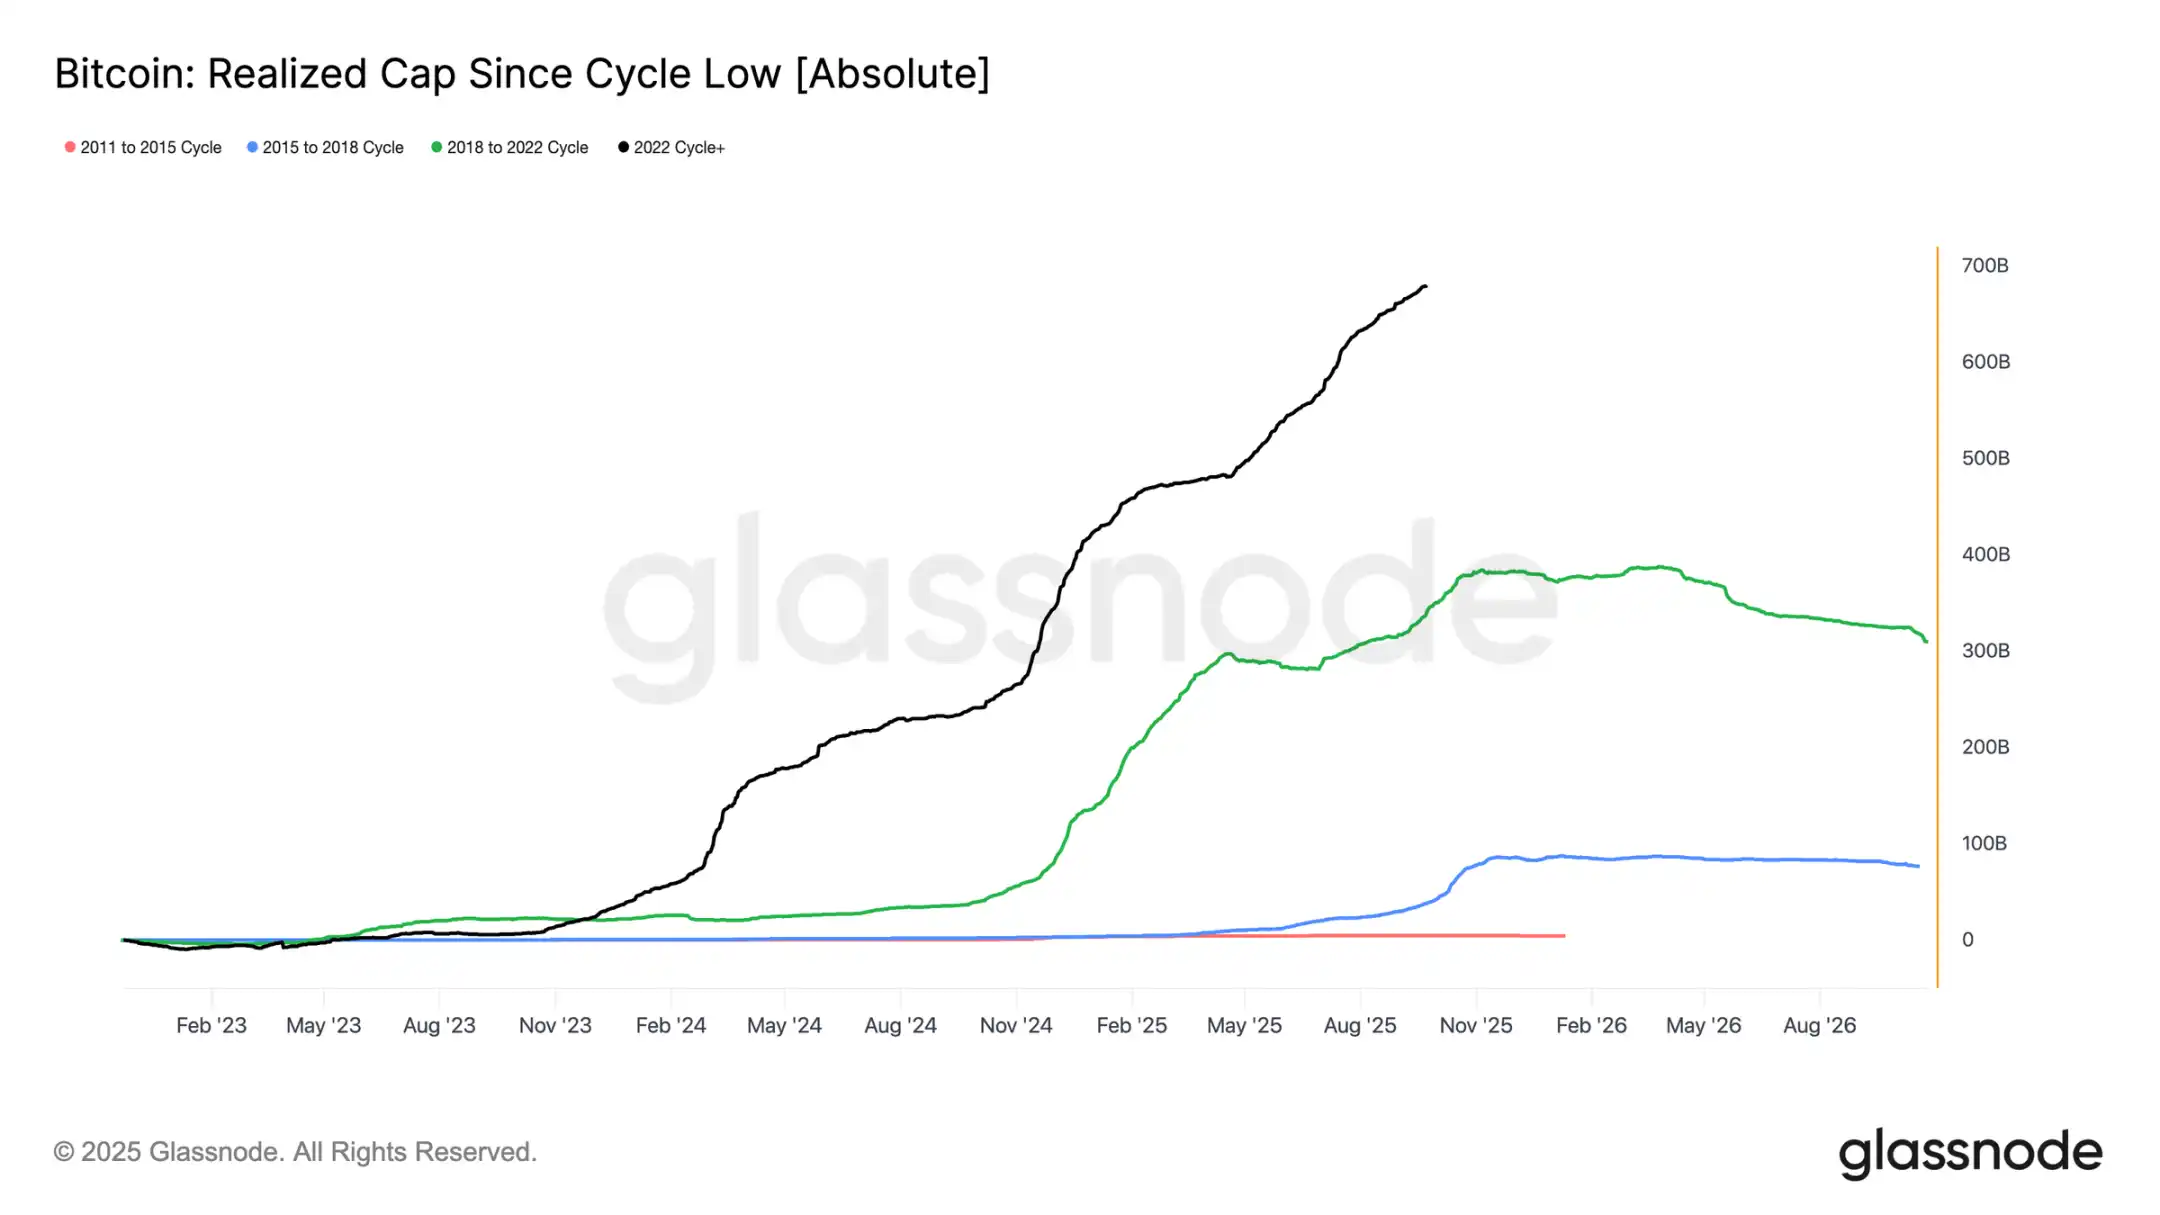
背景对比:
· 2011–2015: 42 亿美元
· 2015–2018: 850 亿美元
· 2018–2022: 3830 亿美元
· 2022–至今: 6780 亿美元
本周期已经吸收了 6780 亿美元的净流入,几乎是前一个周期的 1.8 倍,突显了其资本轮换的空前规模
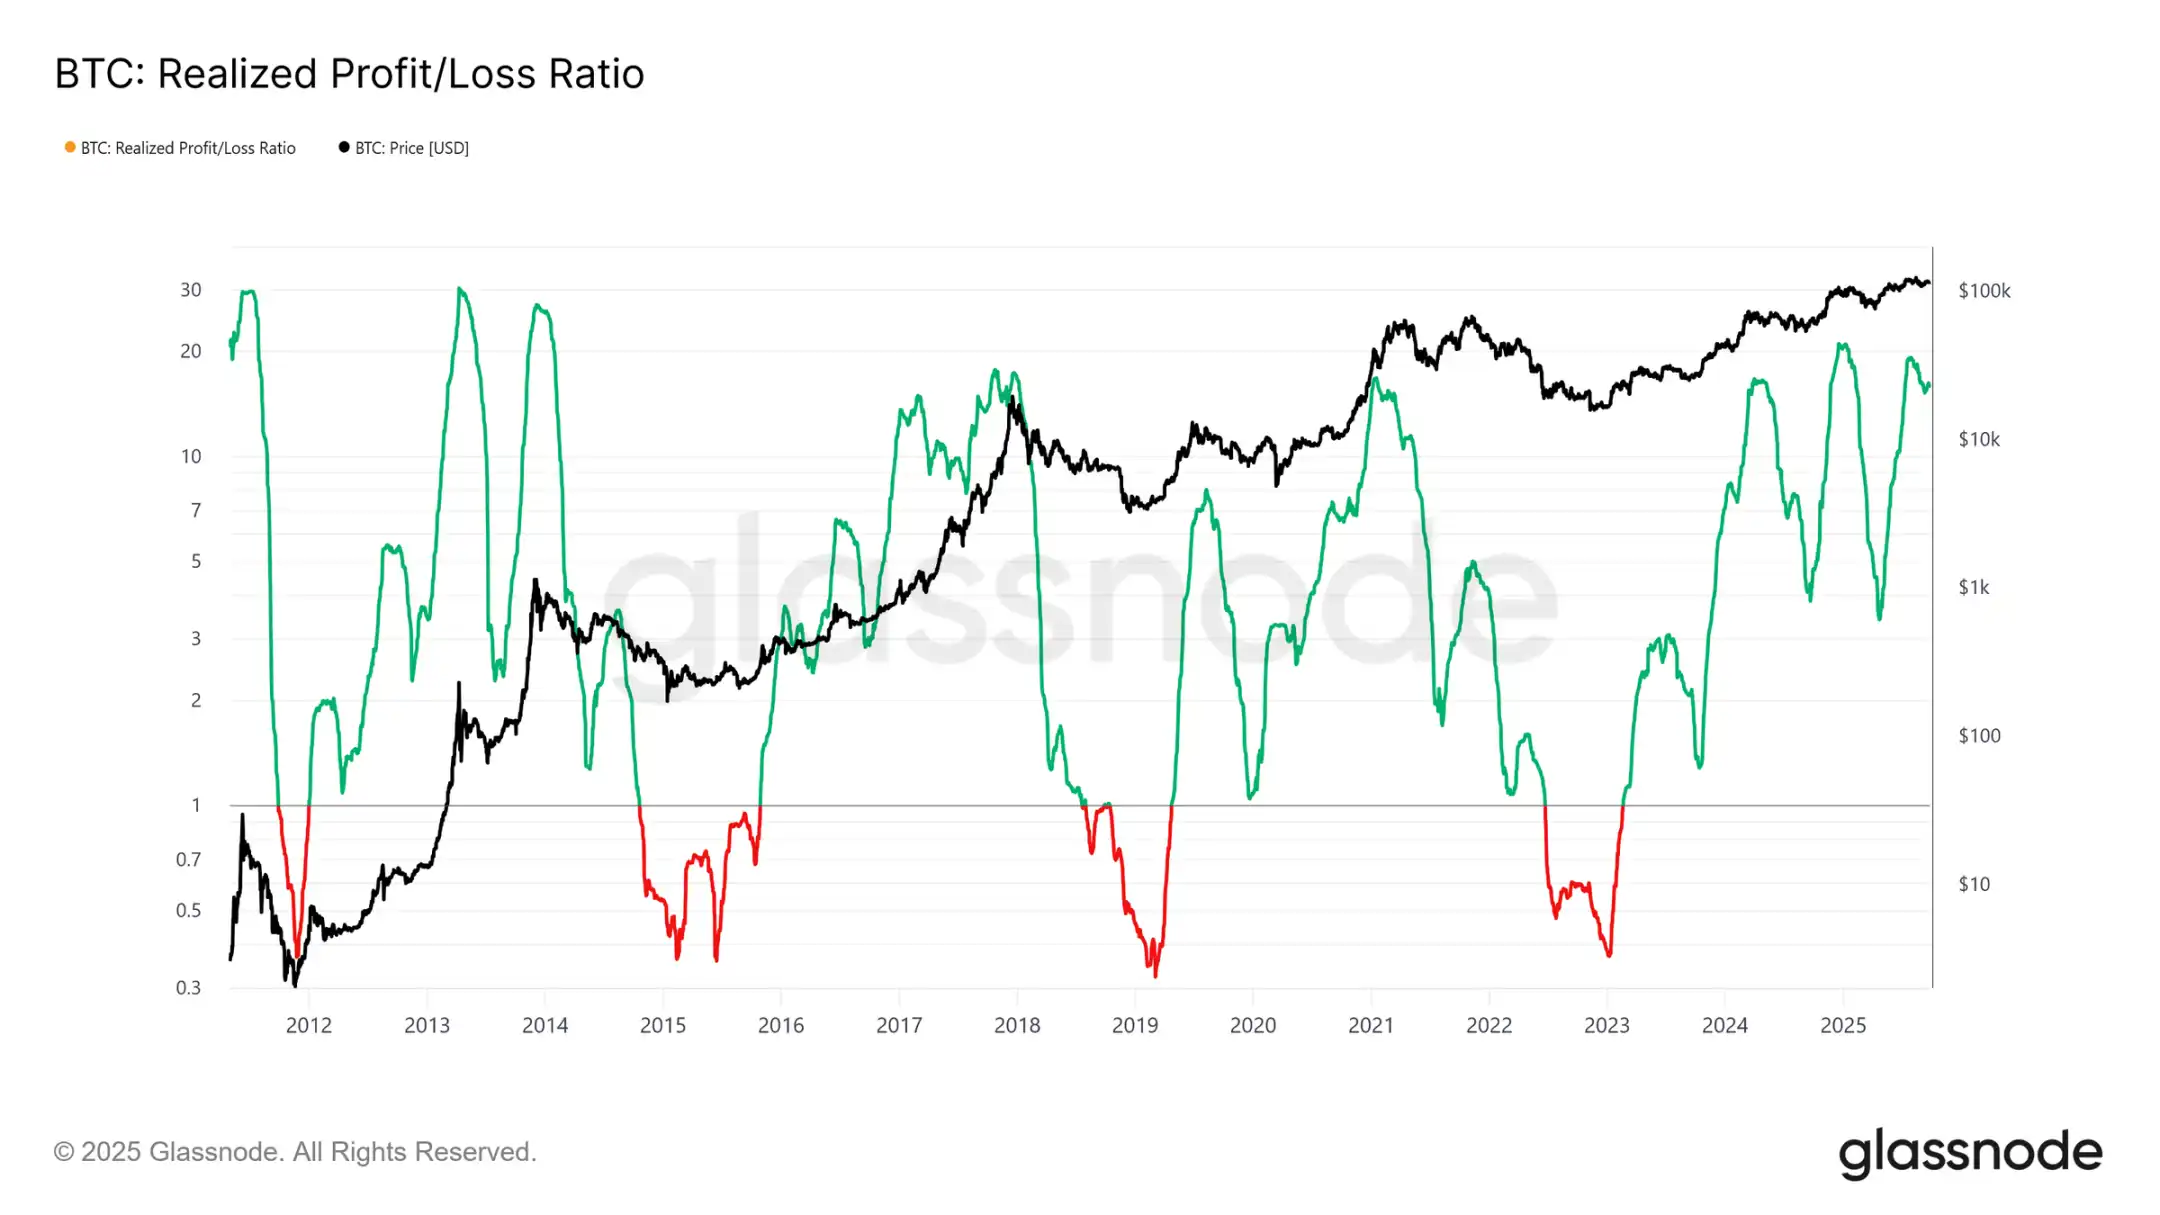
利润实现峰值
另一个不同之处在于流入结构。与早期周期单一的浪潮不同,本周期出现了三次明显的、持续数月的激增。已实现盈亏比率显示,每次利润实现超过移动代币的 90% 时,都标志着周期性峰值。刚刚脱离第三次此类极端情况后,概率倾向于接下来将出现降温阶段。
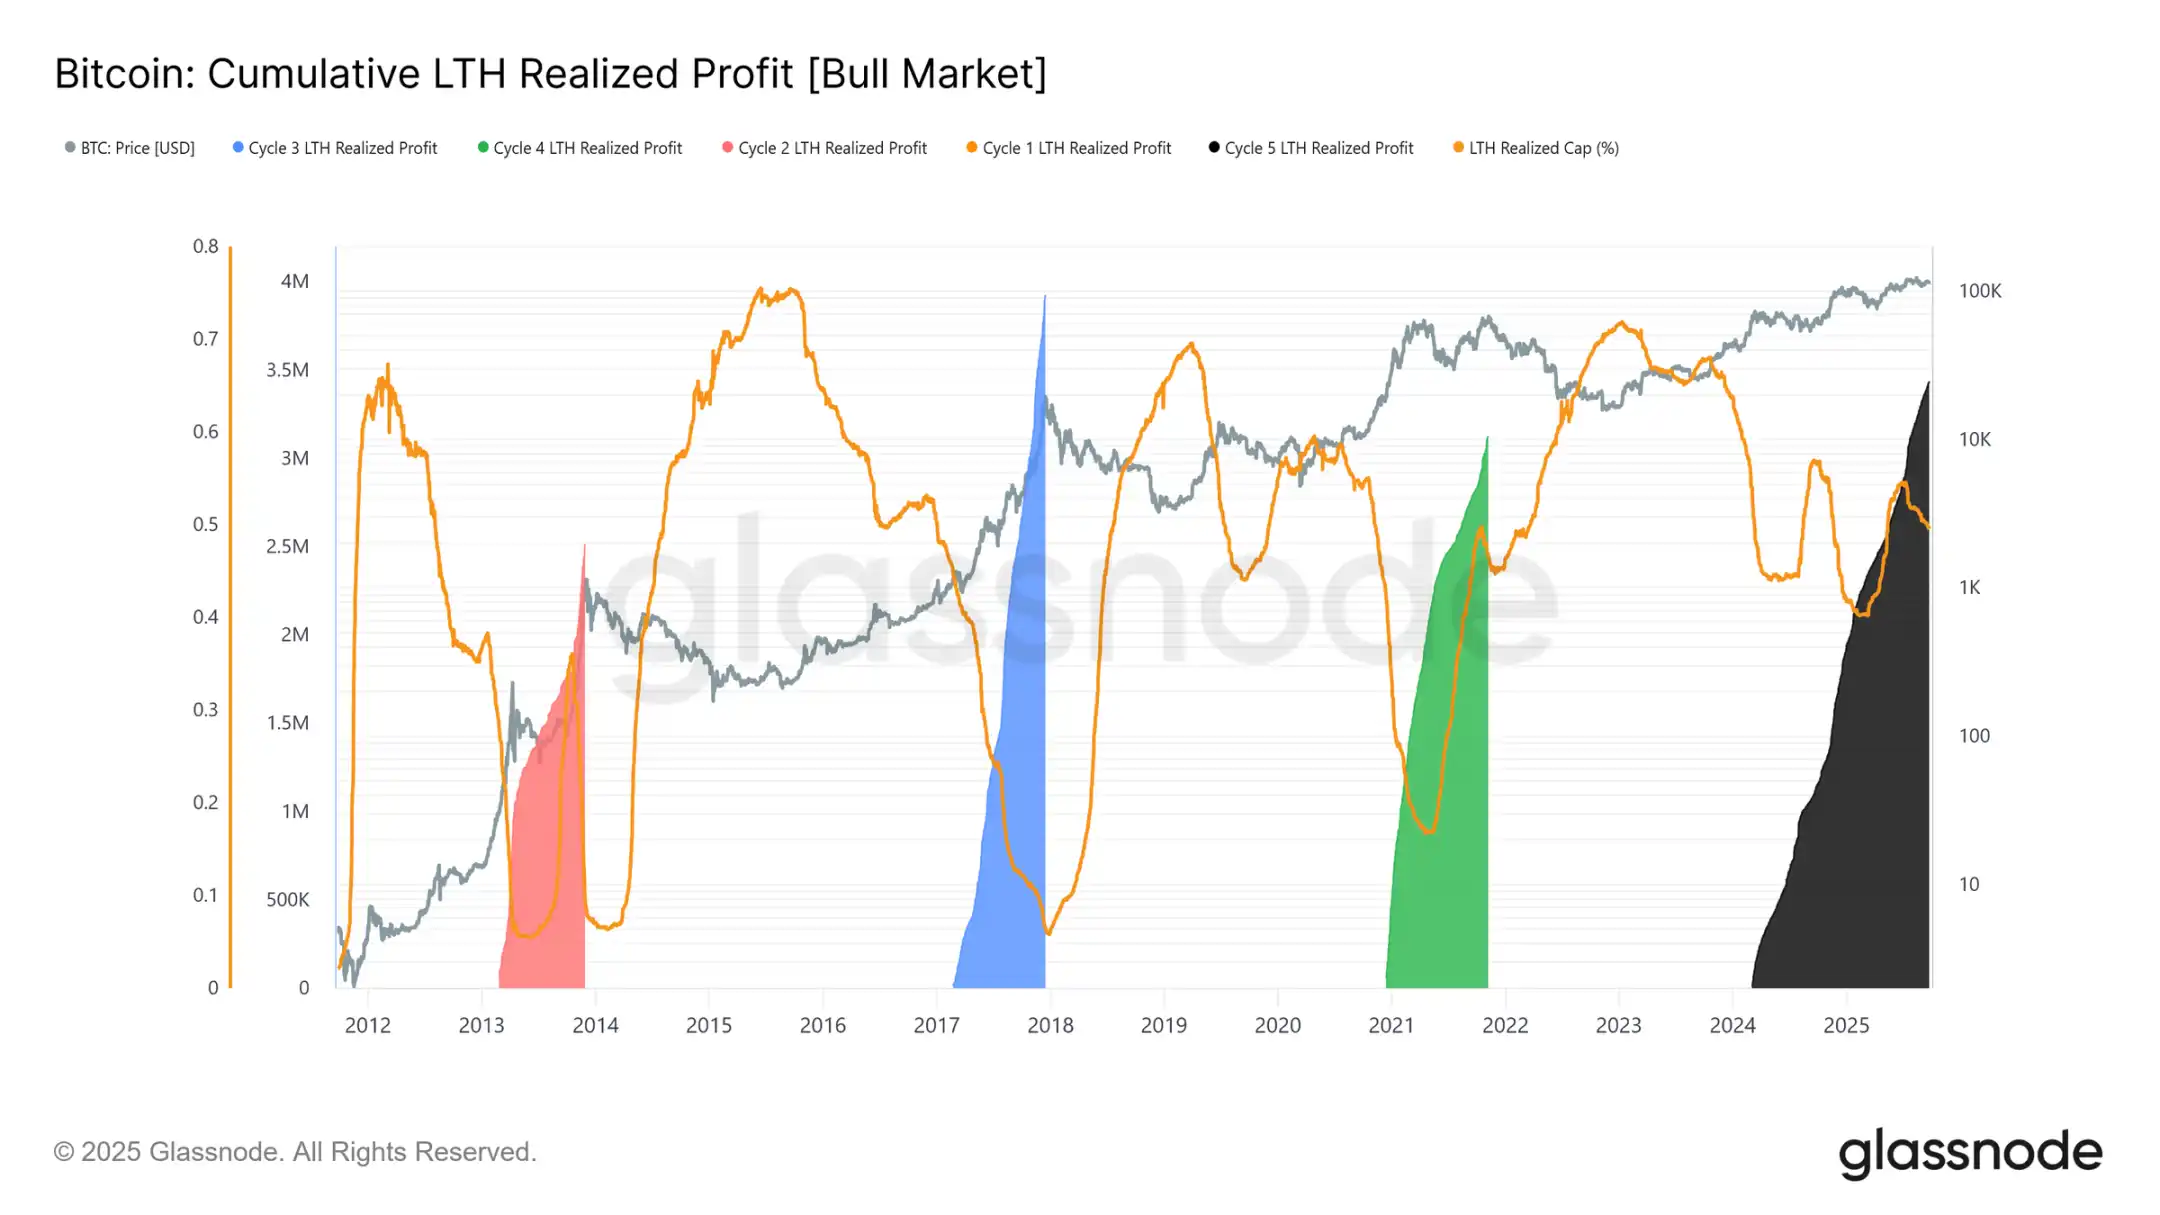
长期持有者利润主导地位
关注长期持有者时,规模更加清晰。该指标跟踪从新的历史高点(ATH)到周期峰值期间长期持有者的累计利润。历史上,他们的大量抛售标志着顶部。在本周期中,长期持有者已实现 340 万 BTC 的利润,已经超过之前的周期,突显了该群体的成熟度以及资本轮换的规模。
链下分析
ETF 需求 vs 长期持有者
本周期也受到长期持有者抛售供应与通过美国现货 ETF 和 DATs 的机构需求之间拉锯战。随着 ETF 成为新的结构性力量,价格现在反映了这种推拉效应:长期持有者的获利了结限制了上行空间,而 ETF 流入则吸收了抛售并维持了周期的进展。
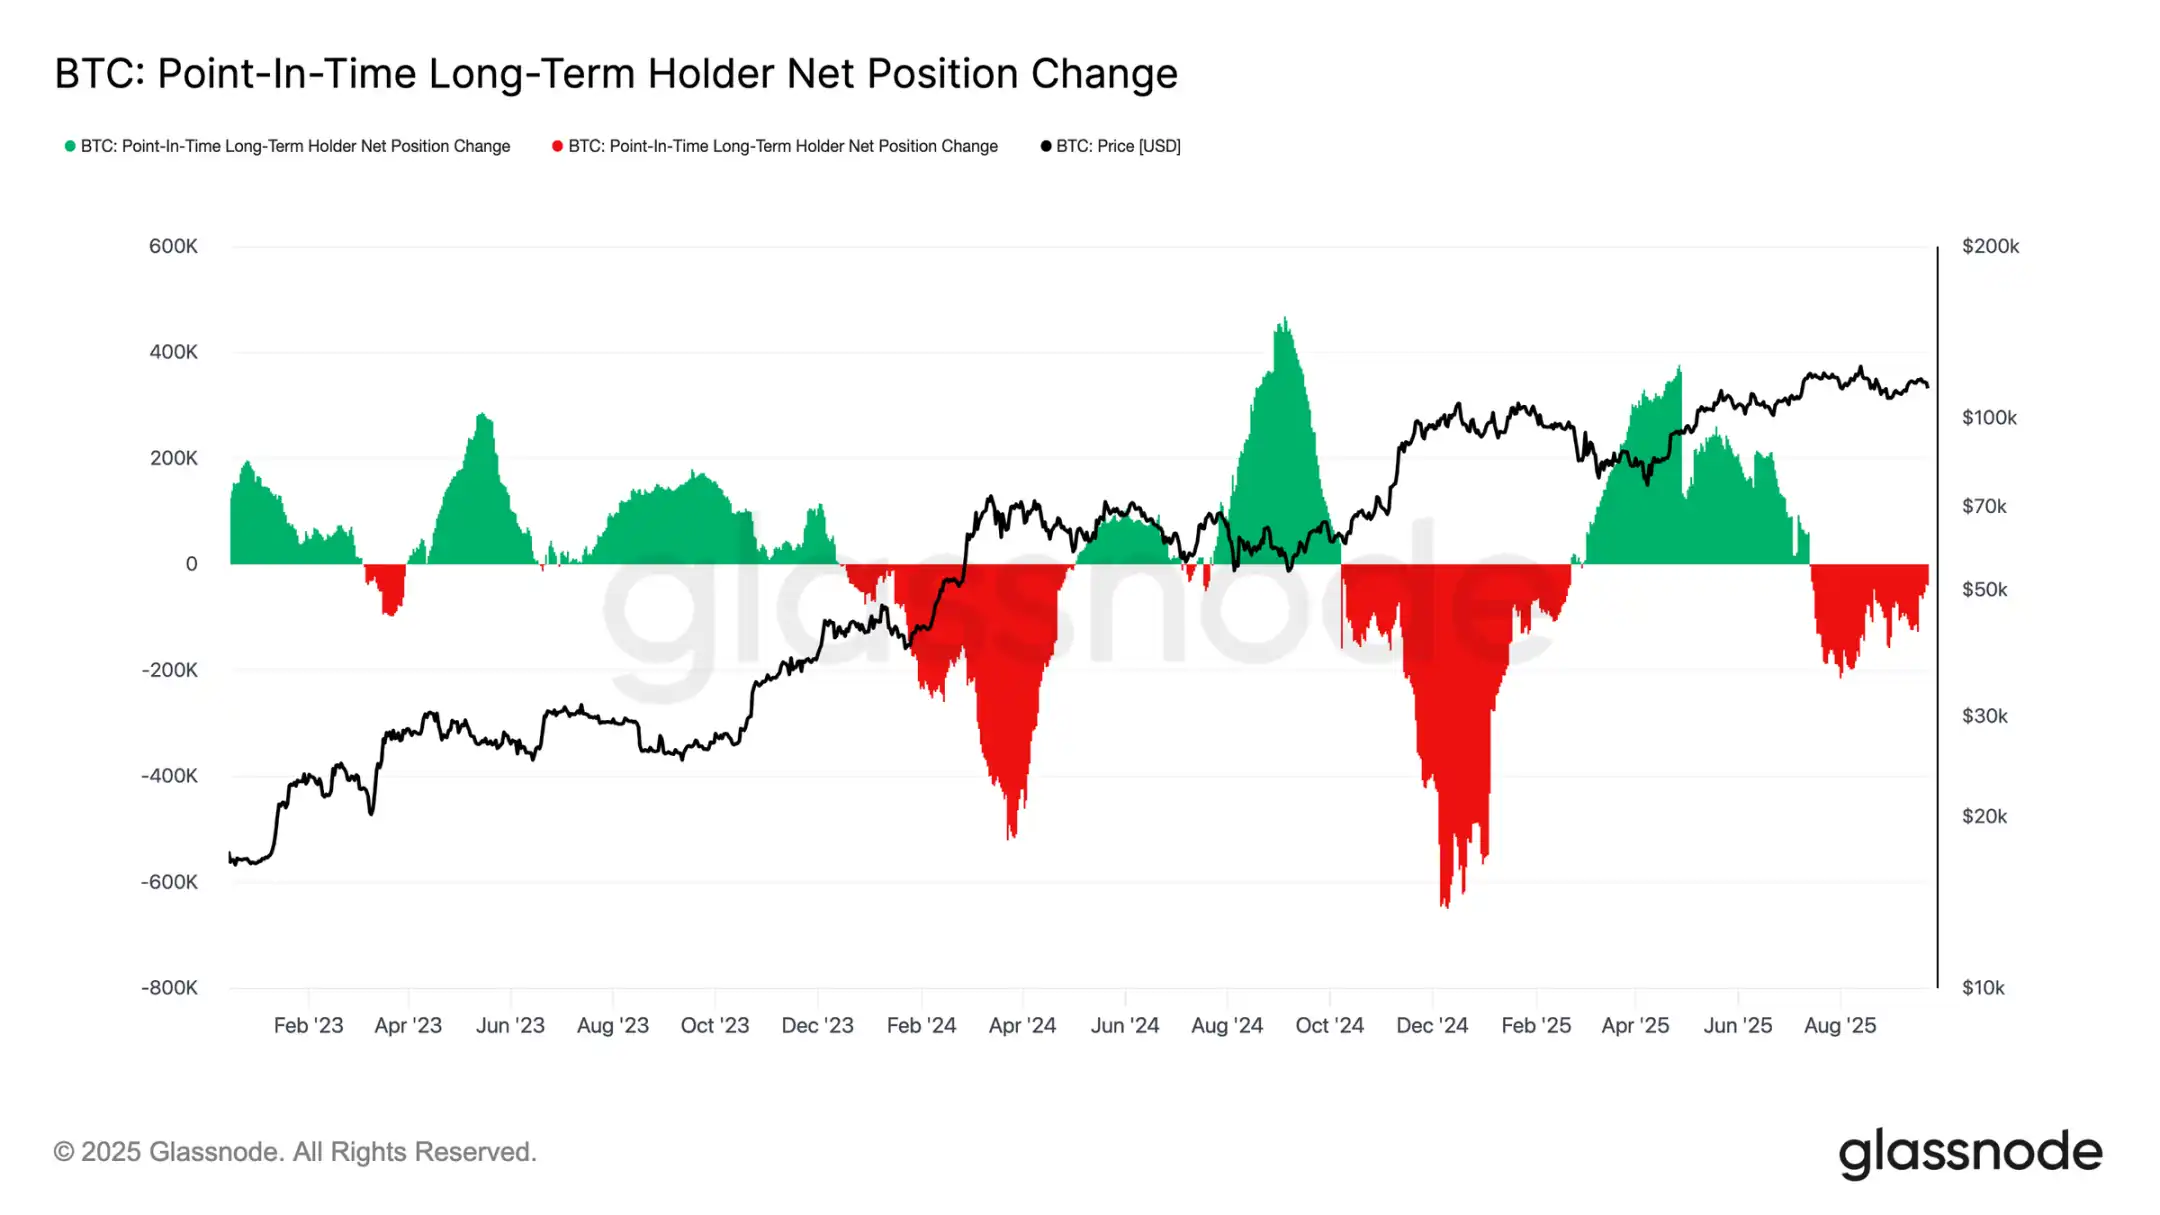
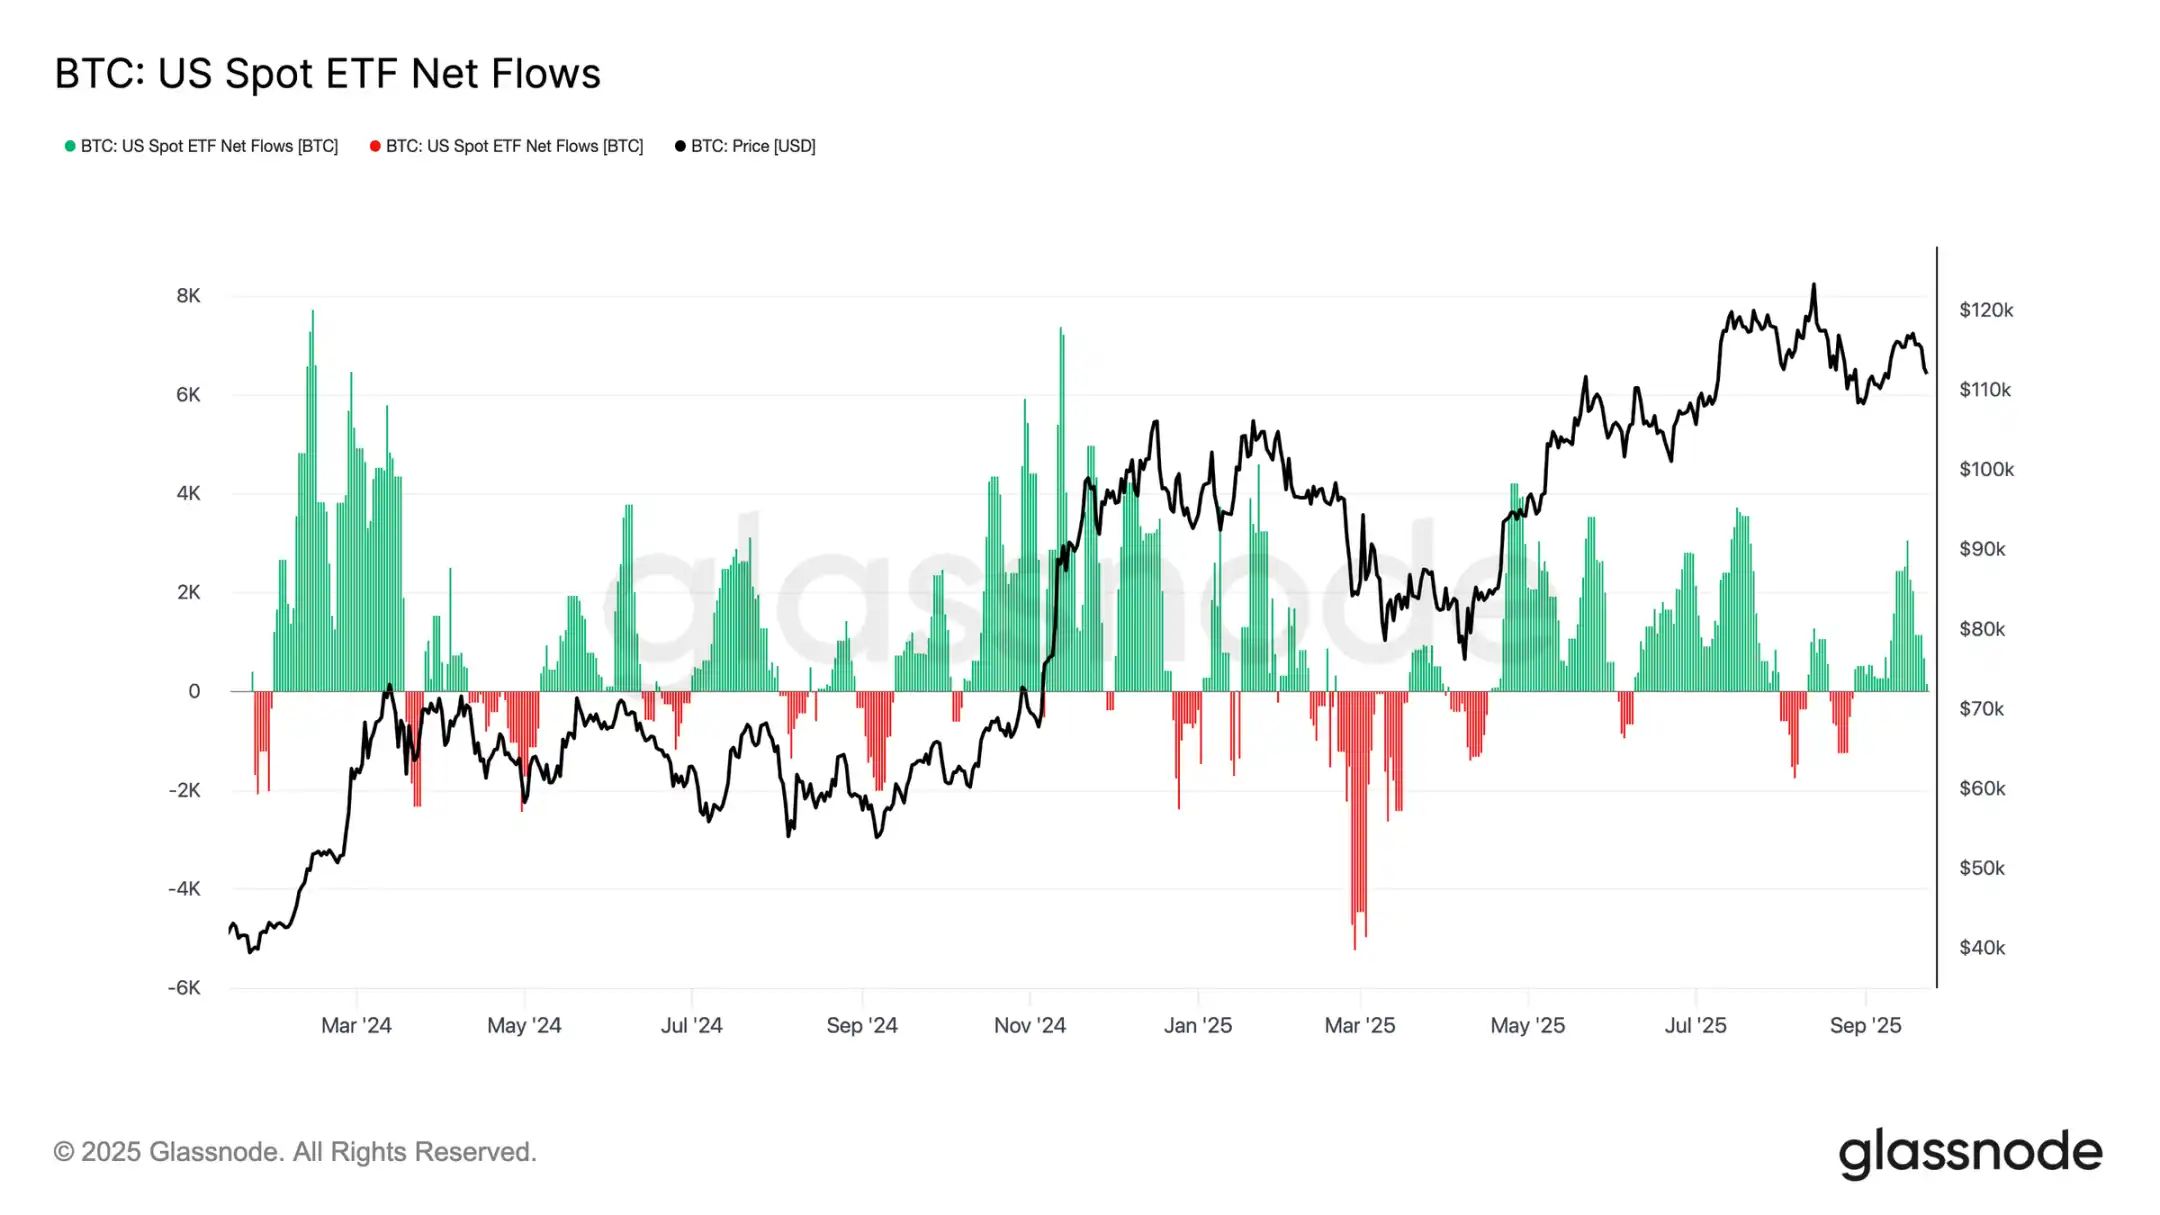
脆弱平衡
ETF 流入迄今为止平衡了长期持有者的卖出,但误差边际很小。在 FOMC 会议前后,长期持有者抛售飙升至 12.2 万 BTC/ 月,而 ETF 净流入从 2600 BTC/ 天暴跌至接近零。抛售压力增加和机构需求减弱的结合创造了脆弱的背景,为疲软埋下了伏笔。
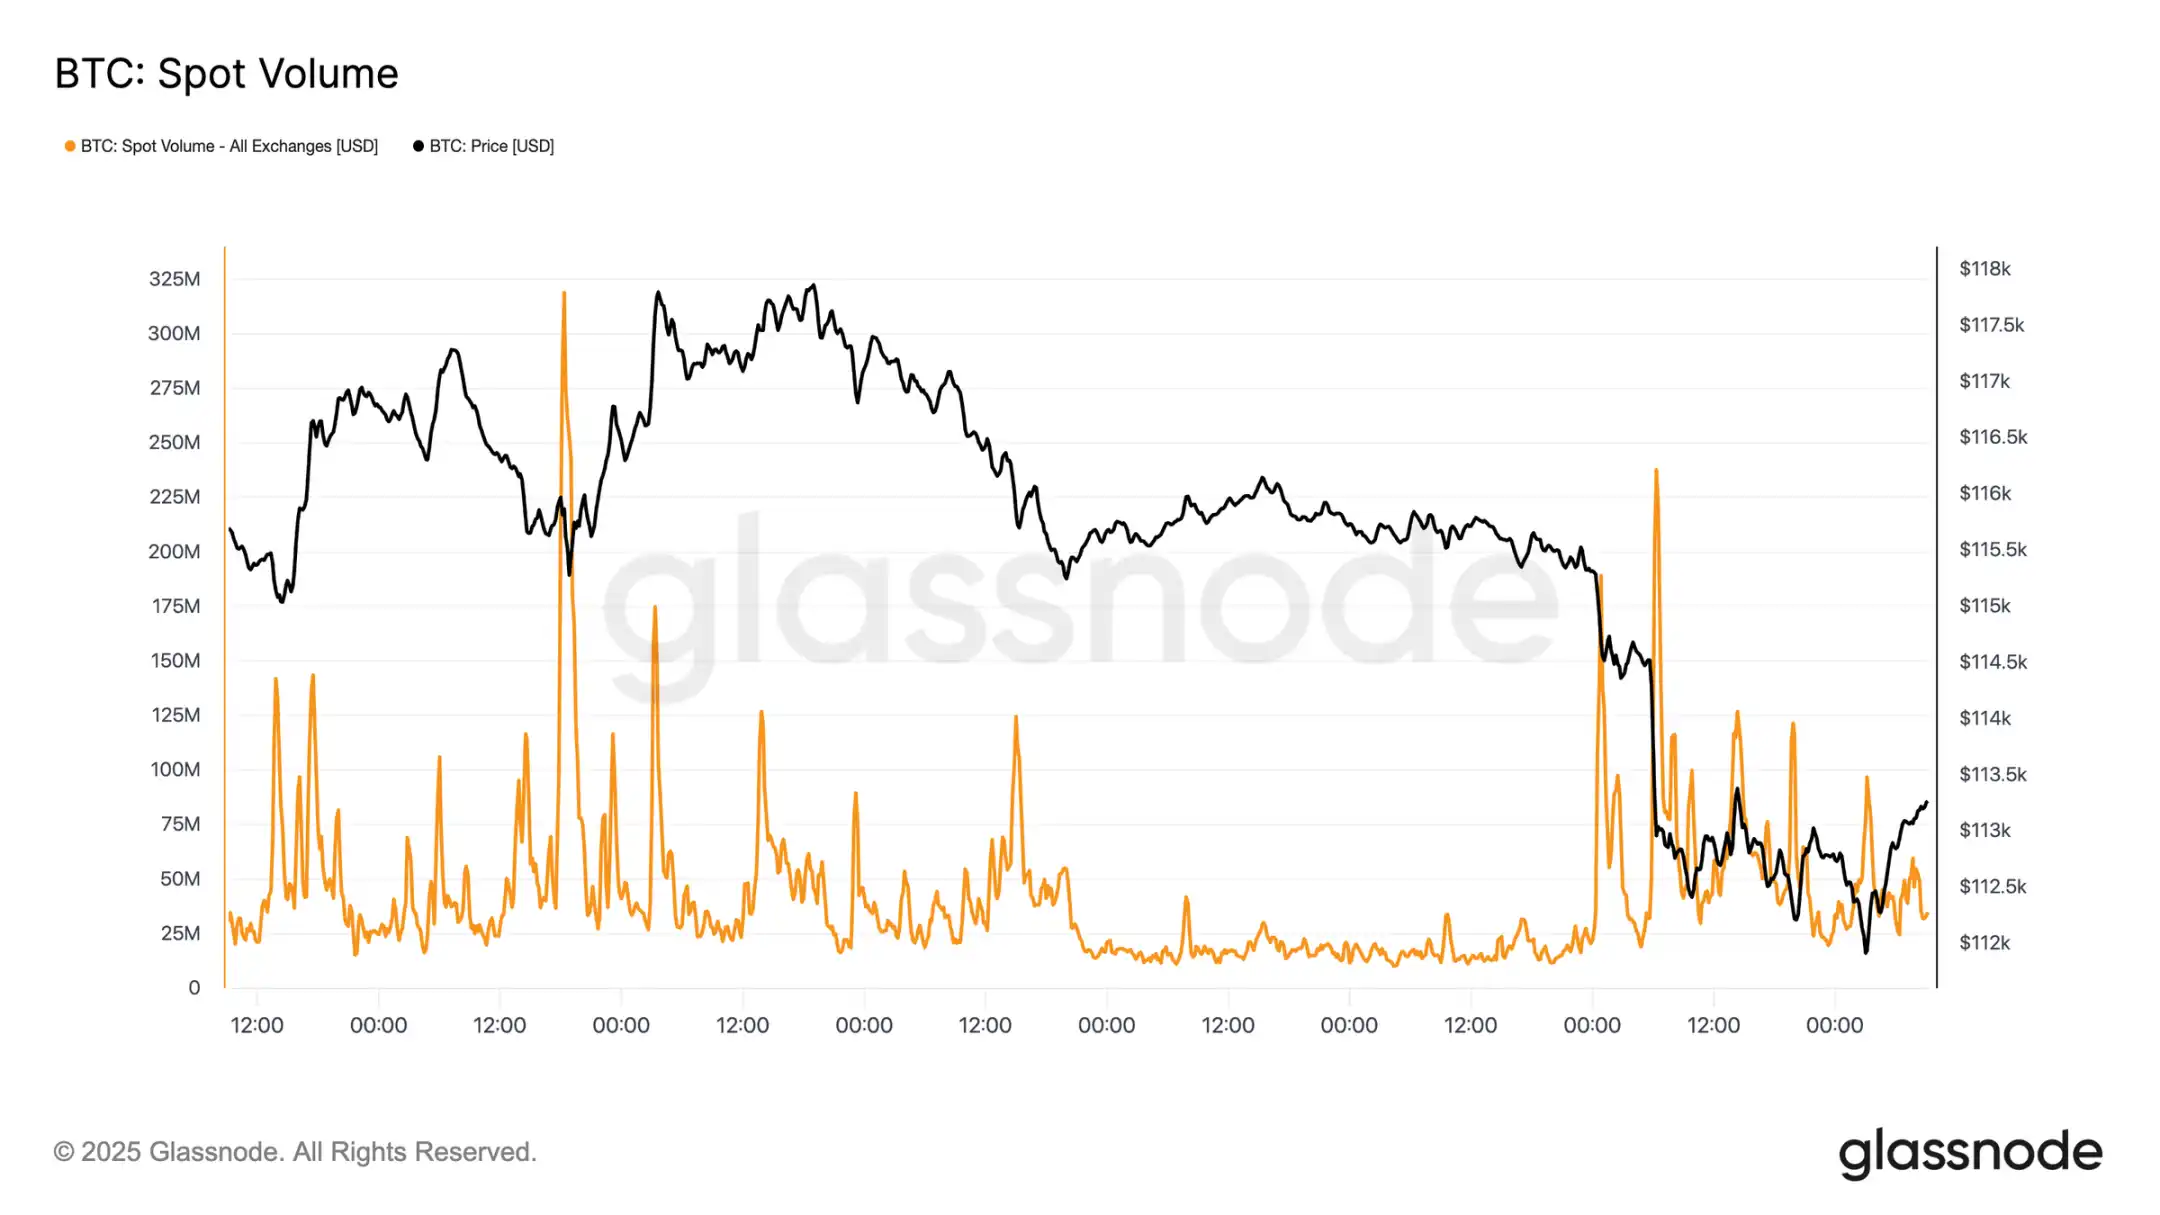
现货市场压力
这种脆弱性在现货市场中可见一斑。在 FOMC 会议后的抛售中,成交量激增,因为强制清算和稀薄的流动性放大了下跌走势。虽然痛苦,但在短期持有者成本基础 11.18 万美元附近形成了暂时的底部。
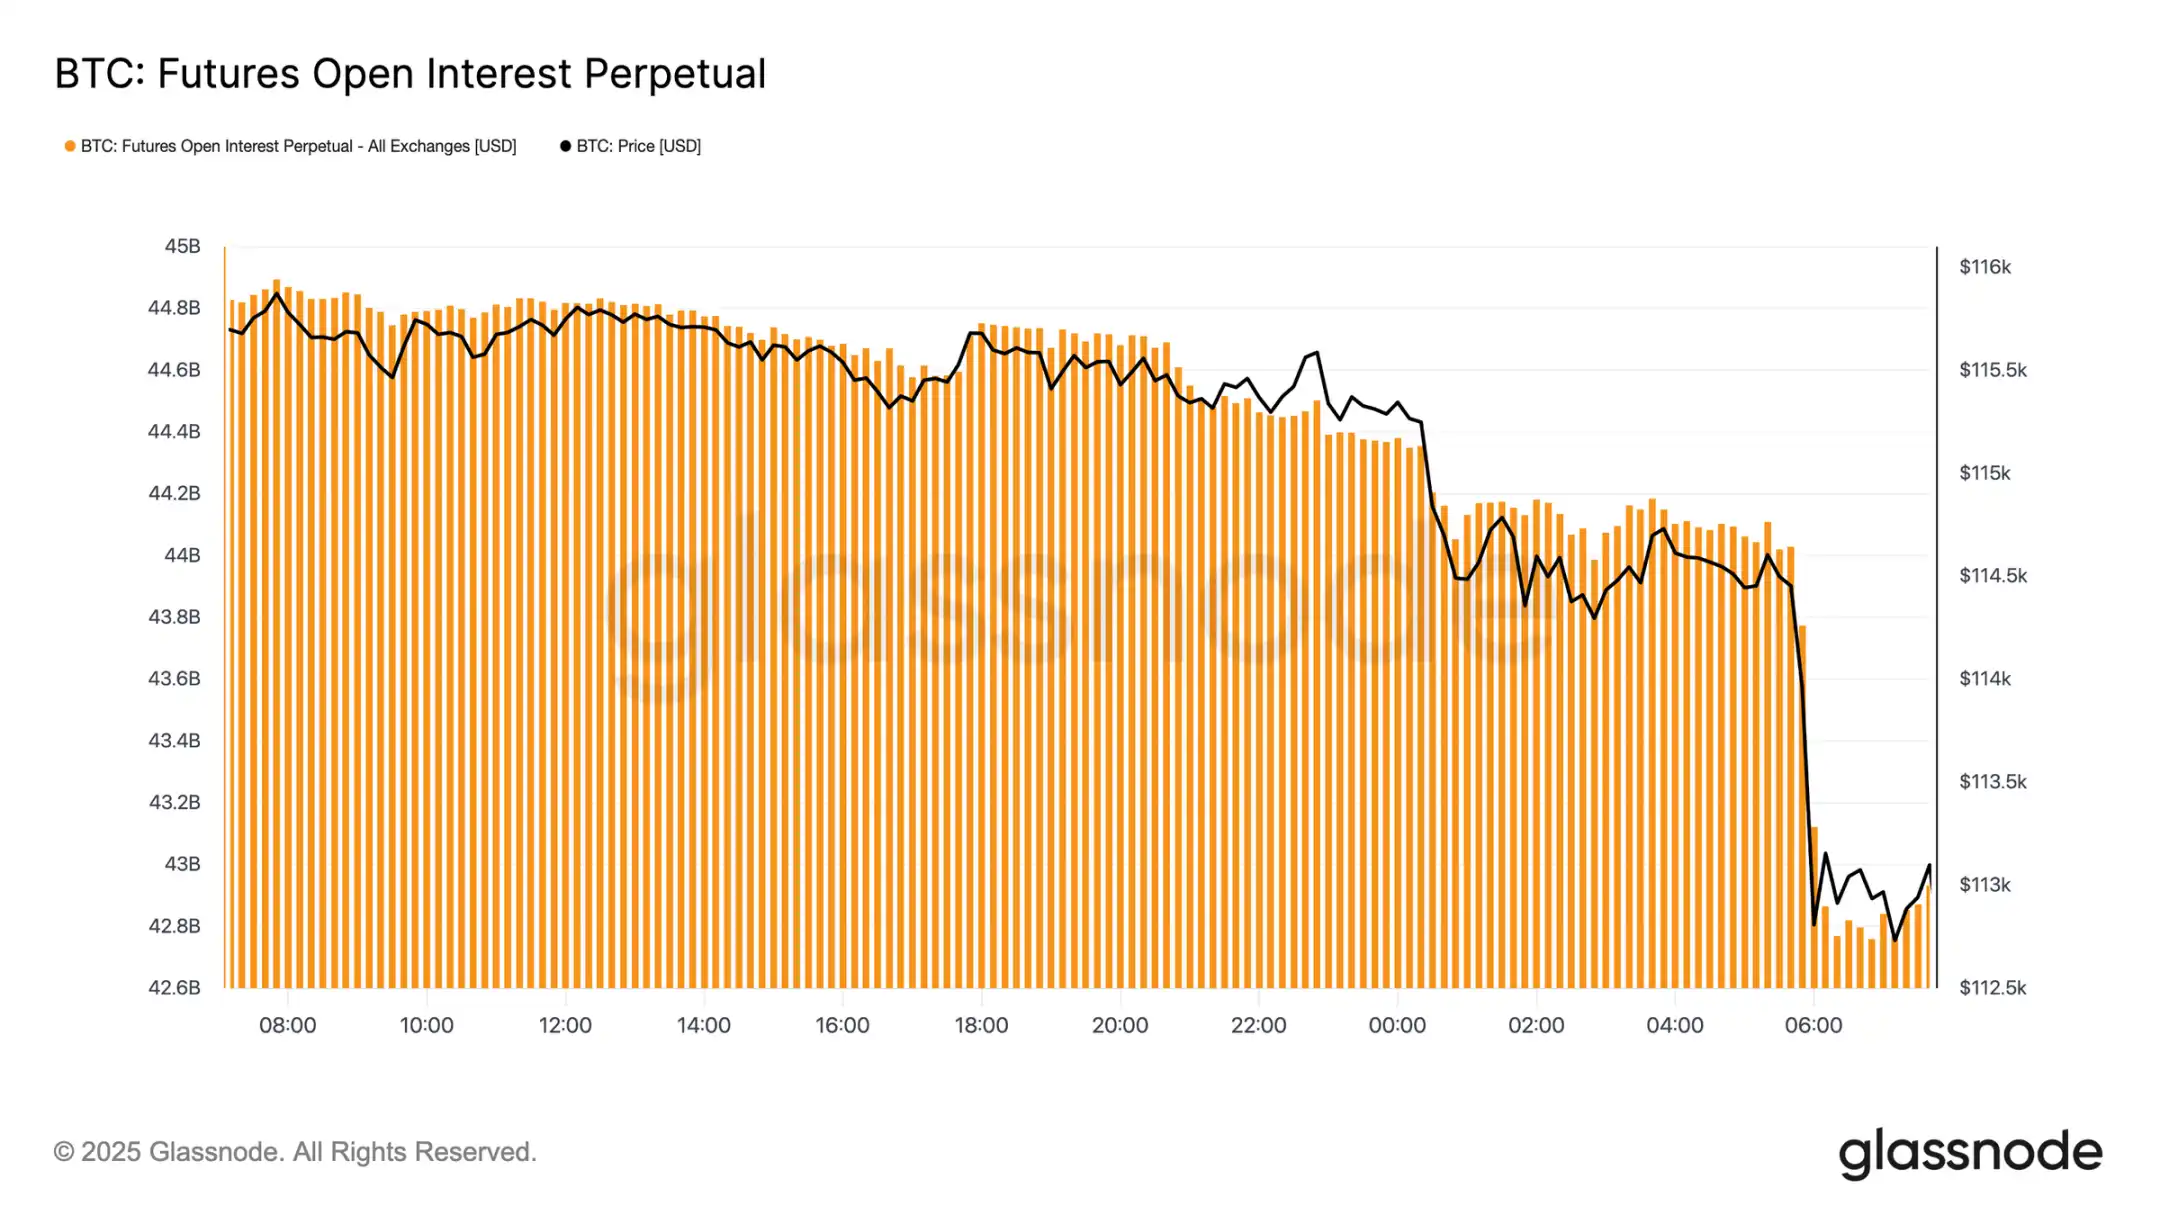
期货去杠杆
与此同时,随着比特币跌破 11.3 万美元,期货未平仓合约从 448 亿美元急剧下降至 427 亿美元。这次去杠杆事件清除了杠杆多头,放大了下行压力。虽然当下造成不稳定,但这次重置有助于清除过剩杠杆并恢复衍生品市场的平衡。
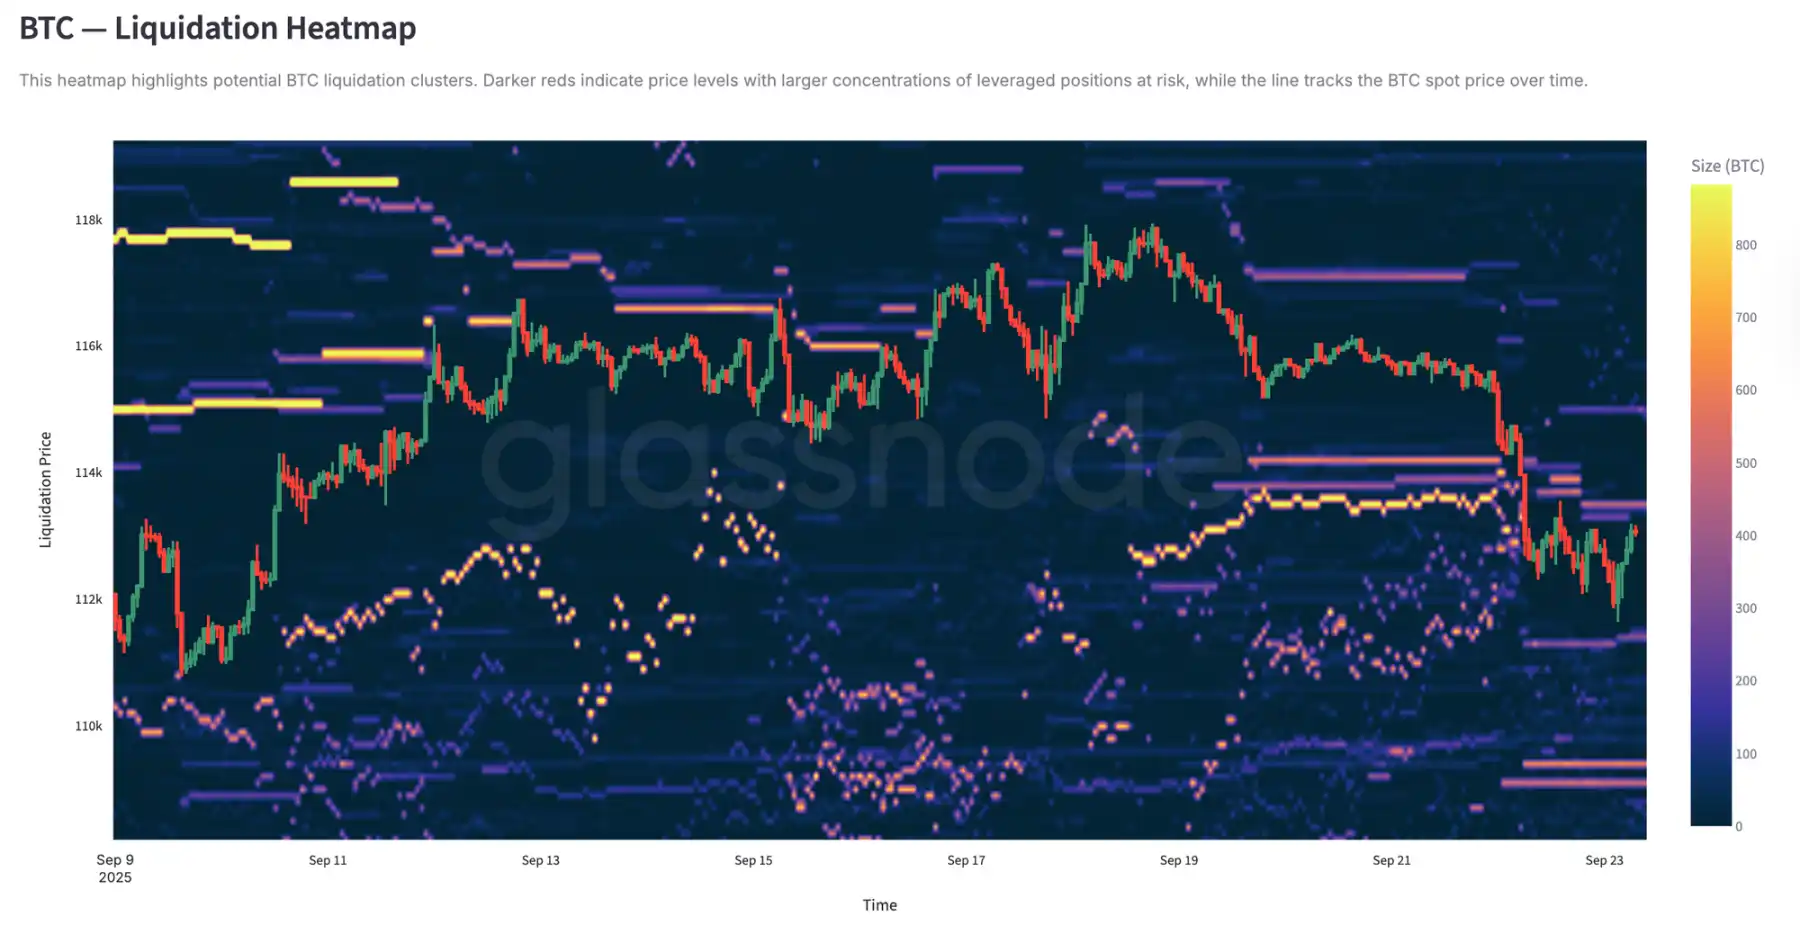
清算集群
永续合约清算热力图提供了更多细节。当价格跌破 11.4 万至 11.2 万美元区间时,密集的杠杆多头集群被清除,导致大量清算并加速下行。风险口袋仍存在于 11.7 万美元上方,使得市场双向都容易受到流动性驱动波动的影响。在没有更强需求的情况下,这些水平附近的脆弱性增加了进一步剧烈波动的风险。
期权市场
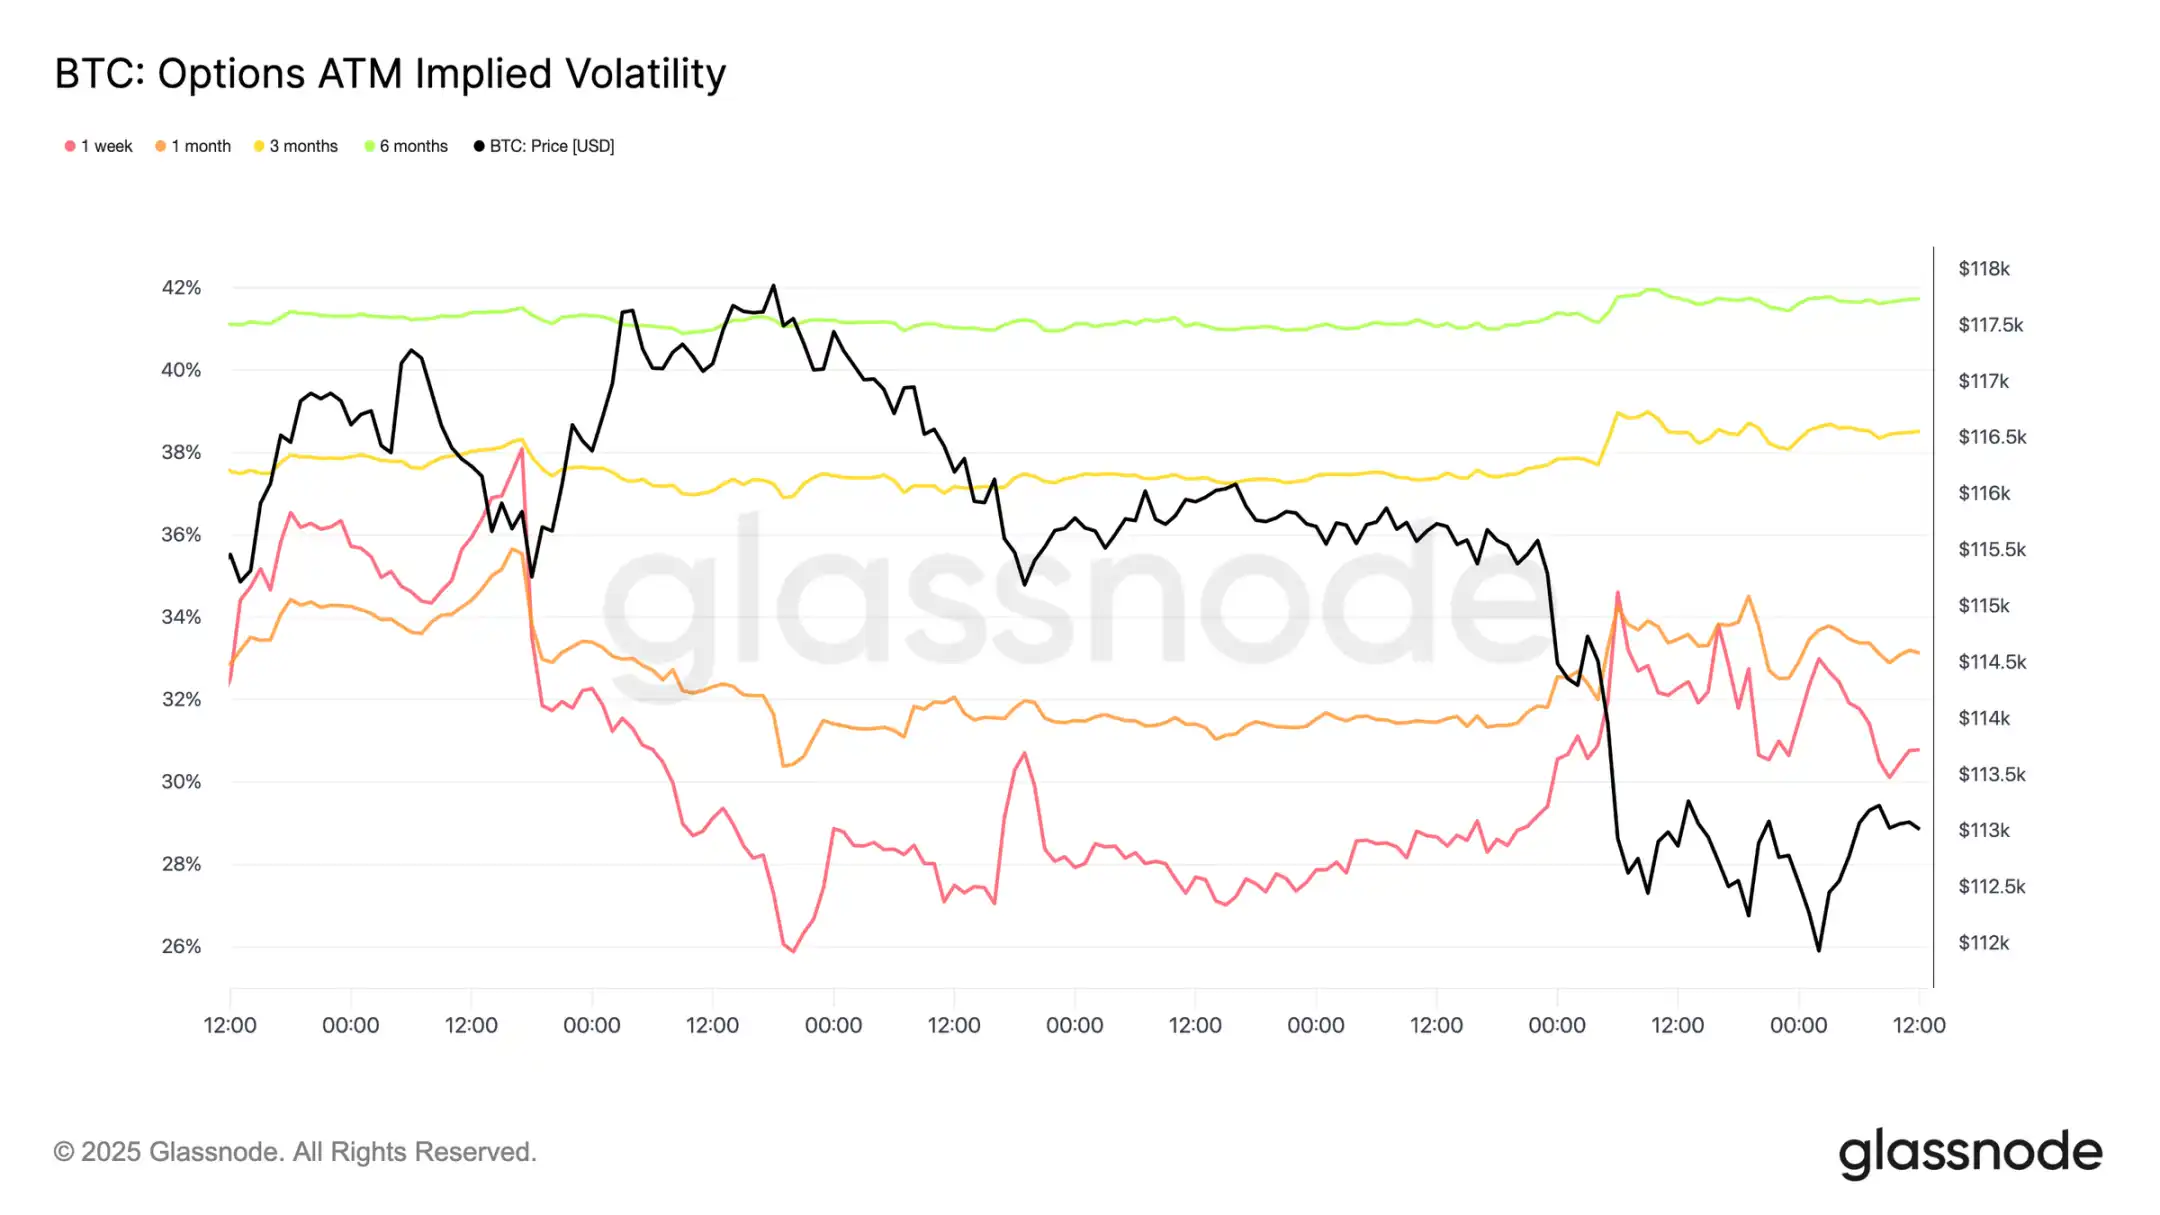
波动率
转向期权市场,隐含波动率为交易员如何度过动荡的一周提供了清晰的视角。两个主要催化剂塑造了市场格局:今年首次降息和自 2021 年以来最大的清算事件。随着对冲需求的建立,波动率在 FOMC 会议前攀升,但在降息确认后迅速消退,表明此举在很大程度上已被定价。然而,周日晚上期货的剧烈清算重新点燃了对保护的需求,一周期隐含波动率引领反弹,且强势延伸至各个期限。
市场重新定价降息
FOMC 会议后,市场对看跌期权存在激进需求,要么作为防范急剧下跌的保护,要么作为利用波动率盈利的方式。仅仅两天后,市场就以自 2021 年以来最大的清算事件兑现了这一信号。
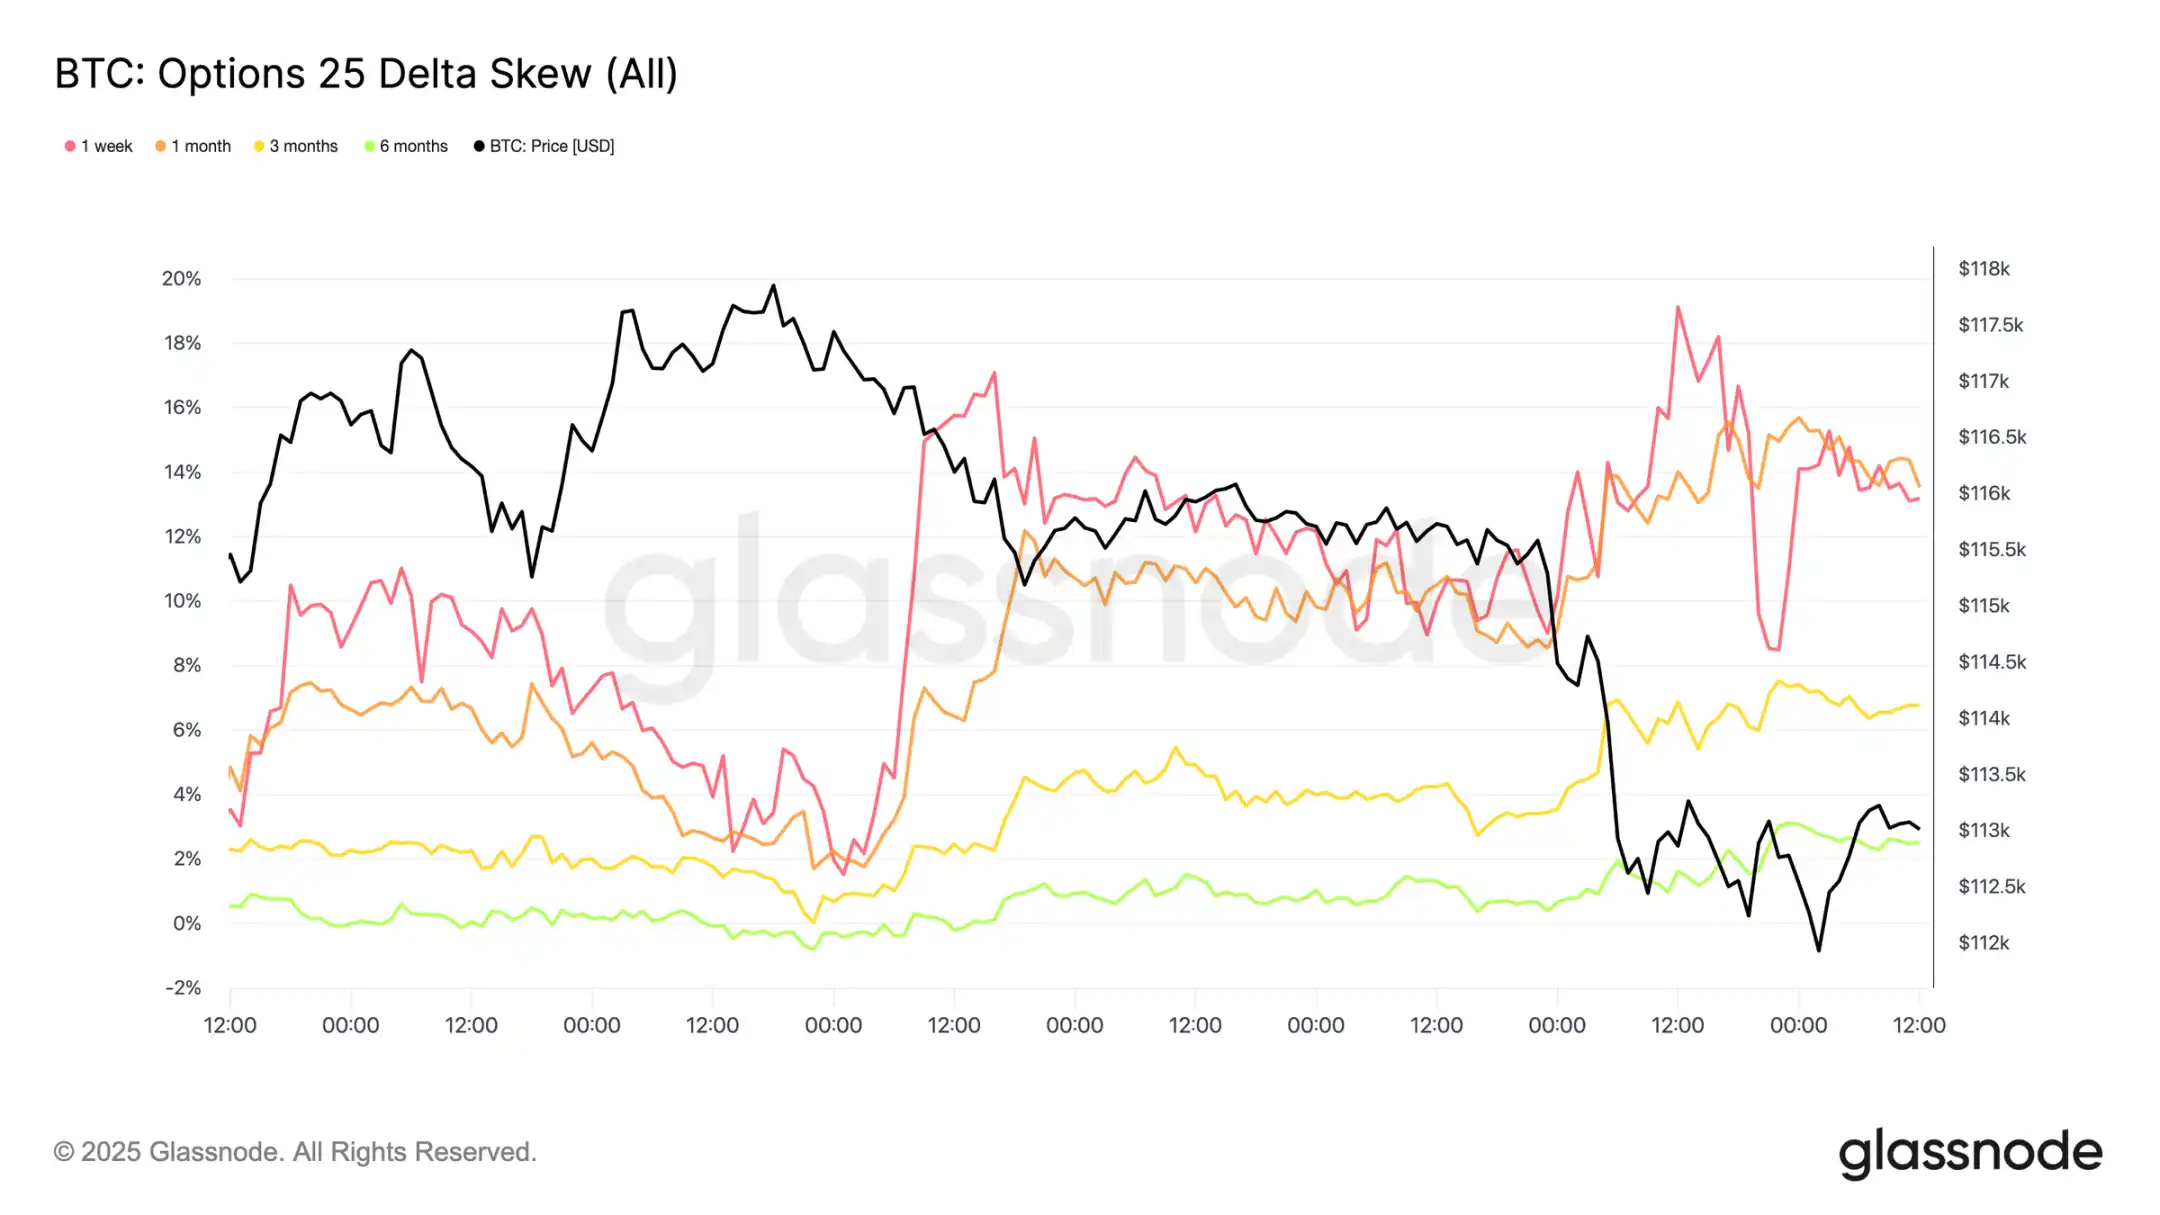
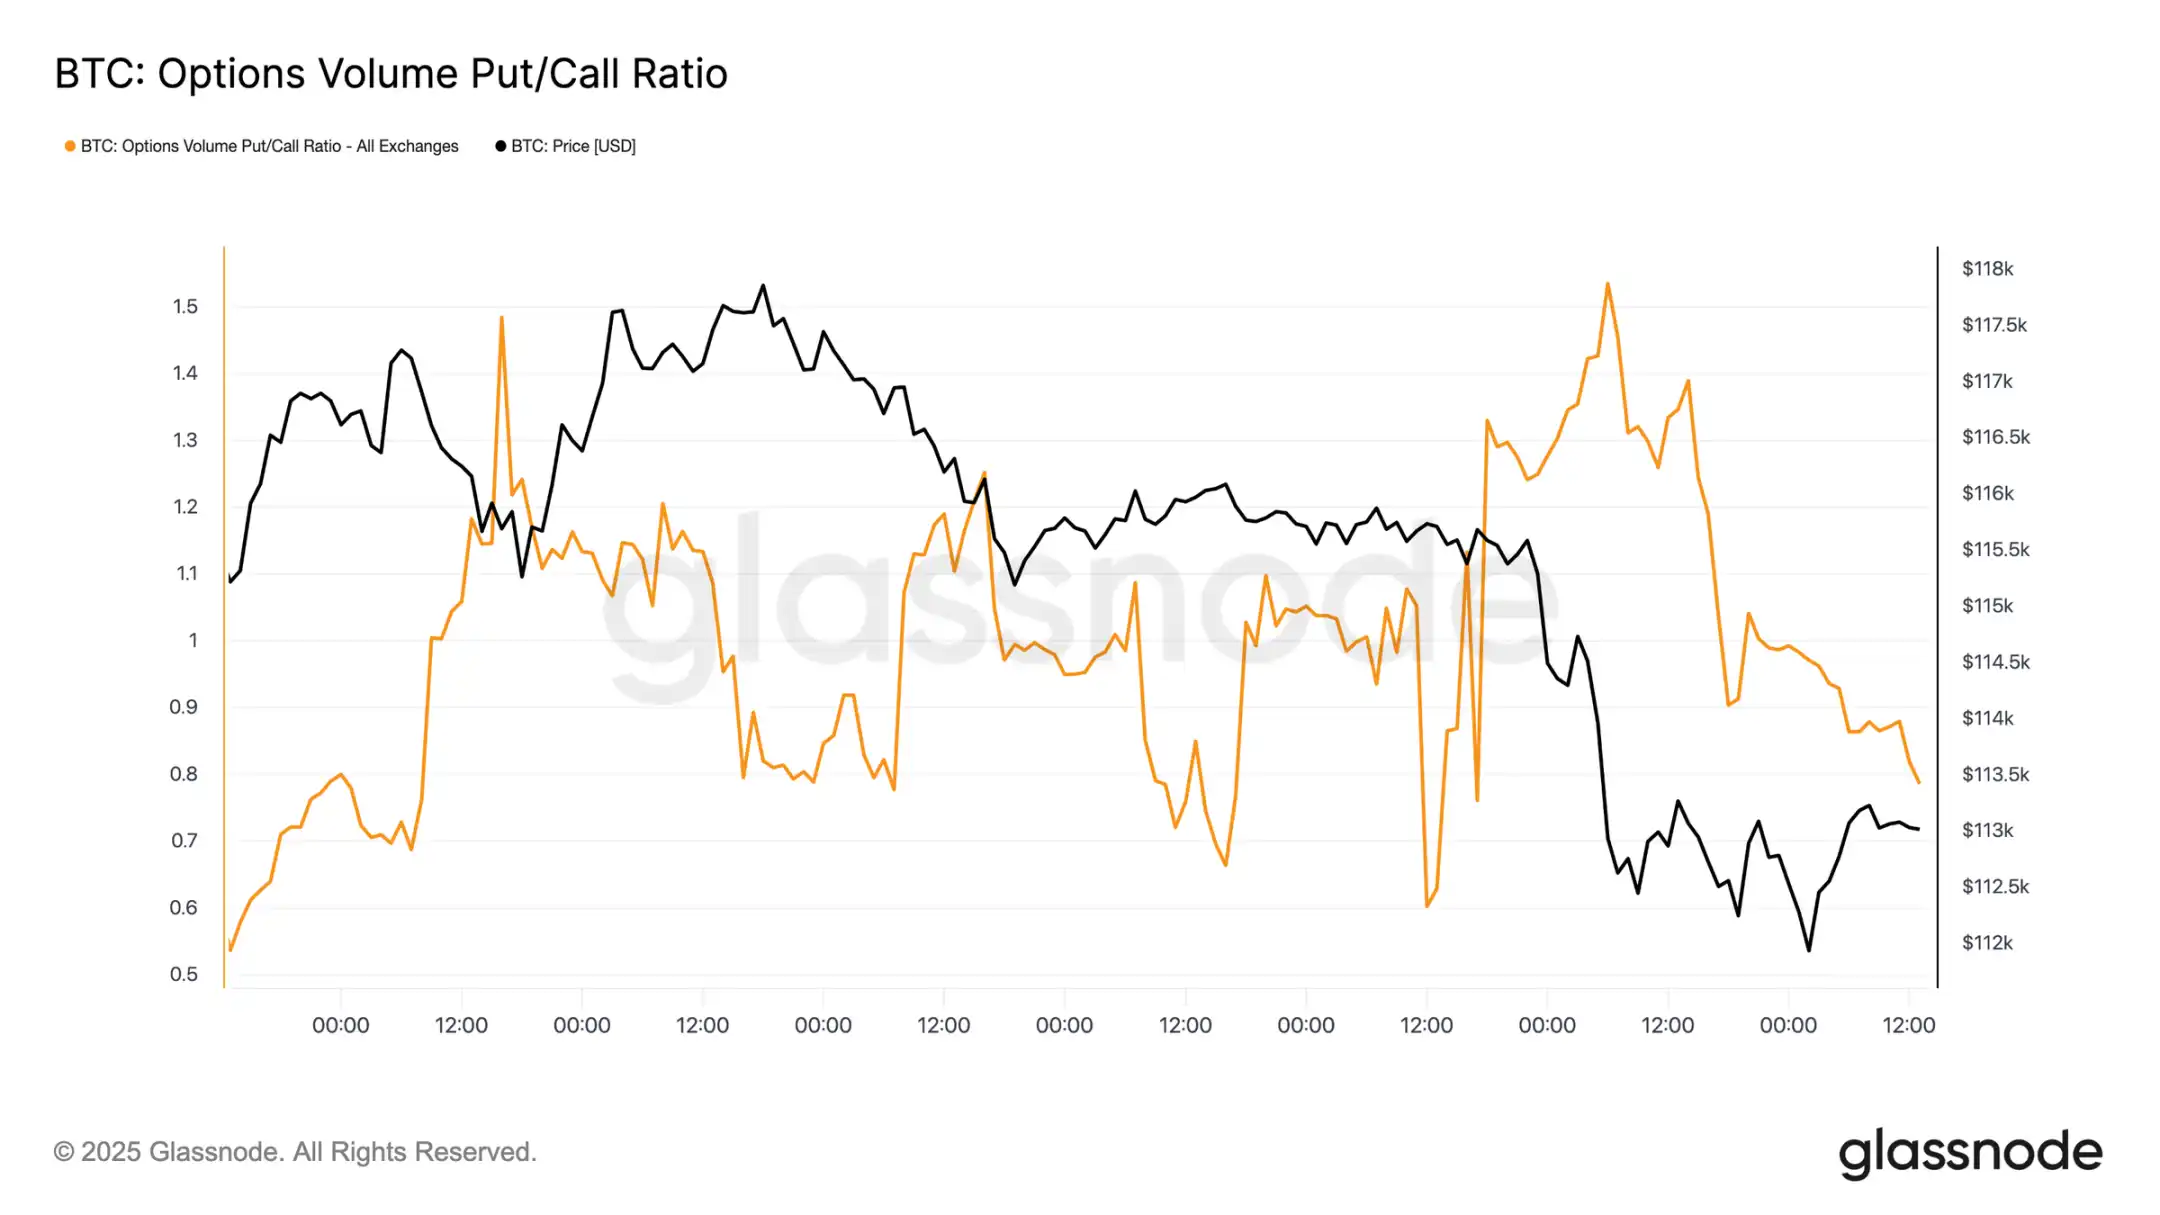
看跌 / 看涨期权资金流
抛售之后,看跌 / 看涨期权成交量比率呈下降趋势,因为交易员锁定了价内看跌期权的利润,而其他交易员则轮动到更便宜的看涨期权。短期和中期期权仍然严重倾向于看跌期权,使得下行保护相对于上行而言成本高昂。对于对年底持建设性观点的参与者来说,这种不平衡创造了机会——要么以相对较低的成本积累看涨期权,要么通过卖出价格高昂的下行风险暴露来为其融资。
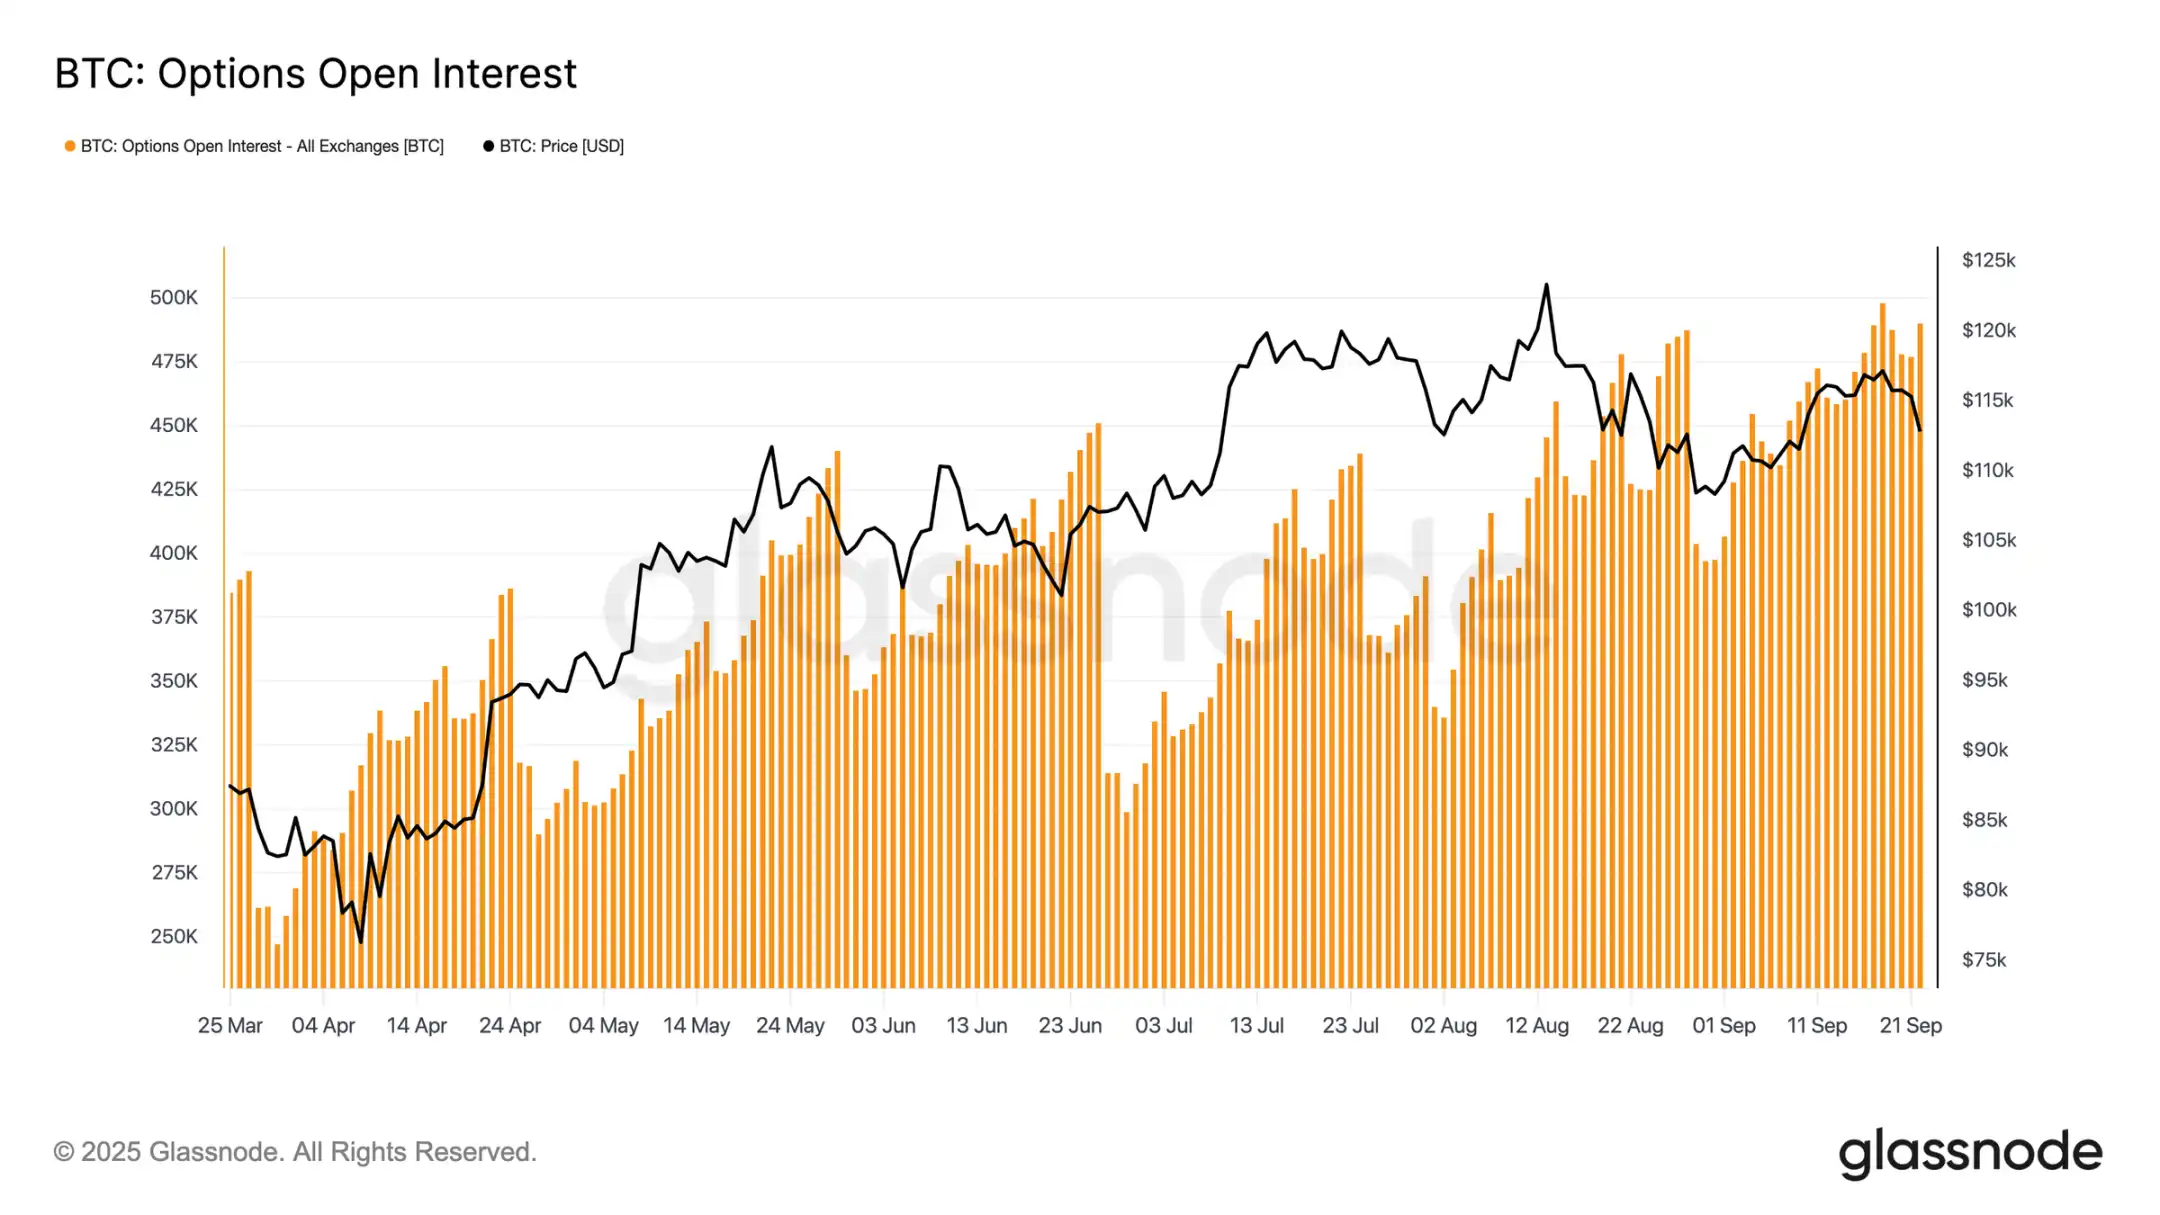
期权未平仓
期权总未平仓合约徘徊在历史高点附近,并将在周五早间到期时急剧减少,然后在 12 月之前重新建立市场。目前,市场处于峰值区域,即使微小的价格波动也会迫使做市商进行激进的对冲。做市商在下行方向做空,在上行方向做多,这种结构会放大抛售同时限制反弹。这种动态将近期波动风险偏向下行,加剧了脆弱性,直到到期清除且头寸重置。
结论
比特币在 FOMC 会议后的回落反映了一种典型的「买谣言,卖事实」模式,但更广泛的背景指向日益增长的疲惫感。当前 12% 的跌幅与过去周期相比较为温和,但这是在三次主要的资本流入浪潮之后出现的,这些浪潮将已实现市值提升了 6780 亿美元,几乎是前一周期的两倍。长期持有者已经实现了 340 万 BTC 的利润,突显了本轮上涨的大量抛售和成熟度。
与此同时,此前吸收供应的 ETF 流入已经放缓,造成了脆弱的平衡。现货成交量因强制卖出而激增,期货出现急剧去杠杆,期权市场对下行风险进行定价。这些信号共同表明市场动力正在耗尽,流动性驱动的波动占据主导。
除非机构和持有者的需求再次一致,否则深度降温的风险仍然很高。
免责声明:本文章仅代表作者个人观点,不代表本平台的立场和观点。本文章仅供信息分享,不构成对任何人的任何投资建议。用户与作者之间的任何争议,与本平台无关。如网页中刊载的文章或图片涉及侵权,请提供相关的权利证明和身份证明发送邮件到support@aicoin.com,本平台相关工作人员将会进行核查。


