GM,咱们先简单看看当下 BTC、ETH 的情况!
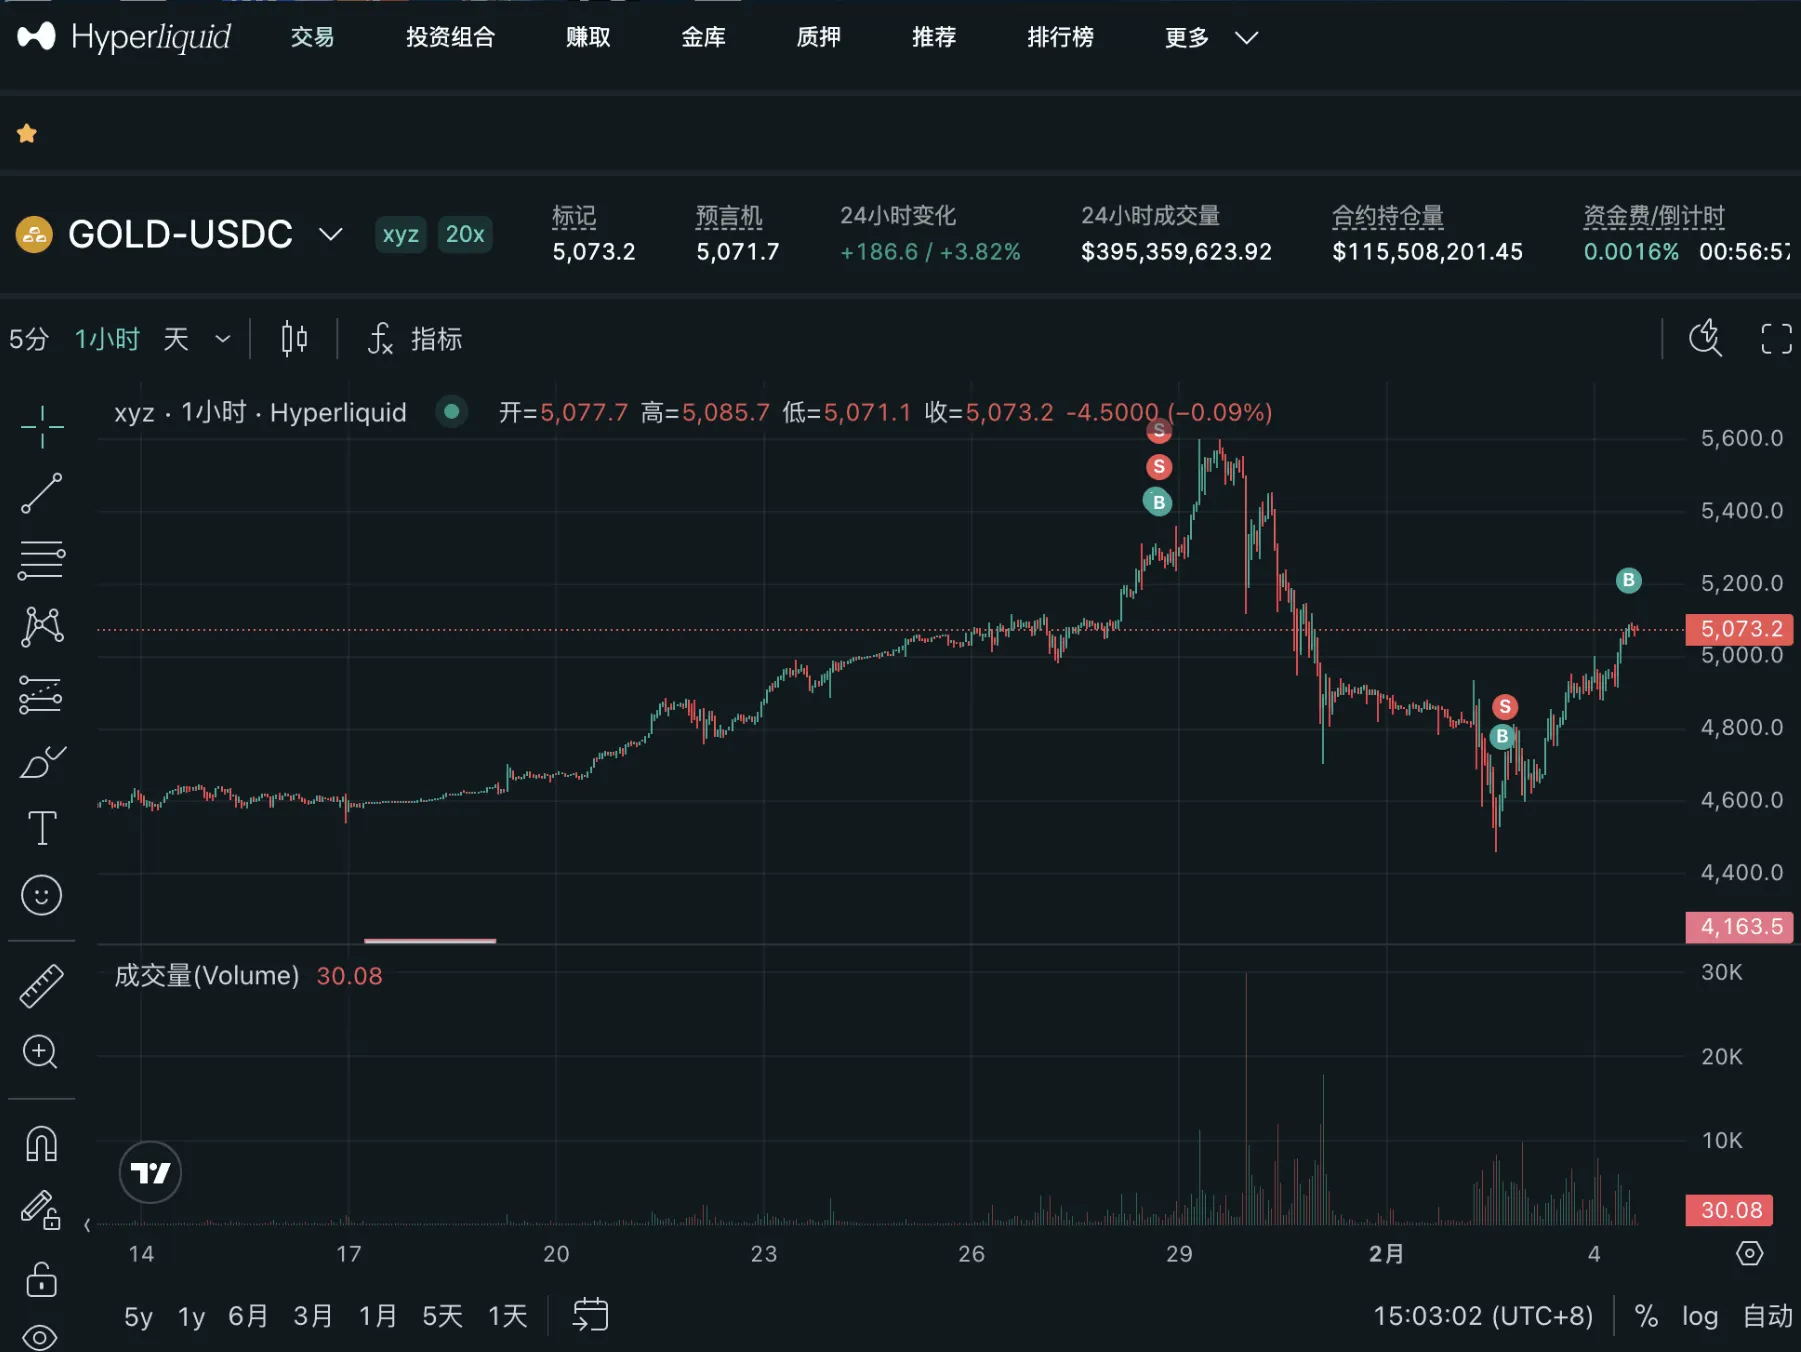
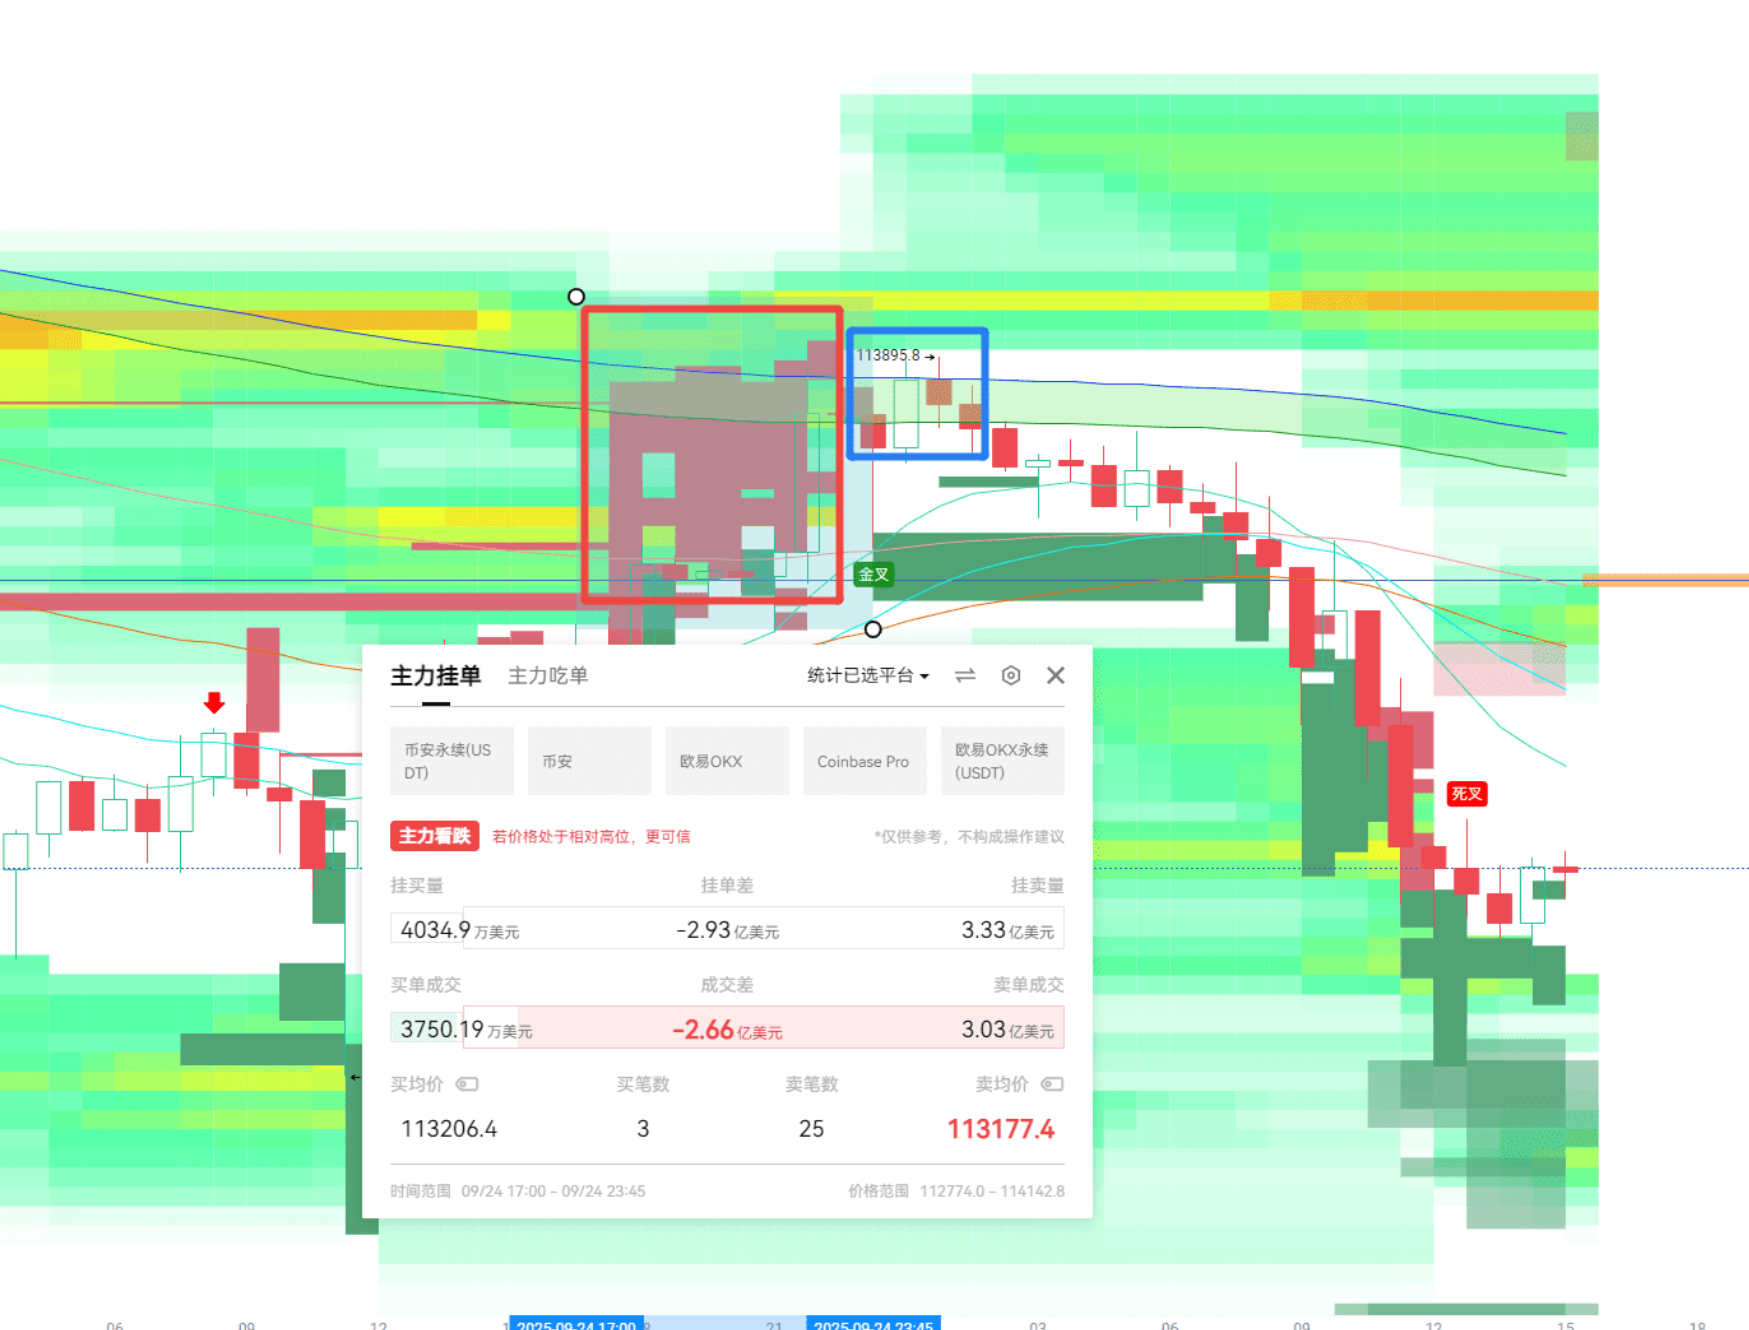
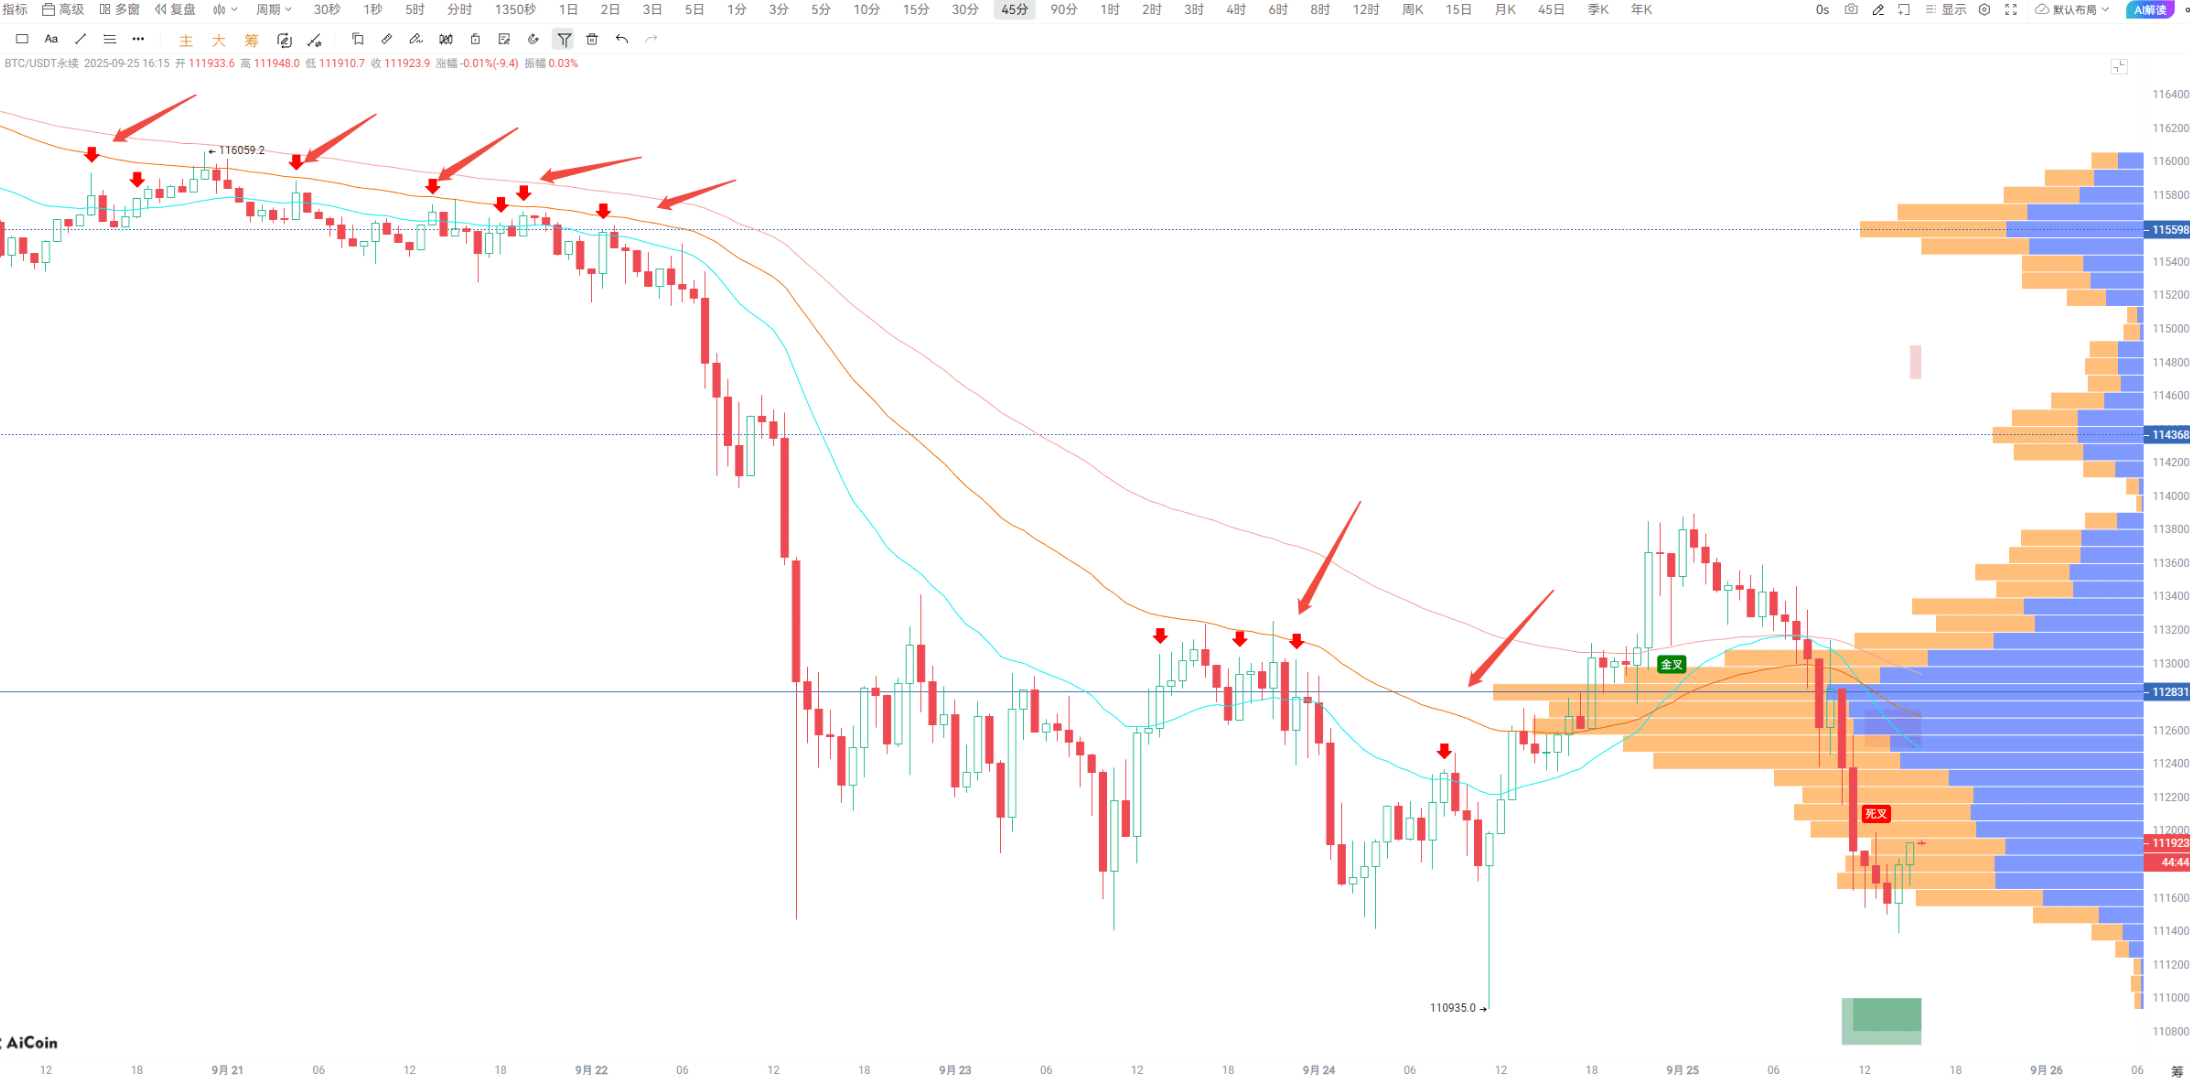
先看大饼的走势:之前 BTC 在 45 分钟周期里,一直没能成功突破 EMA52 均线;突破后,又受到 Vegas 通道的压制。而且昨晚主力开空、平多加上卖出现货,金额超过 3 亿美元。午间价格放量下跌,回测 111.3K 的支撑位。
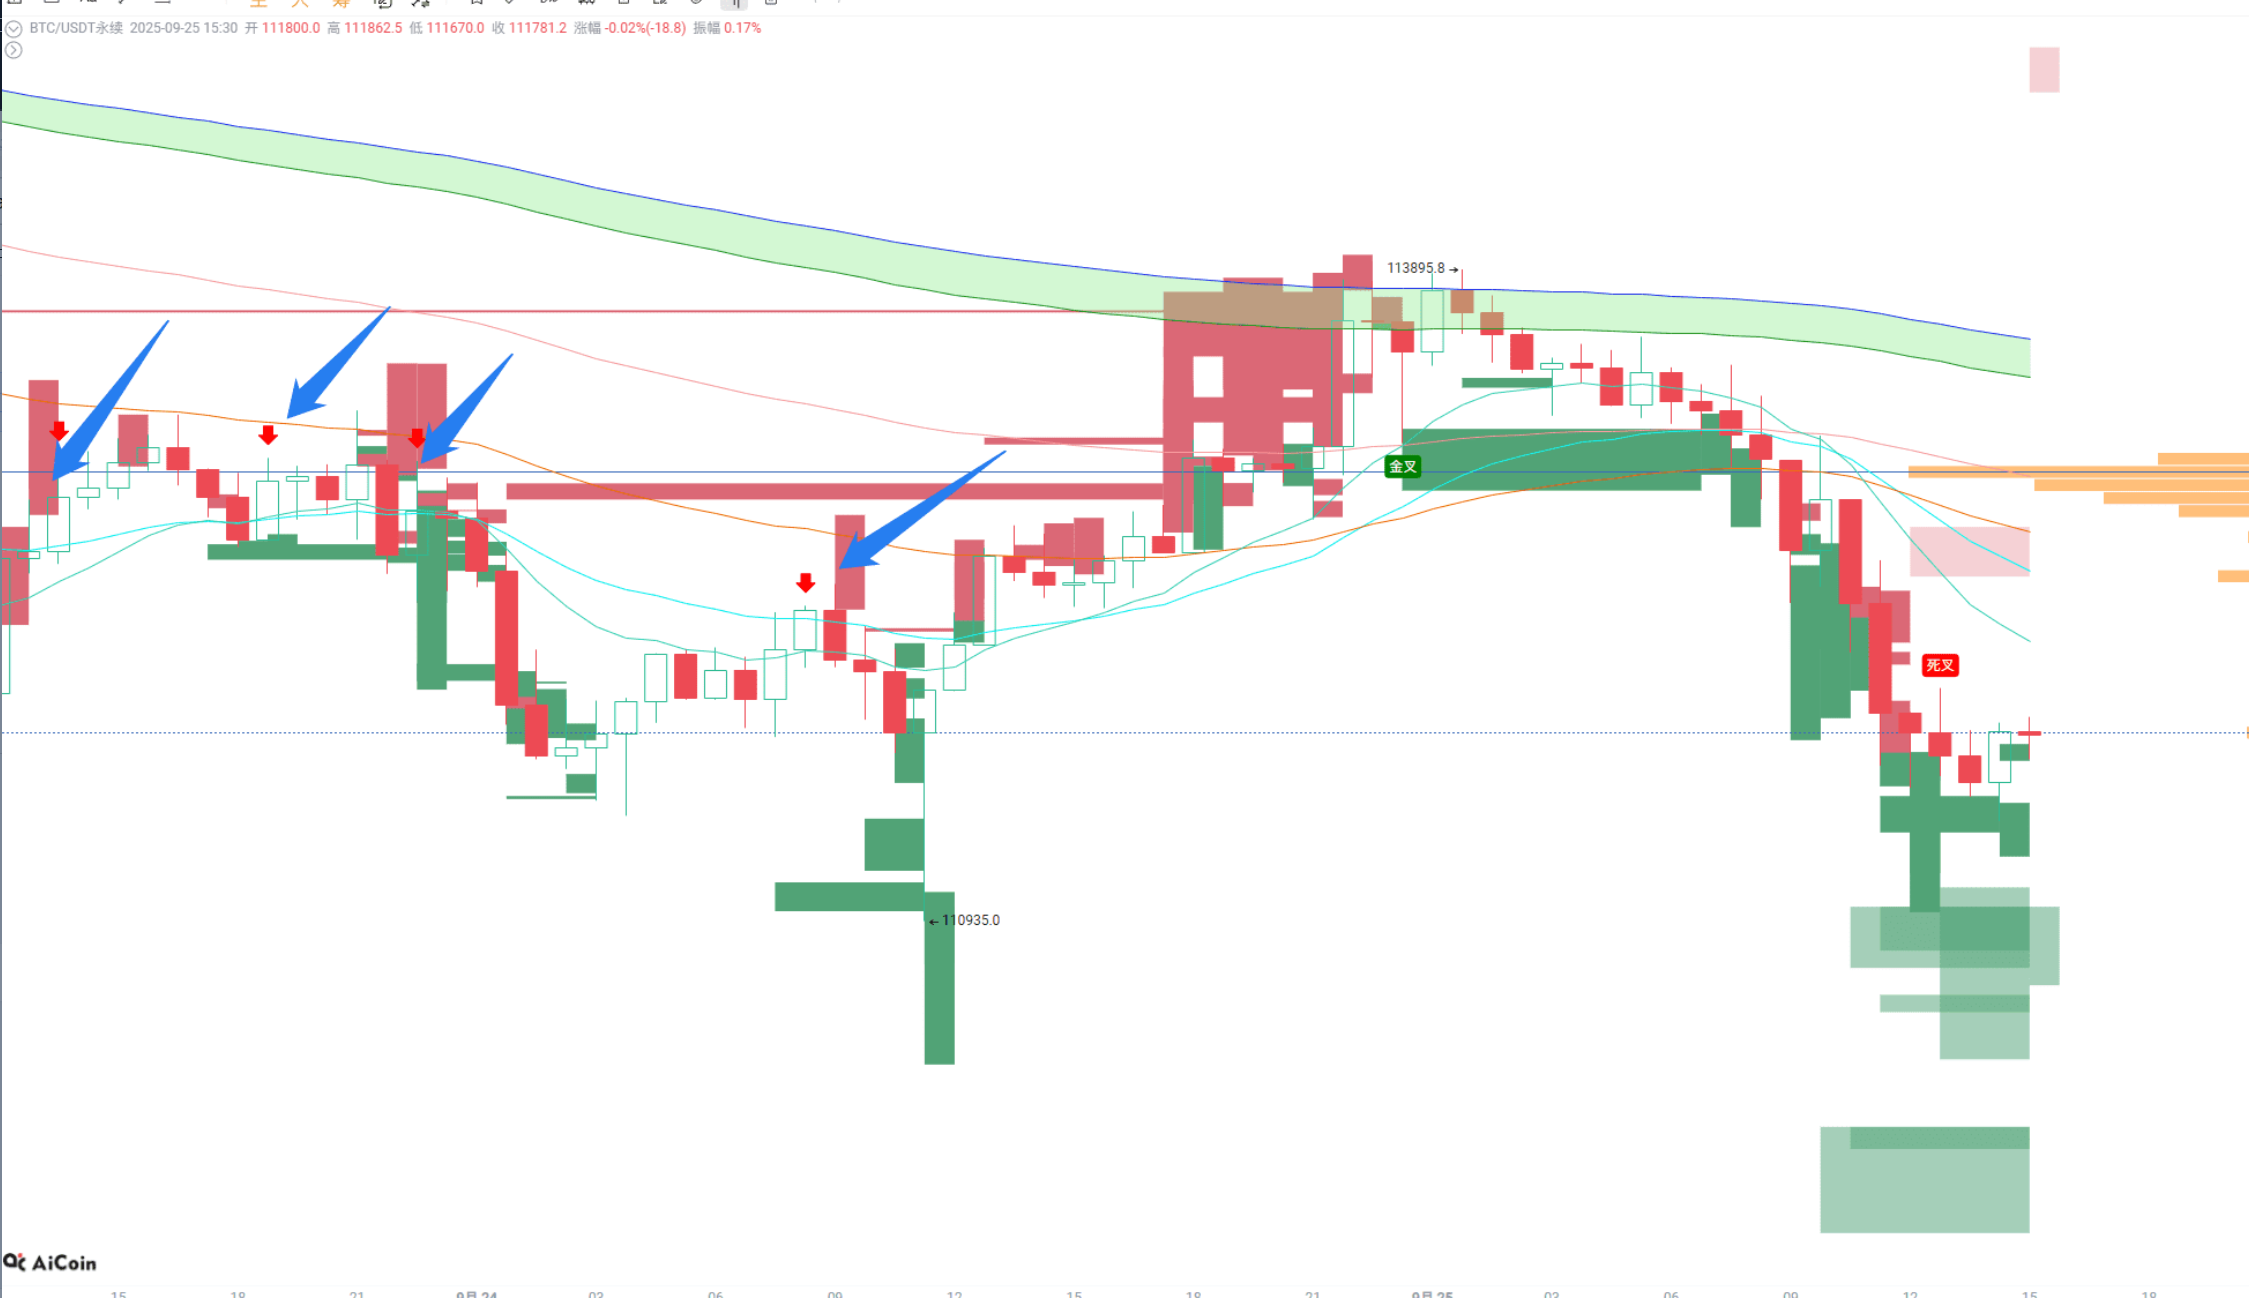
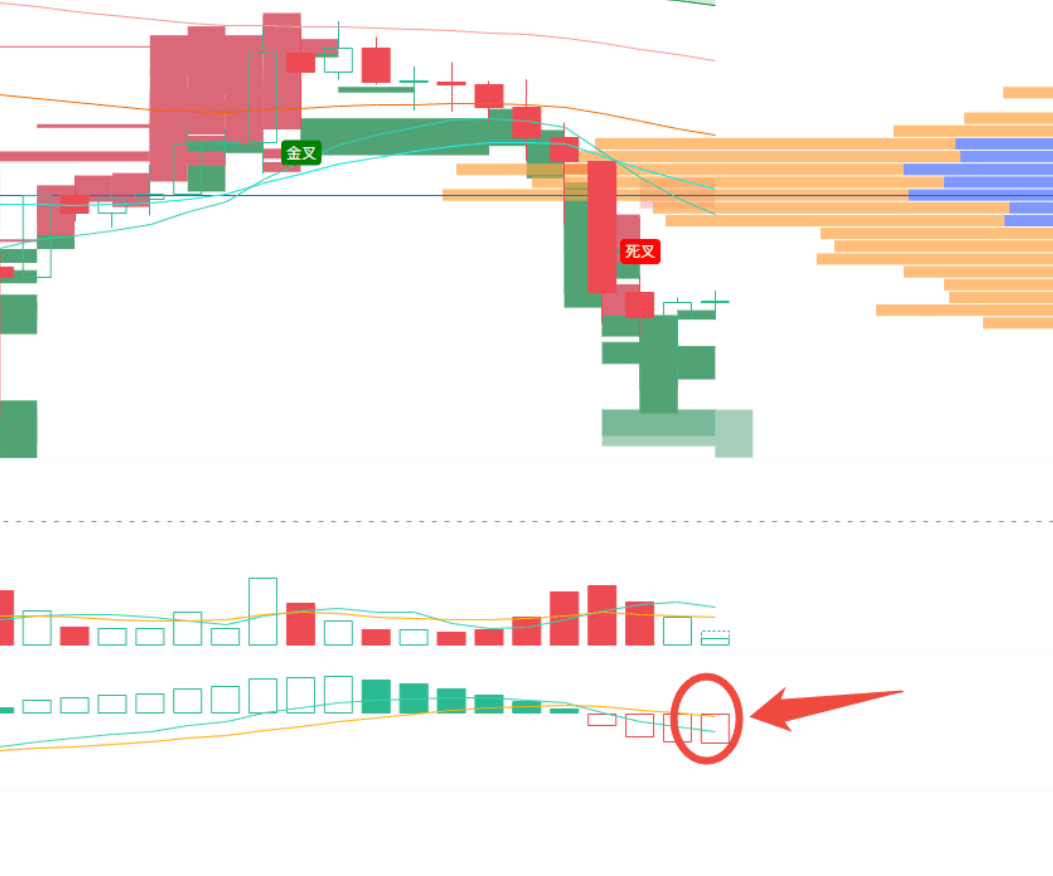
这里需要重点关注几点:90 分钟周期里,macd 慢线正在下穿零轴;
支撑区域在 111450 到 111080 之间,这是清算图的磁力区,也是主力大单的关键位置;
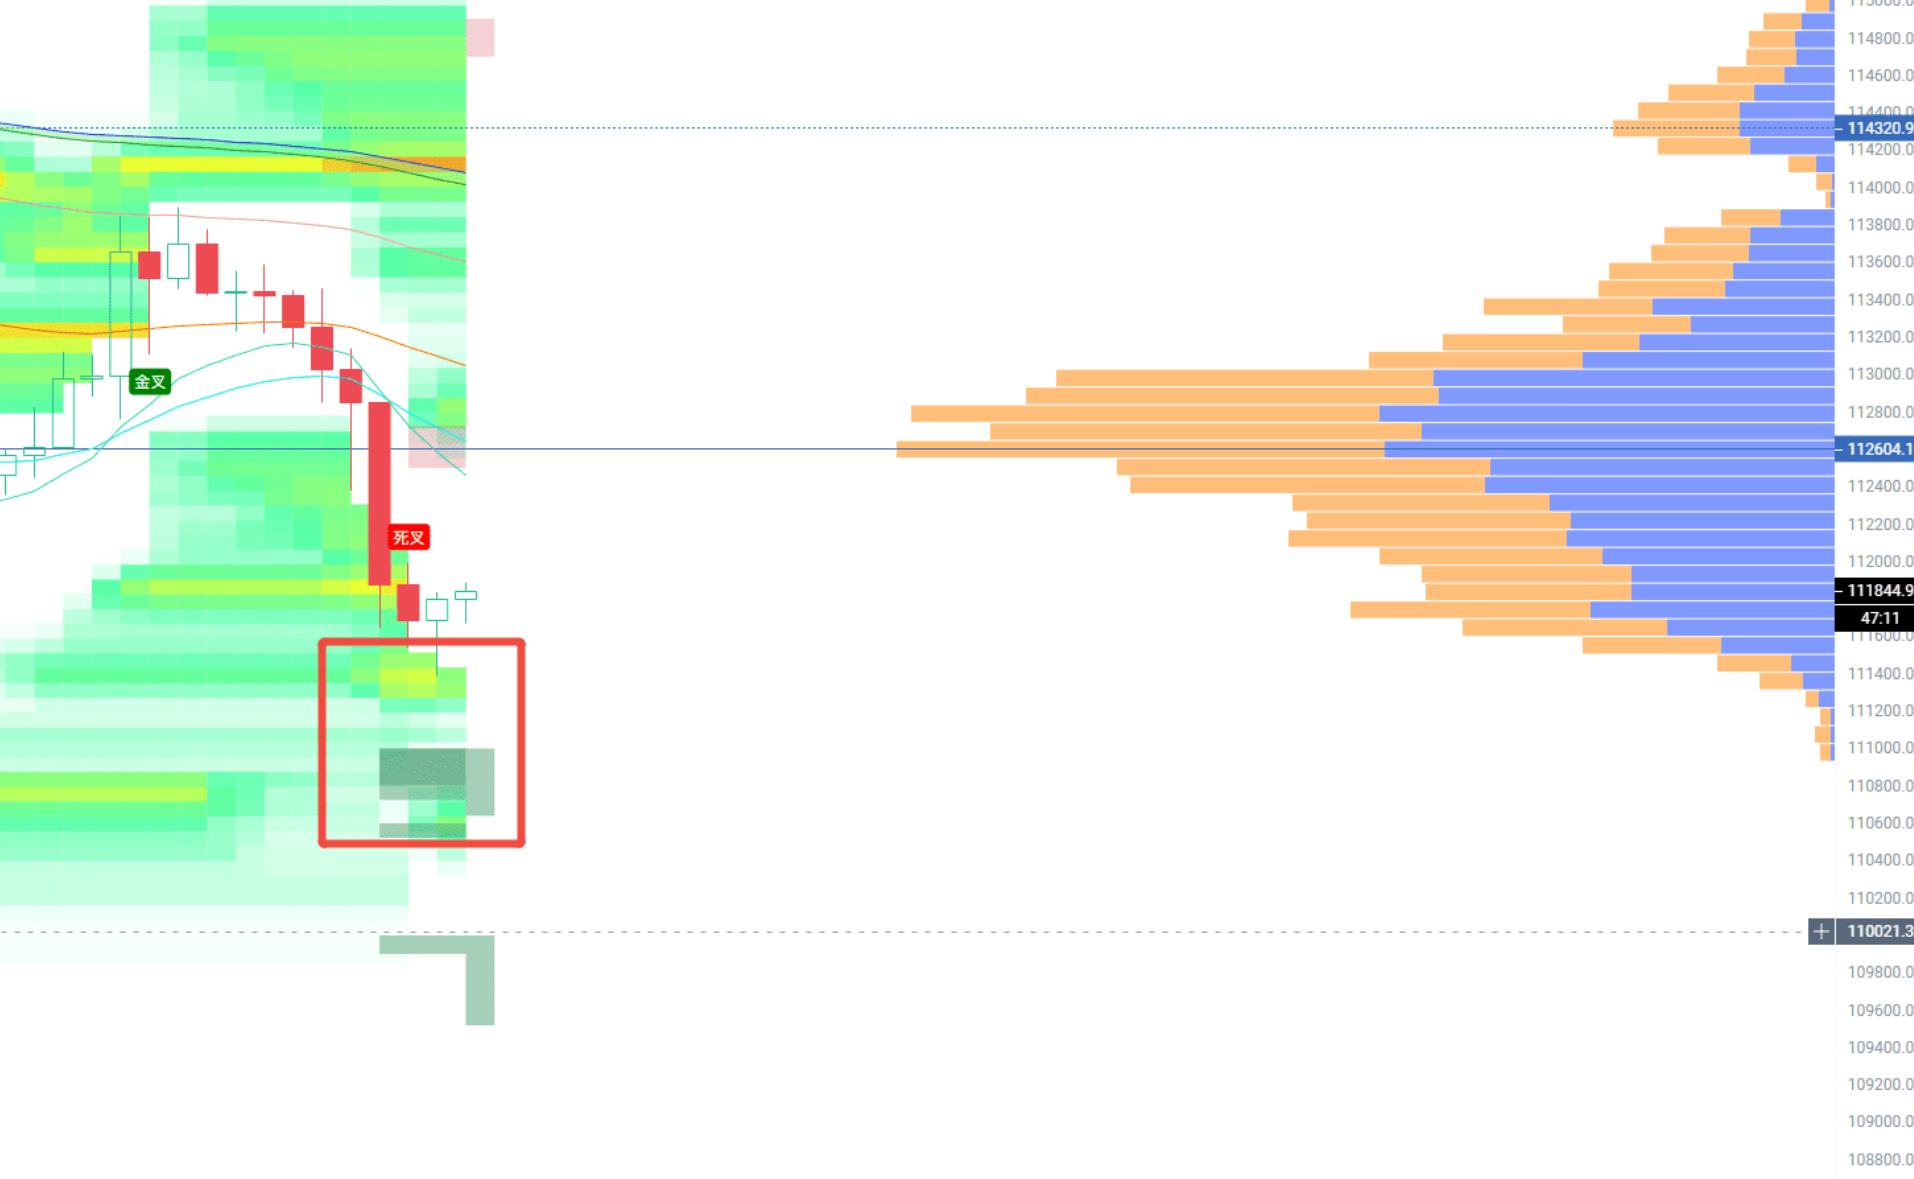
还有近一个月的筹码峰支撑。

假突破的信号太多,所以一定要重点关注收盘时的突破情况。
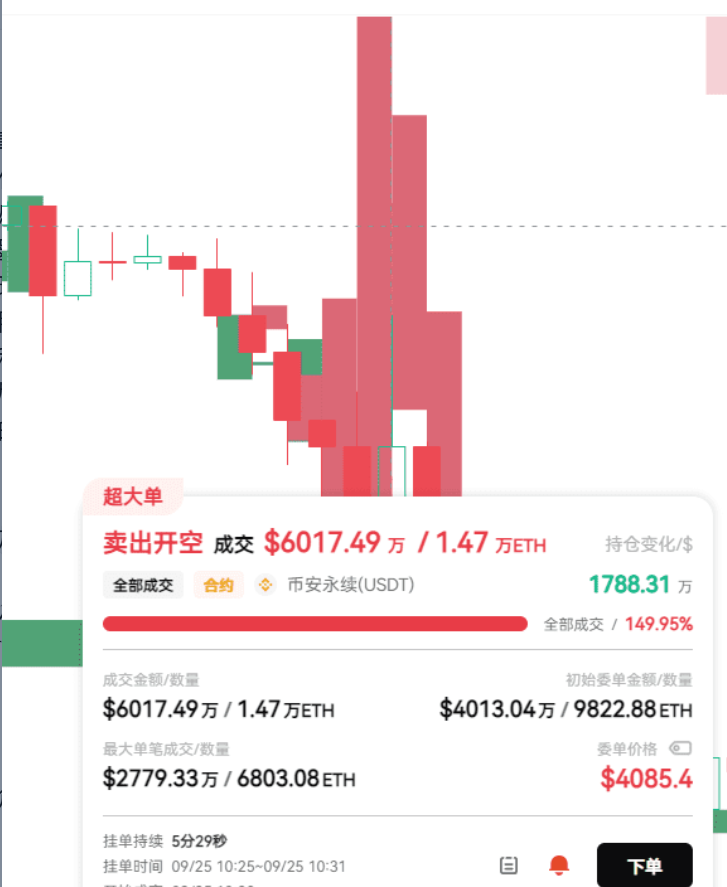
再来看以太:早上有大户成交了一笔超 6000 万美元的空单,当时持仓量大幅增加,同时 LSUR 走高,这说明那会儿是散户在抄底,主力在做空(结合主力大单看更清楚)。
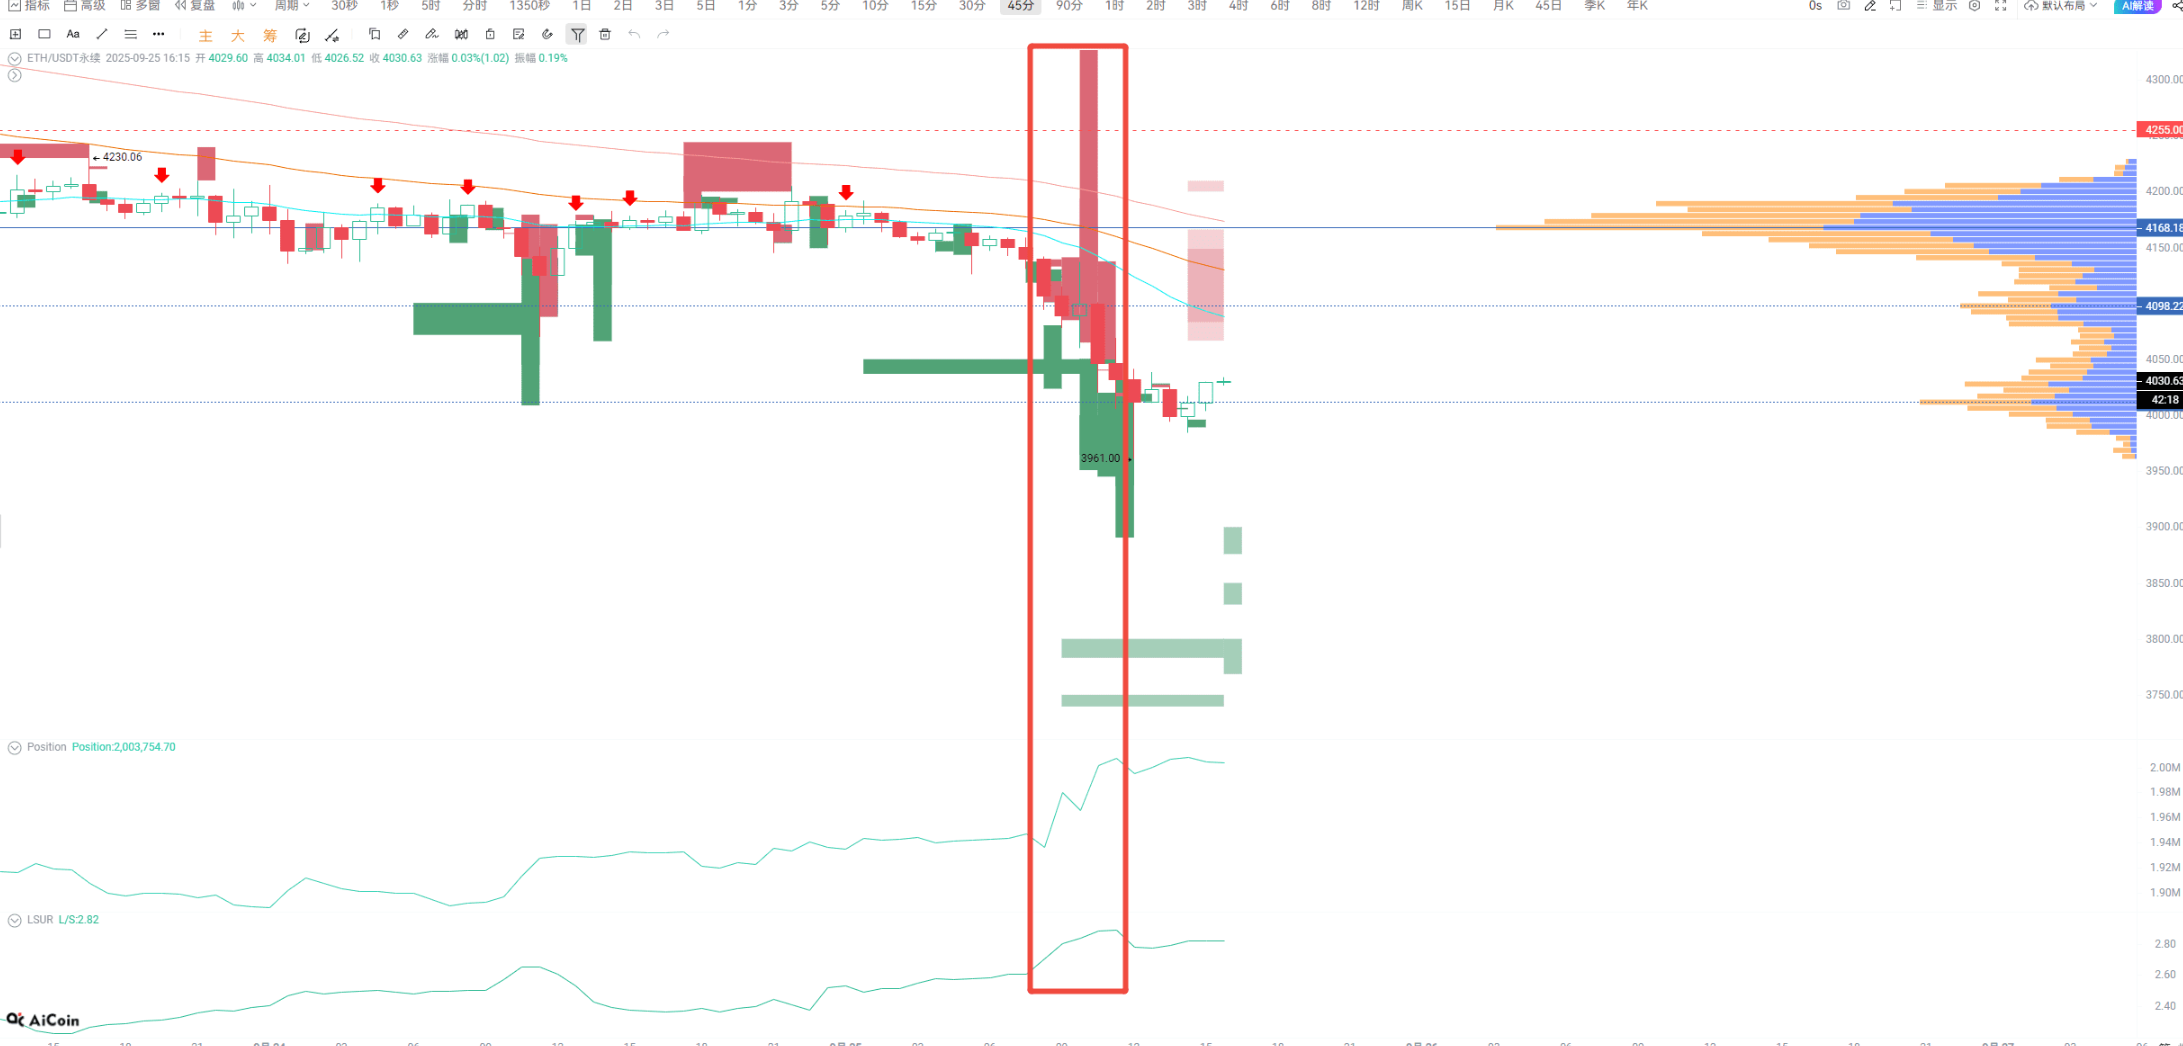
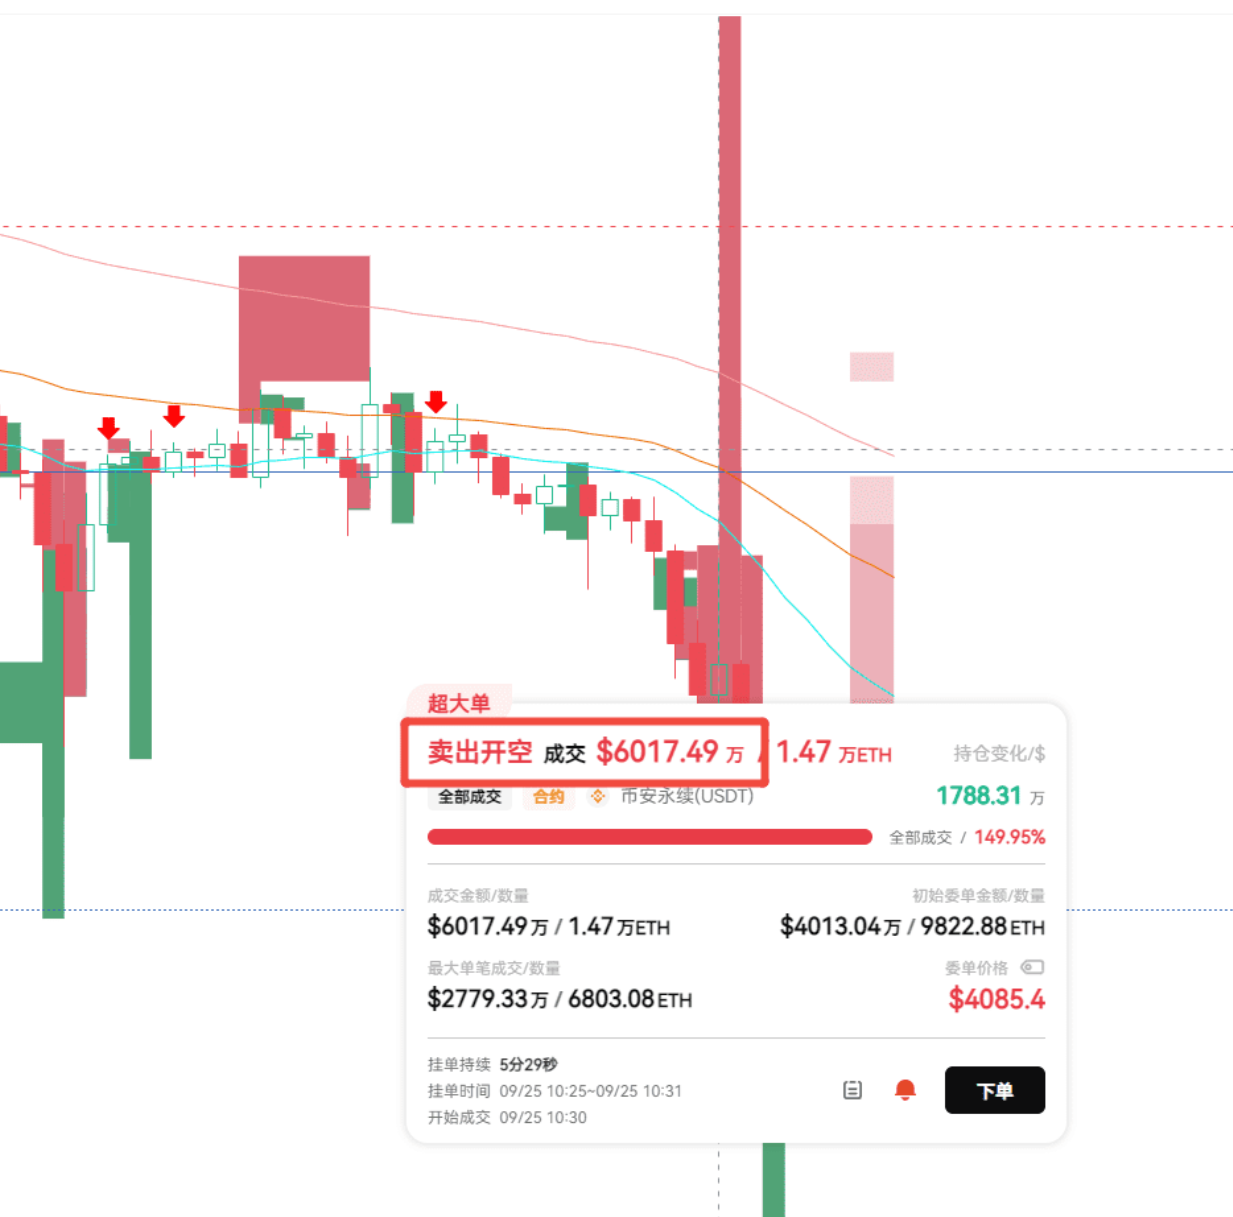
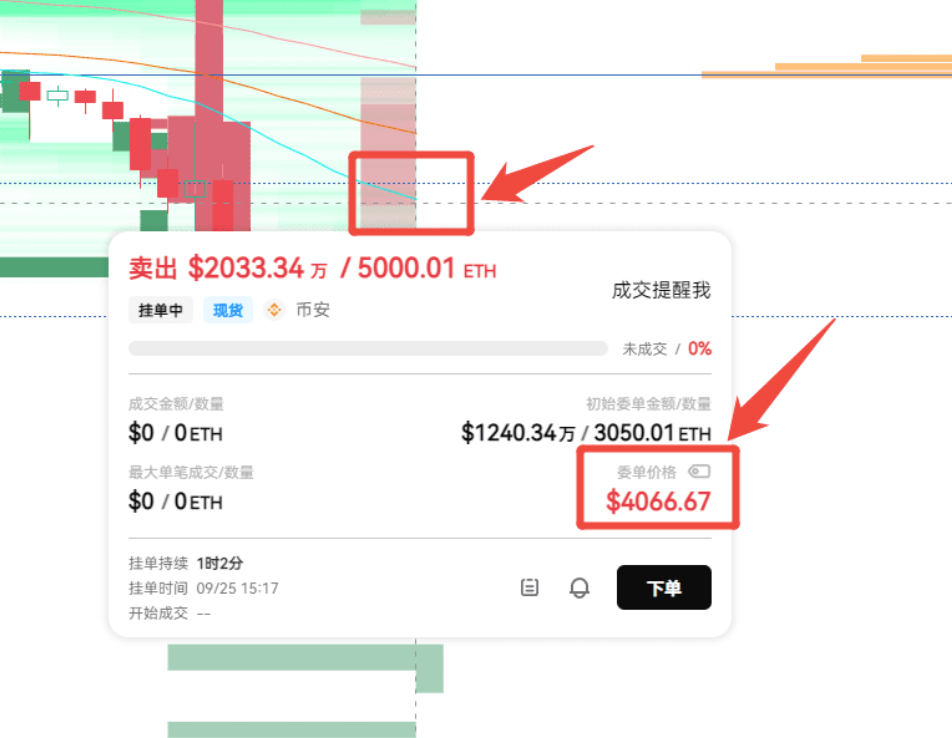
现在以太现价的上下方都有大额买卖单。
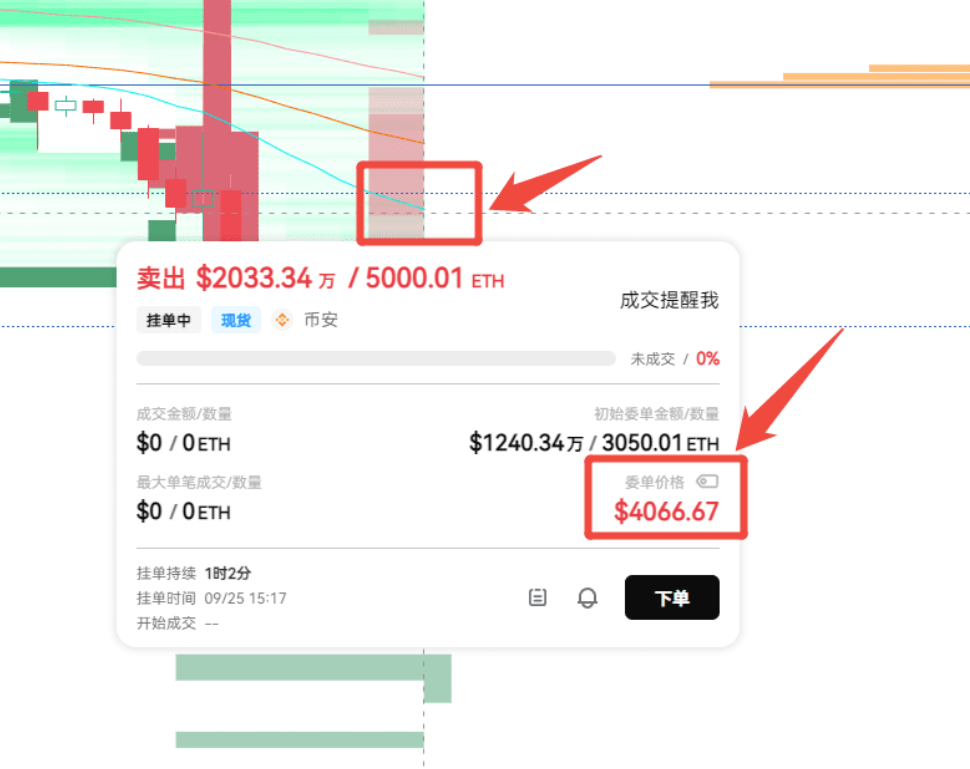
卖单刚好位于 EMA24 附近,是很强的压力位。要是量能没跟上,就是弱反弹,一般是空头回补带来的。
这个价位里,主力有换手、有平多,也有开多,多空都在争夺。

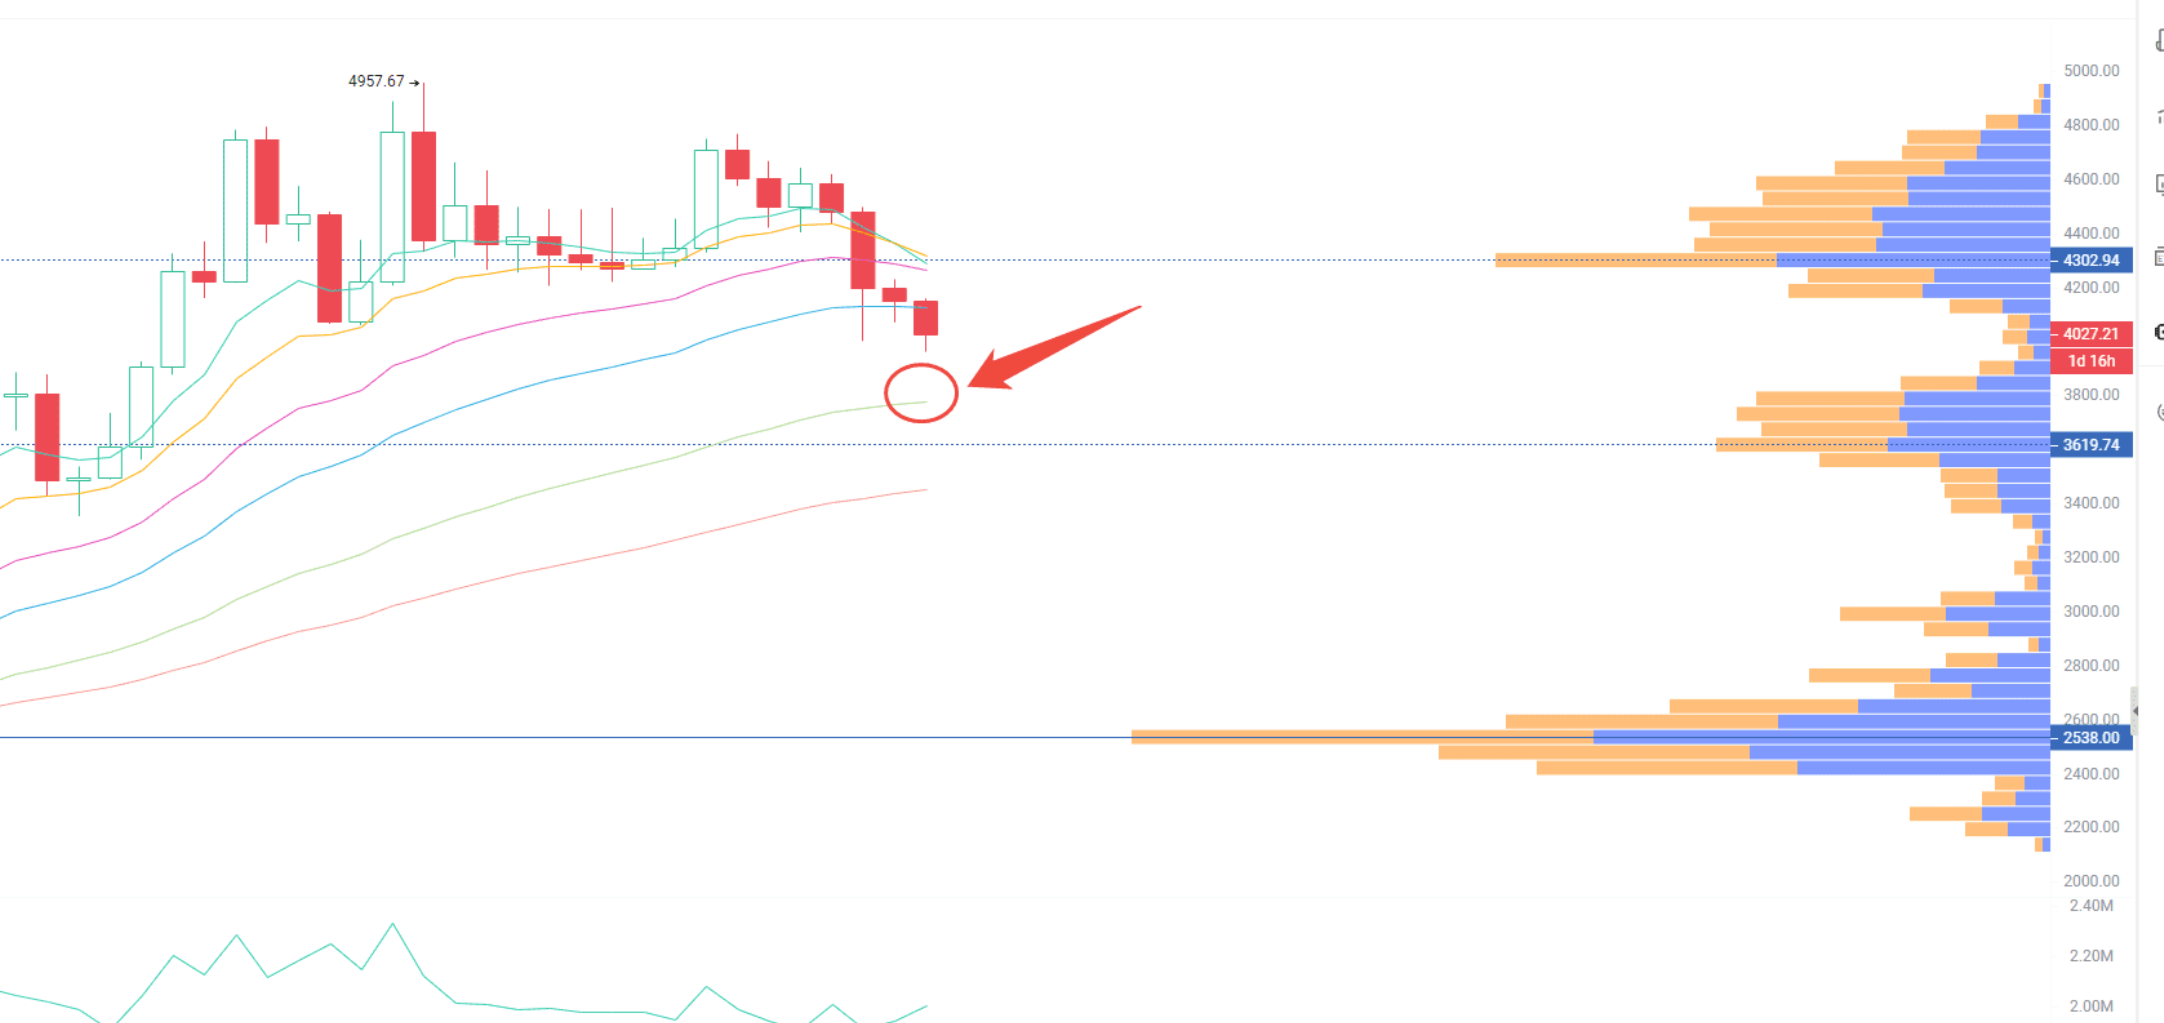
另外,也可以关注下以太的 3 日线周期 —— 它正在下穿 EMA24 均线。
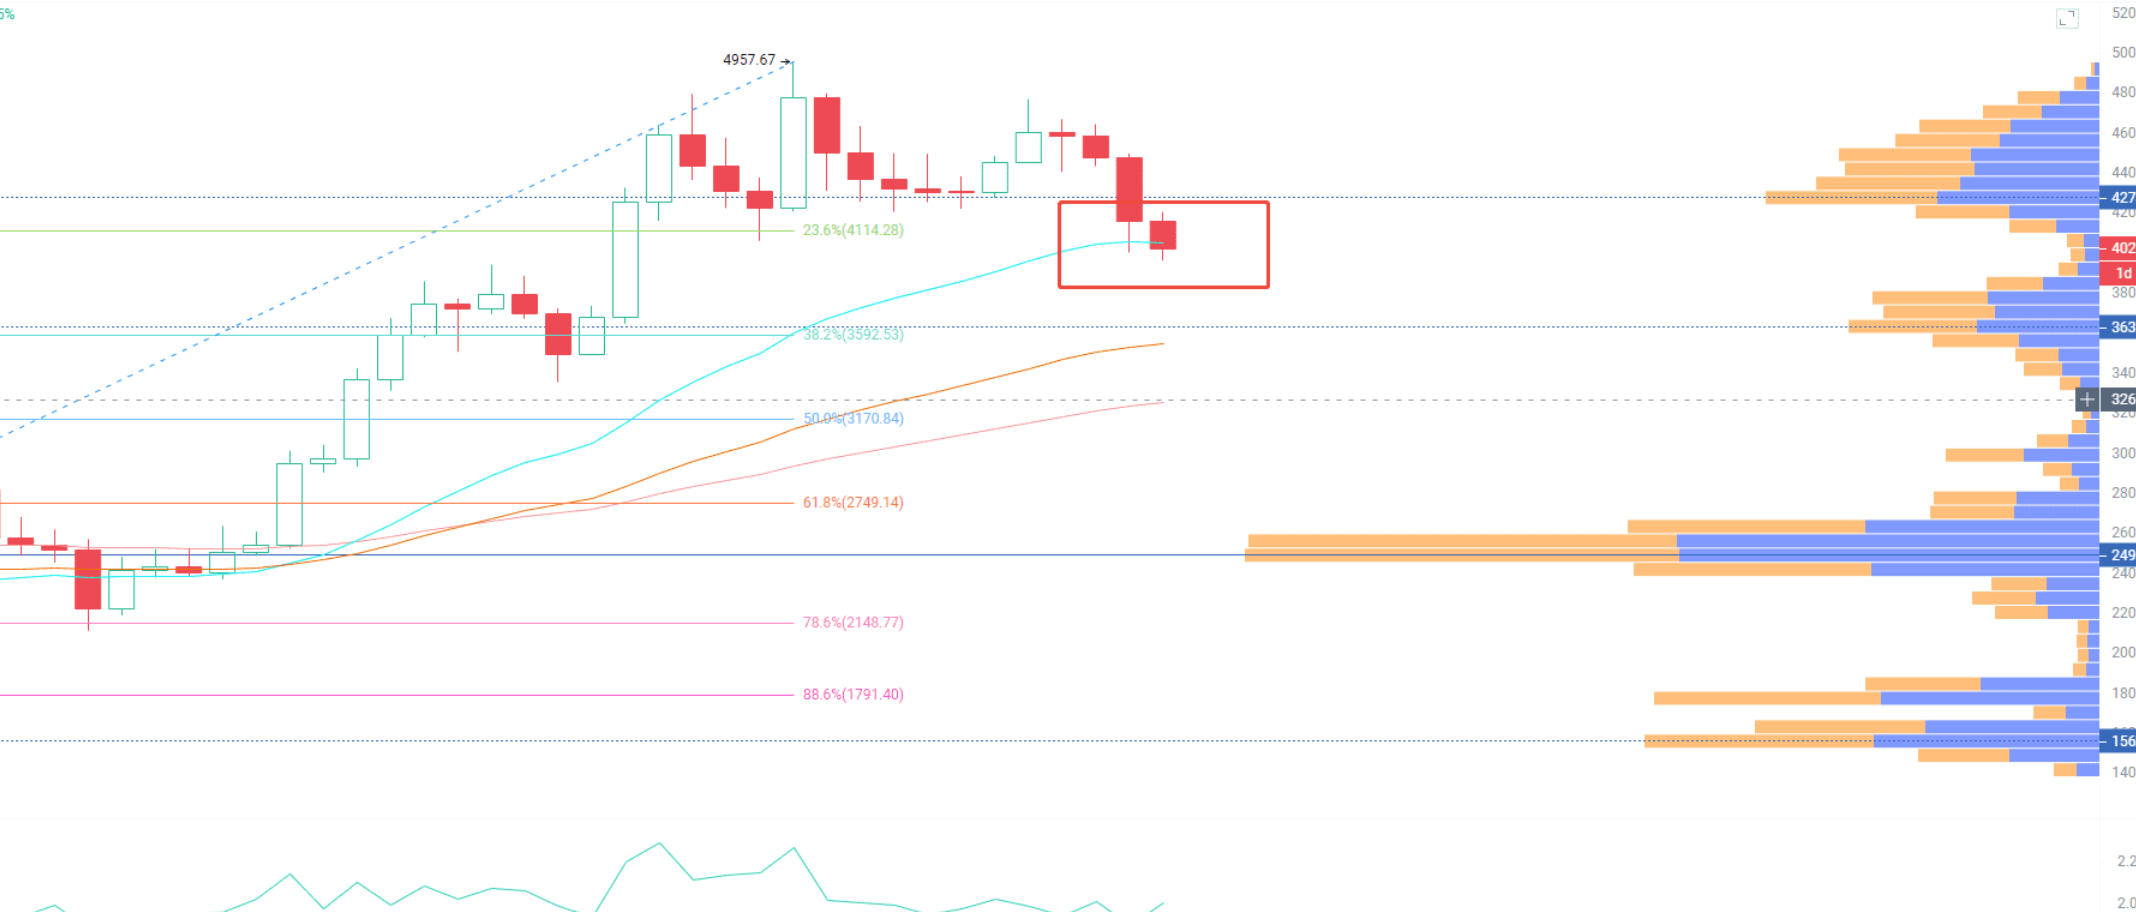
多均线的好处是,当前跌破一根均线后,能以更下方的均线当支撑。比如常用周期是 2 日的话,以太正在下穿 ema31,要是跌破了,就看更下方的 ema55。
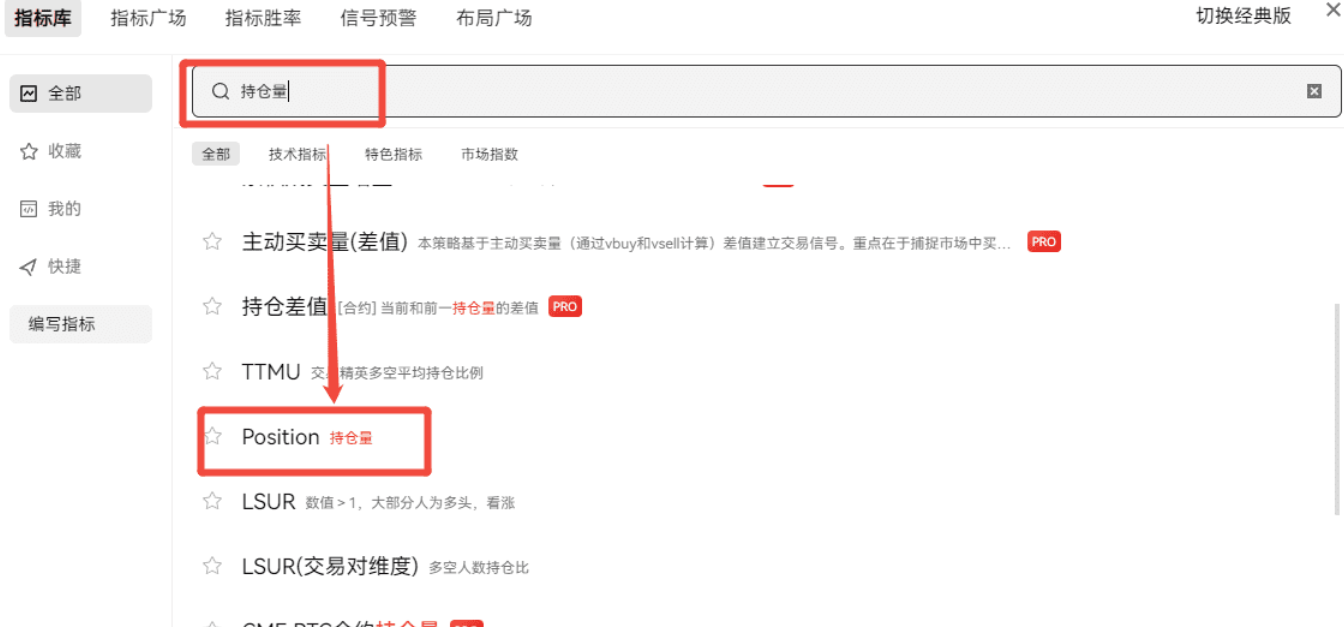
接下来和大家分享持仓量 + LSUR 的组合用法。玩合约的朋友对持仓量应该不陌生,这个指标能帮咱们看清现在有多少资金在博弈:持仓量增加,说明有人开仓(开多或开空);持仓量减少,就是有人离场。
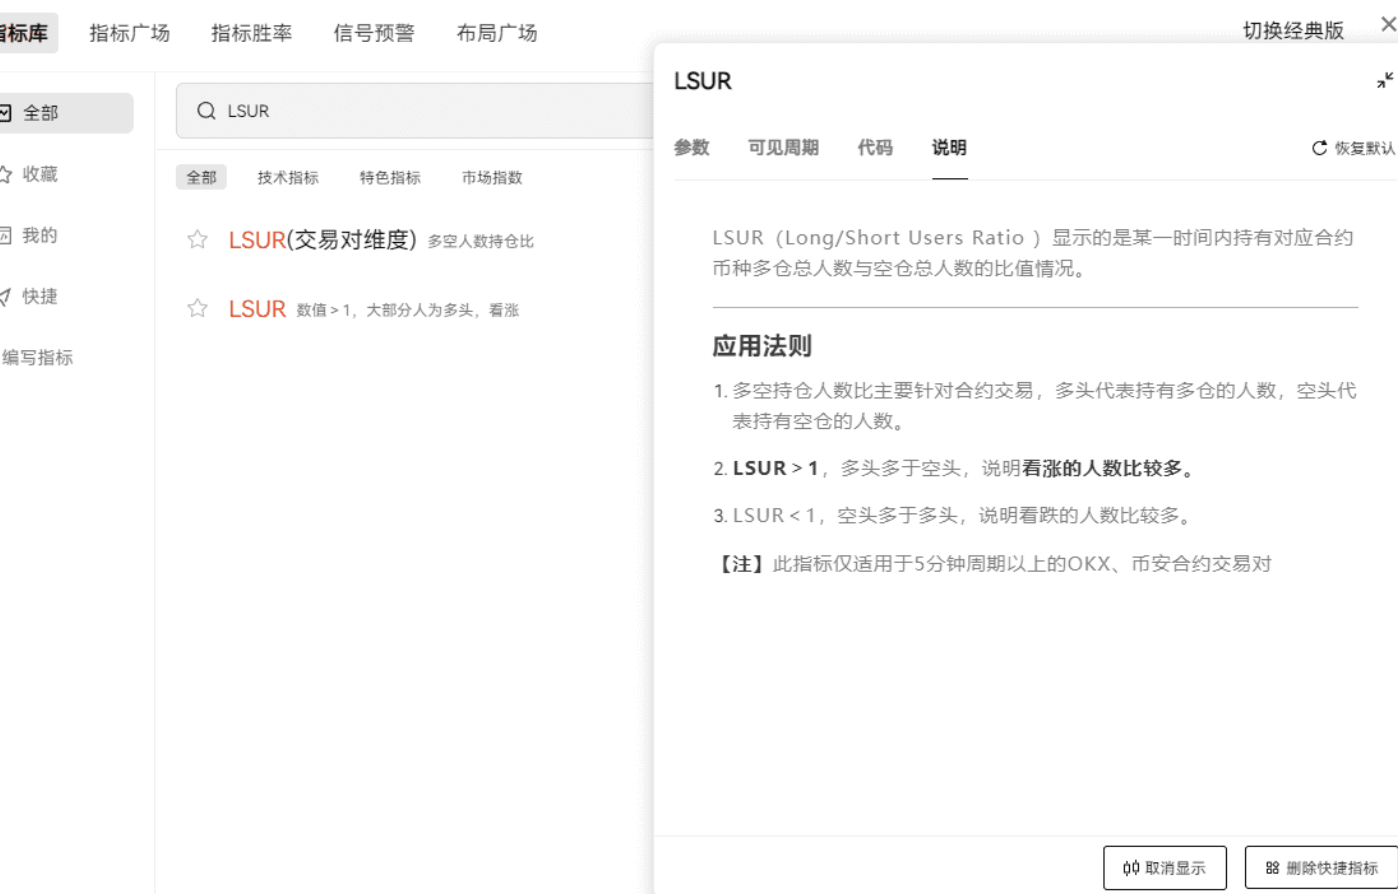
LSUR 是多空持仓人数比,主要反映散户情绪:数值>1,多数人开多;<1,多数人开空。
情景 1:价格涨 + 持仓量涨 + LSUR 跌。
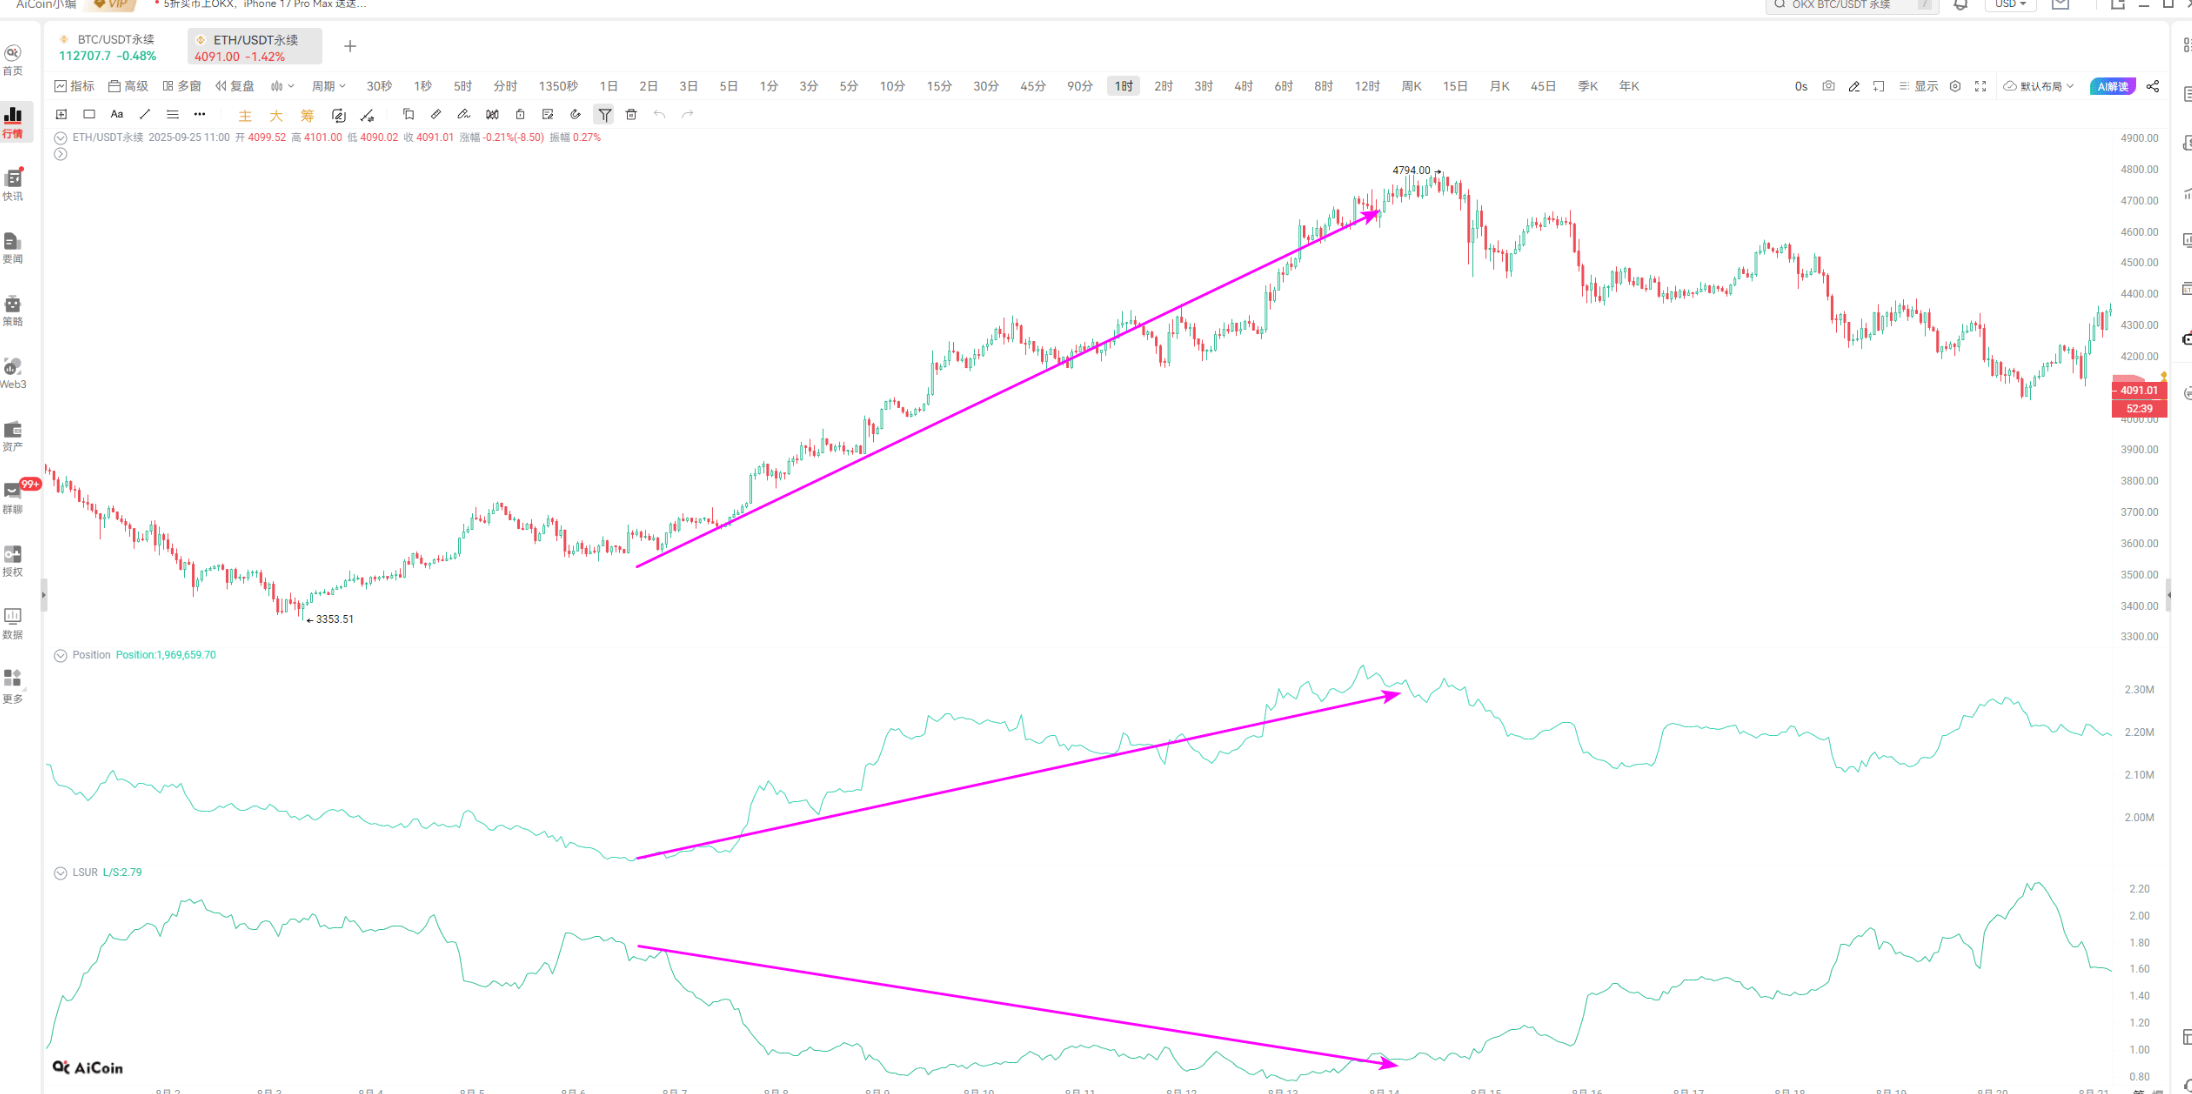
这就是大家常说的 “空军送燃料” 行情,属于最健康、最强势的上涨格局之一。持仓量增加,说明新资金在不断进场,行情推动力是真实的(不是老仓回补导致的);LSUR 下跌,意味着做多人数减少、做空的人变多 —— 散户在做空,主力在做多,这波上涨更可能是主力资金推动的。
情景 2:价格涨 + 持仓量跌 + LSUR 跌。
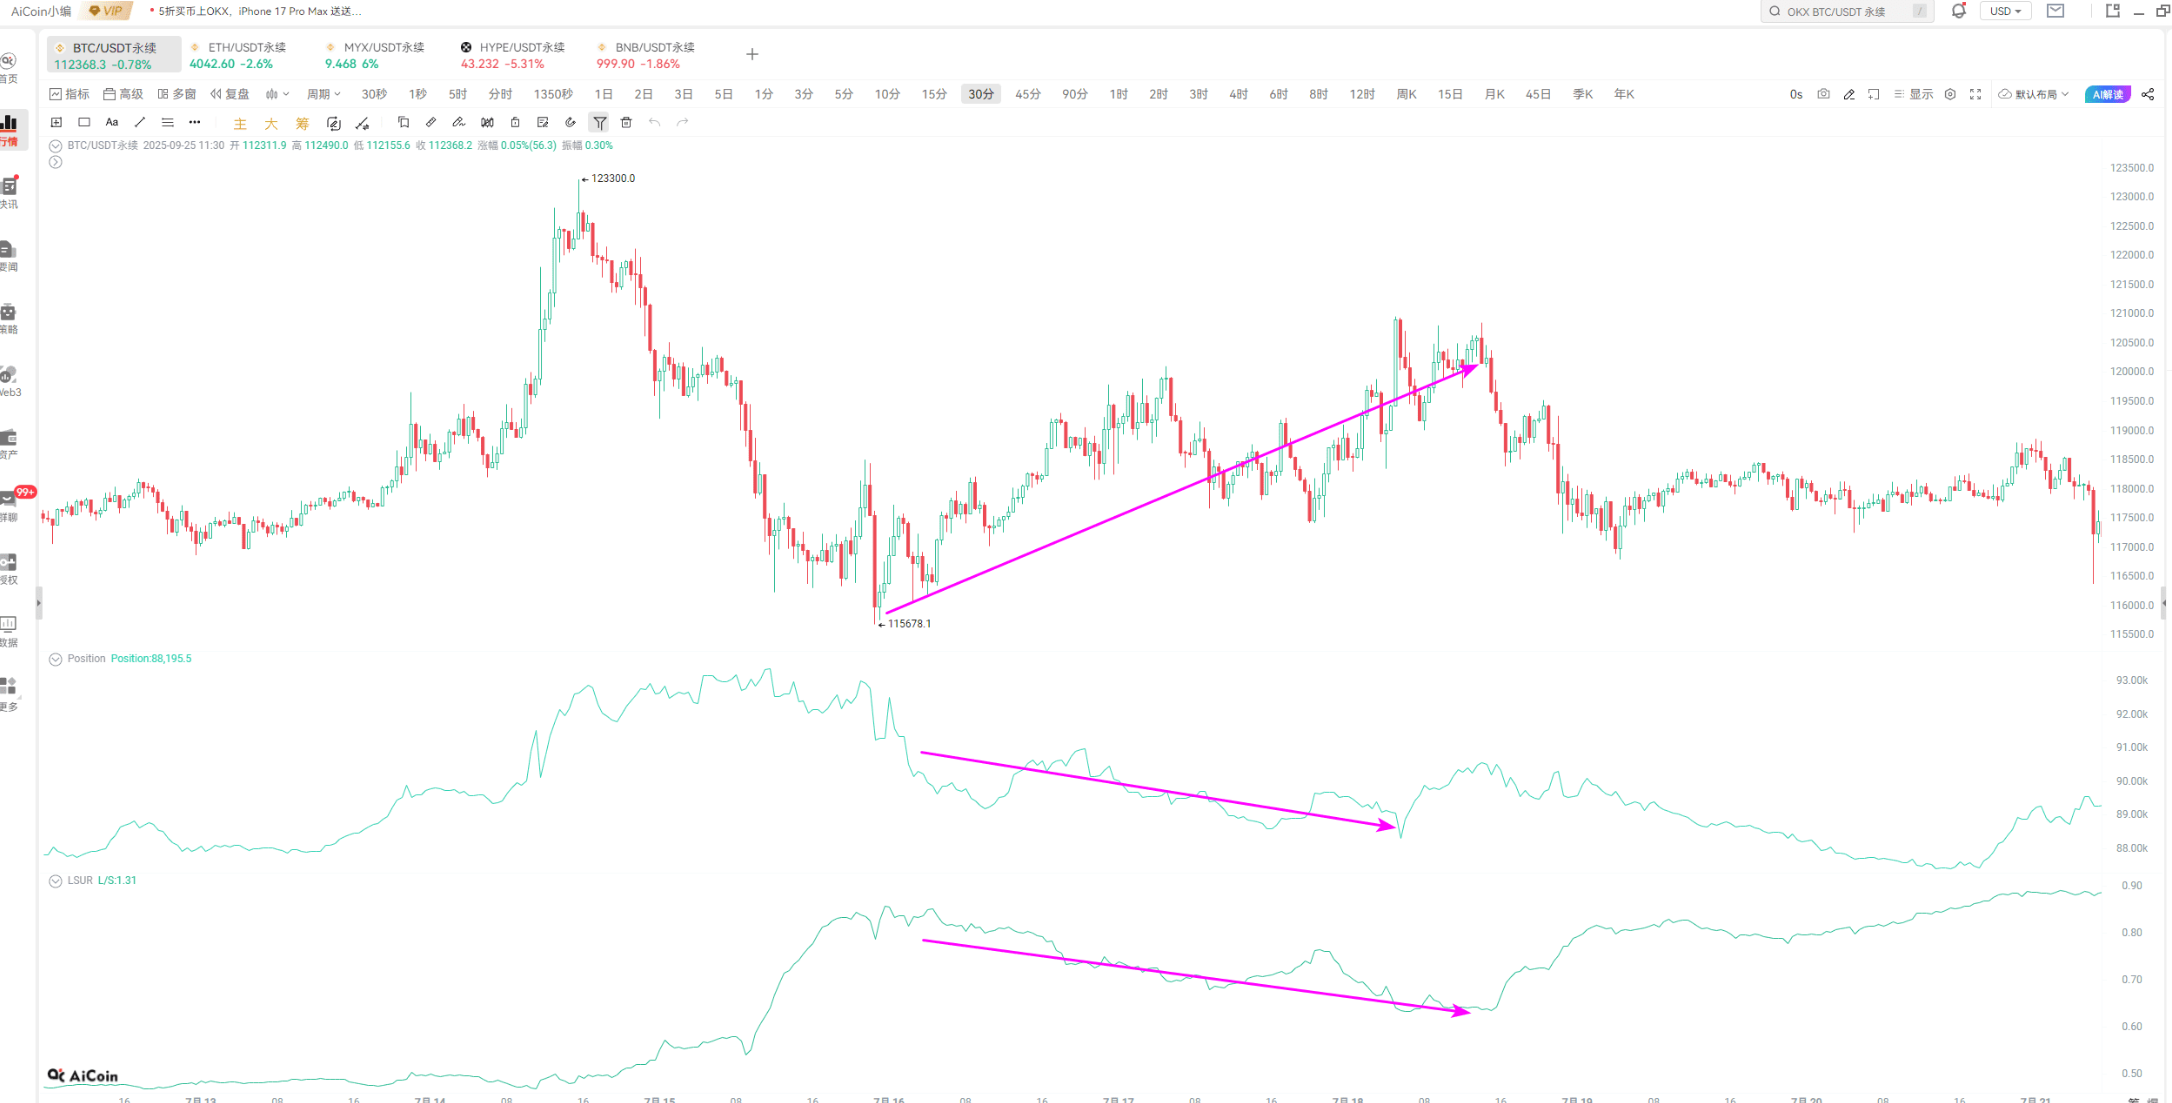
持仓量减少,说明合约市场在减仓、平仓,没新资金加持。这种就是前面说的空头回补行情,属于弱反弹,持续性差,适合高空,而且只能做短期。
情景 3:价格跌 + 持仓量增 + LSUR 涨。
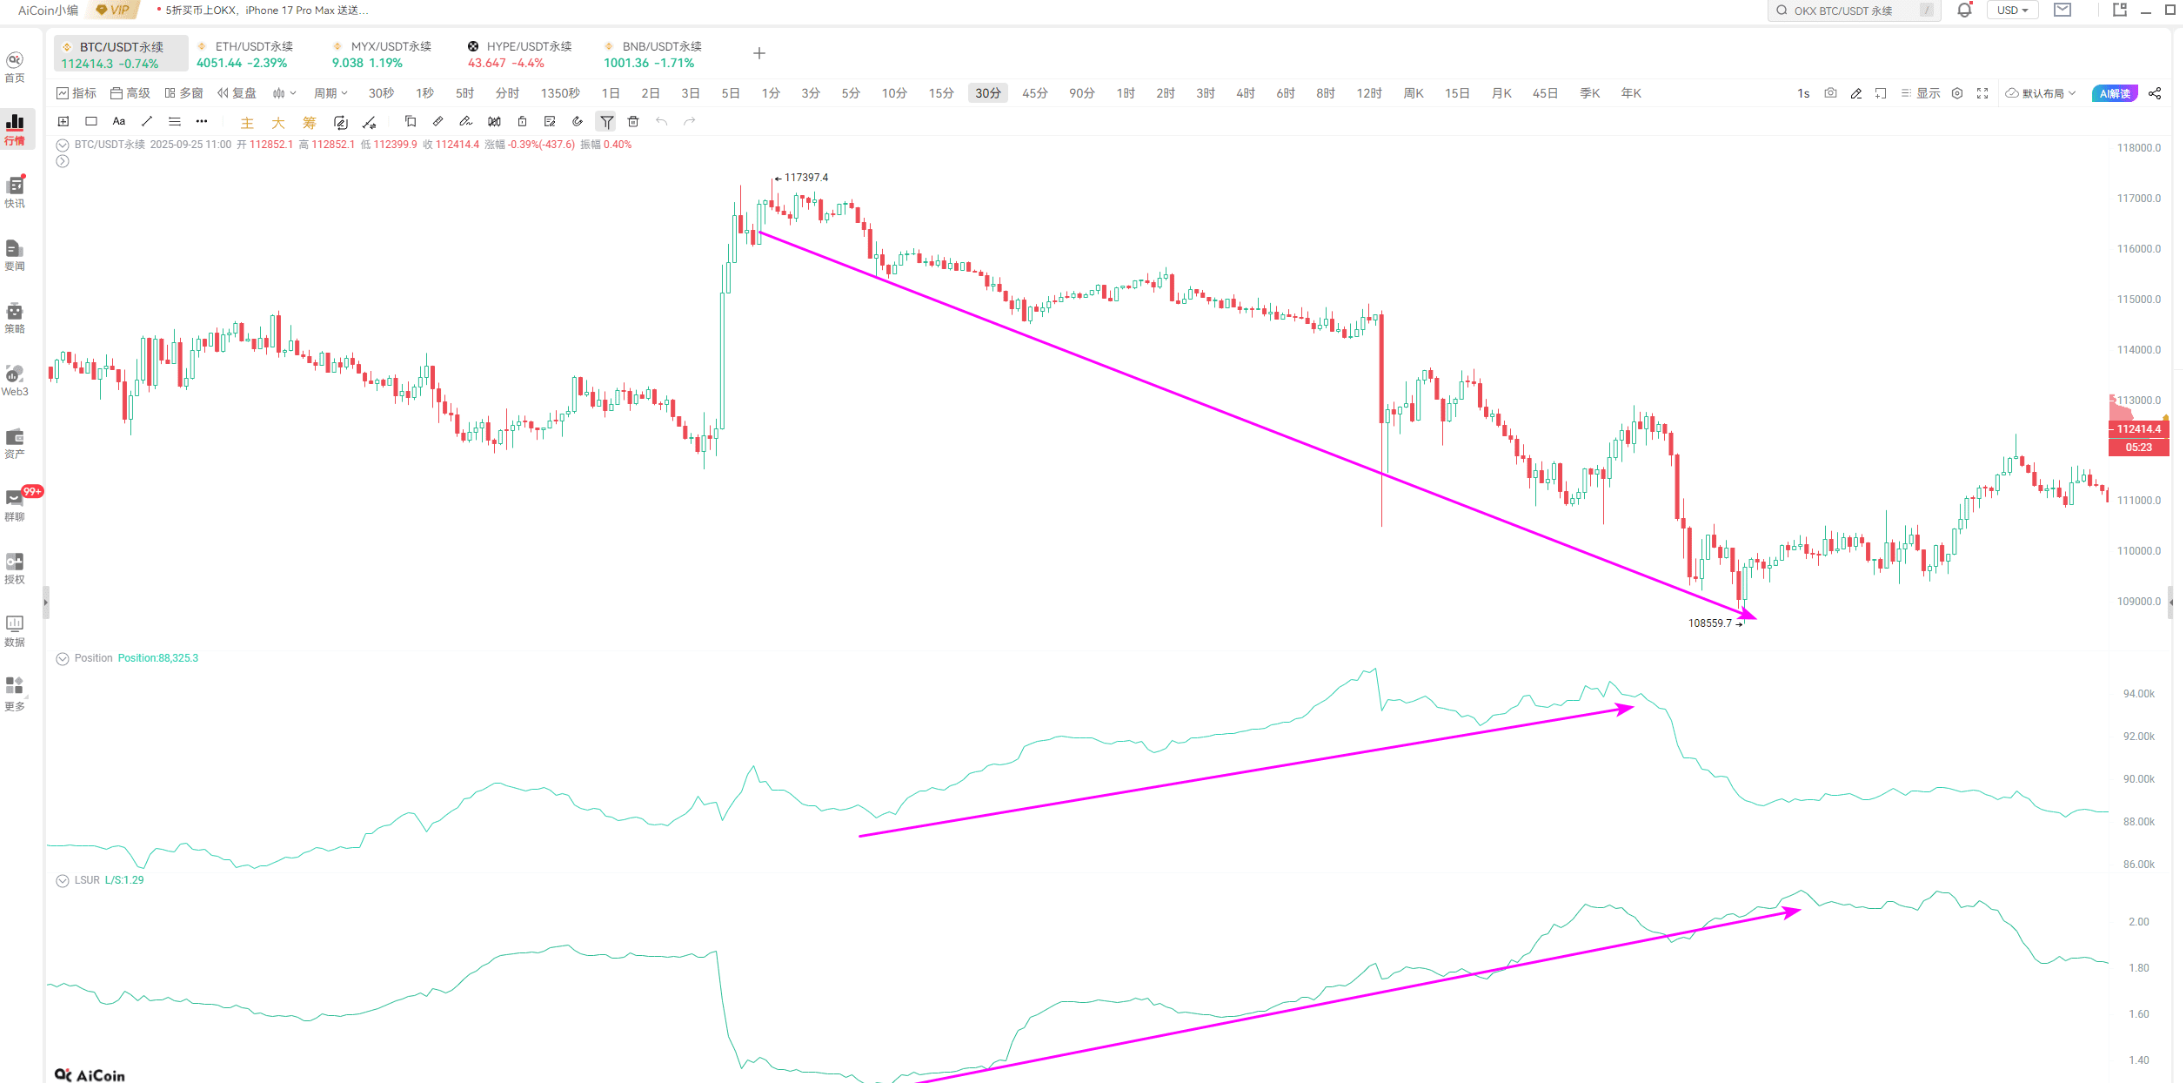
持仓量增加,说明有新仓位进场;LSUR 上涨,代表散户在抄底。这种一般是主力利用散户抄底资金继续打压价格。
情景 4:价格跌 + 持仓量跌 + LSUR 涨。
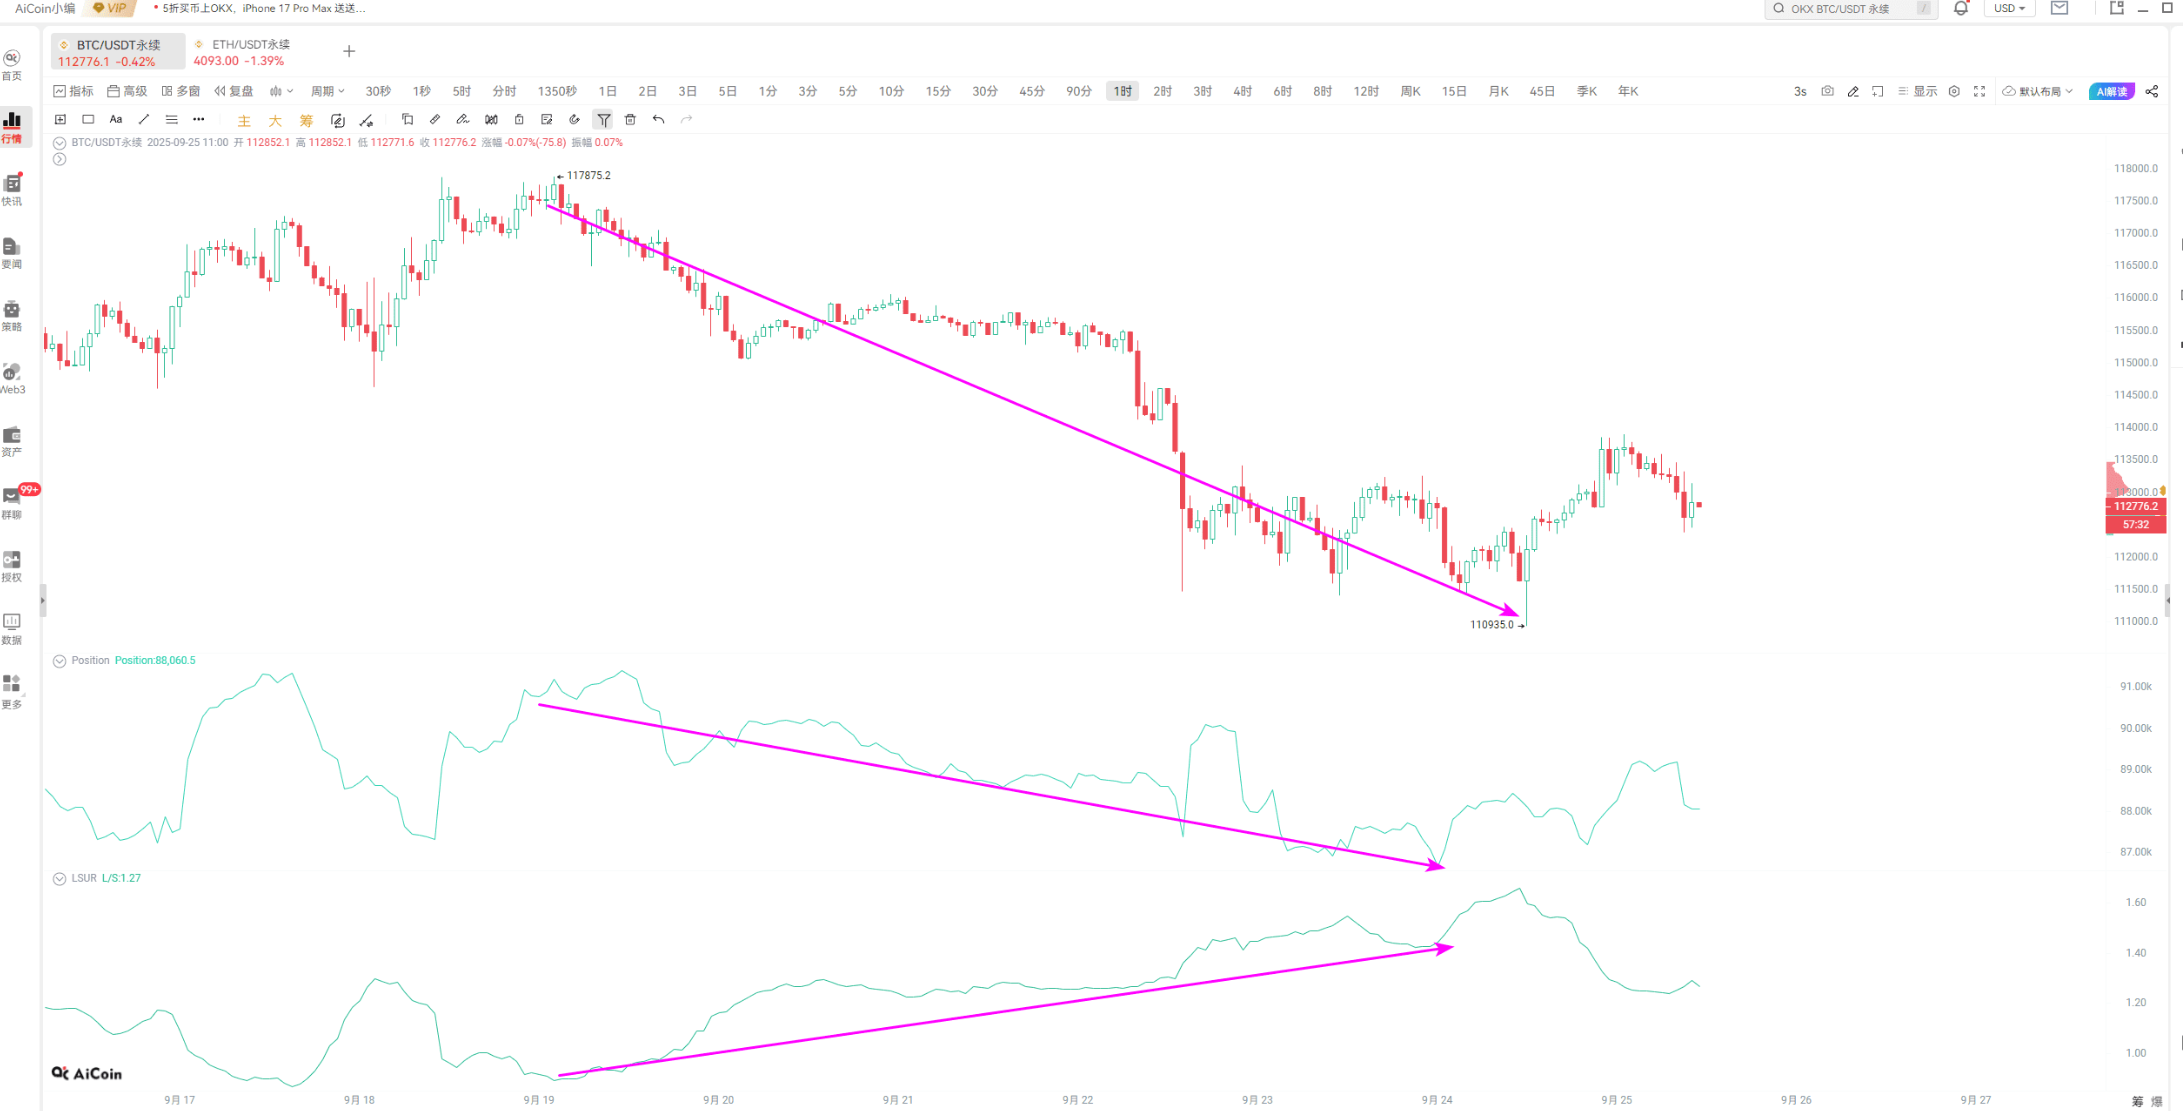
这里还是散户在做多,但 LSUR 上涨说明做多的人在增加,持仓却没增加,意味着主力没进场。和情景 3 不同的是,这种能理解为主力在做空 —— 因为持仓有增加,同时做空的人数少,资金更集中的一方在做空,结合大单看,主力确实在做空。
加入我们的社区,一起来讨论,一起变得更强吧!
官方电报(Telegram)社群:t.me/aicoincn
AiCoin中文推特:https://x.com/AiCoinzh
OKX 福利群:https://aicoin.com/link/chat?cid=l61eM4owQ
币安福利群:https://aicoin.com/link/chat?cid=7JmRjnl3w
本文章仅代表作者个人观点,不代表本平台的立场和观点。本文章仅供信息分享,不构成对任何人的任何投资建议。
免责声明:本文章仅代表作者个人观点,不代表本平台的立场和观点。本文章仅供信息分享,不构成对任何人的任何投资建议。用户与作者之间的任何争议,与本平台无关。如网页中刊载的文章或图片涉及侵权,请提供相关的权利证明和身份证明发送邮件到support@aicoin.com,本平台相关工作人员将会进行核查。