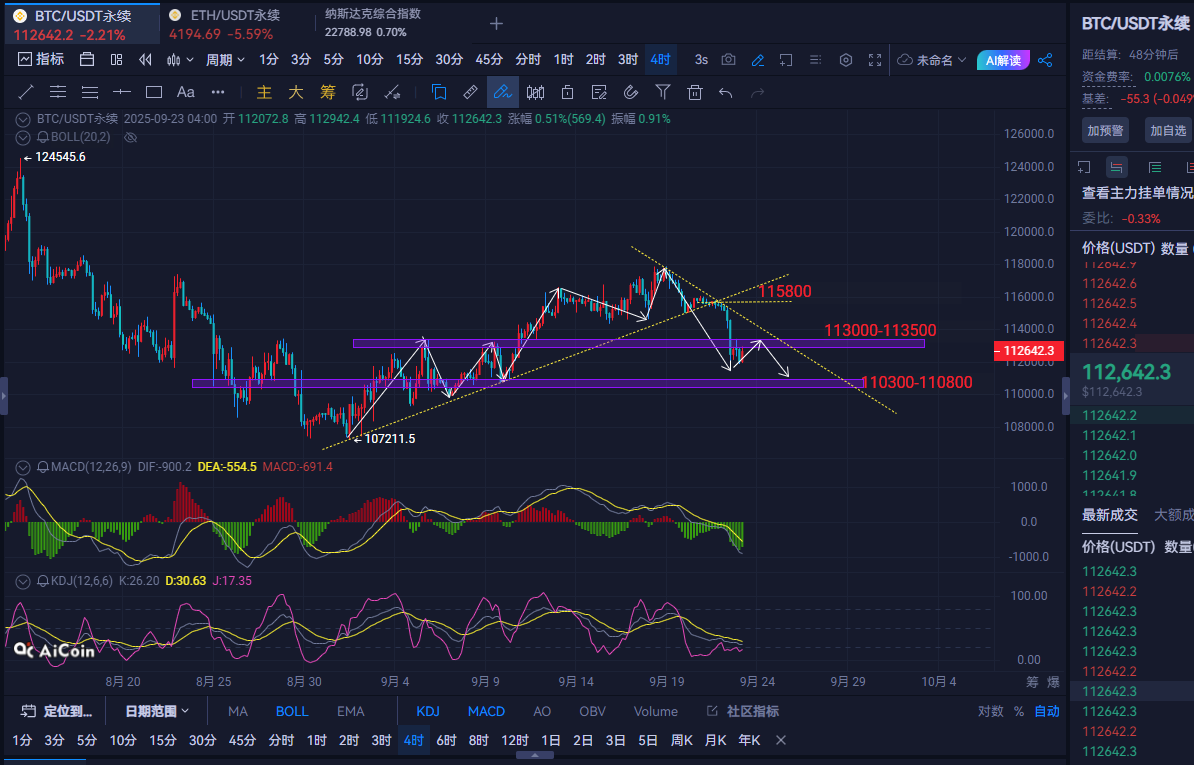
早间分析:从4小时图看,大饼价格在跌破多个支撑最低在111400一线止跌后行情短暂弱反弹后,盘面出现根带较长上影线的阴十字星K线,表明上方压制明显,反弹动能薄弱,日内需重点关注上方阻力113000-113500区域。
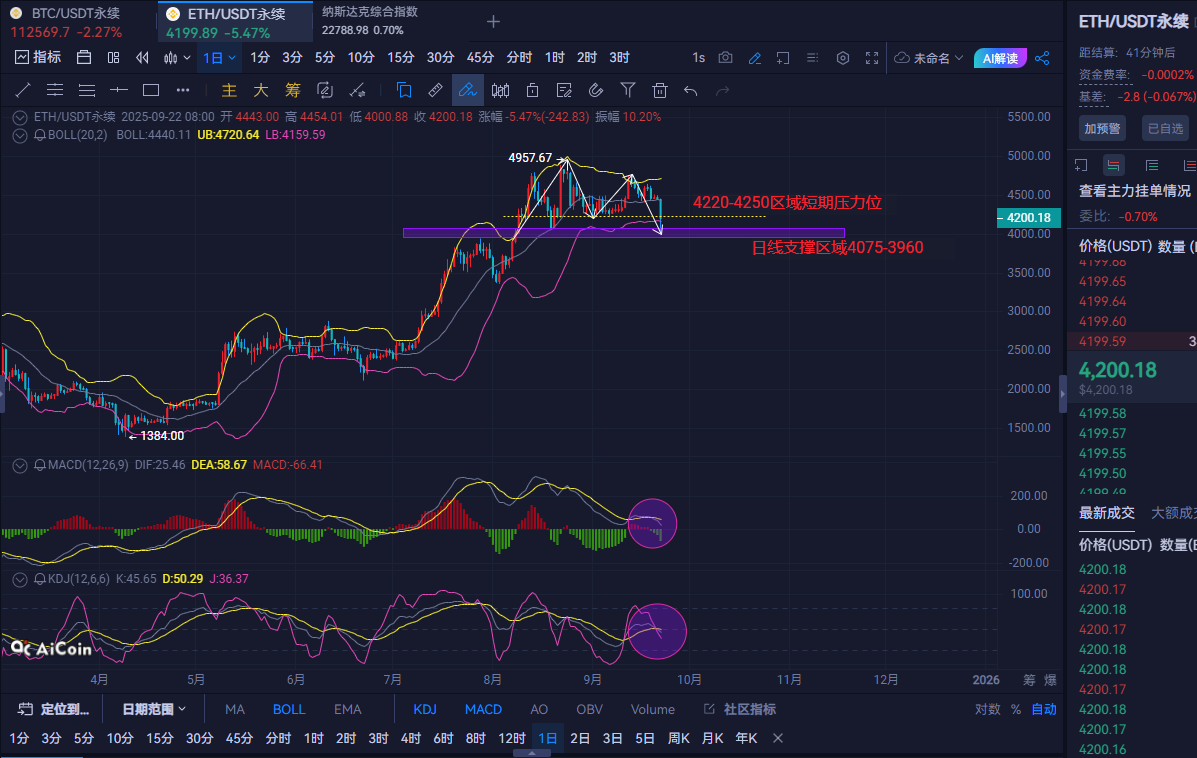
以太坊日线呈现高位回落走势,9月22日形成一根长上影线的阴线,显示上方抛压较重。
9月21日至9月22日连续两天收阴,价格从4450附近快速跌至4100附近后反弹4200附近震荡,短期内上方若不能突破4220-4250区域阻力,行情继续下探4000附近支撑。
技术指标:MACD虽然在零轴之上,但MACD柱状图由红转绿且逐渐扩大,表明多头动能减弱,空头占据优势。
操作建议:大饼反弹113300附近空,防守114100,目标看到111300-111700附近,破位看110800-111000附近,不破接多。
以太坊操作建议:反弹4250附近空,防守4300,目标看到4150-4130附近,破位看4040-4075附近,不破接多。
策略仅供参考,投资请谨慎,落袋为安。(跟丹关注公众号:以太凯)
免责声明:本文章仅代表作者个人观点,不代表本平台的立场和观点。本文章仅供信息分享,不构成对任何人的任何投资建议。用户与作者之间的任何争议,与本平台无关。如网页中刊载的文章或图片涉及侵权,请提供相关的权利证明和身份证明发送邮件到support@aicoin.com,本平台相关工作人员将会进行核查。


