Original |10x Research
Compiled | Odaily Planet Daily (@OdailyChina)
Translator| Dingdang (@XiaMiPP)

On the surface, Bitcoin appears calm, but the options market is releasing signals that few have noticed. There has been a significant shift in capital flow—traders are continuously selling volatility, and the positioning seems "smooth sailing." Meanwhile, key buyers who once dominated demand are restricted, and new beneficiaries are beginning to emerge.
The compression of net asset value (NAV), accelerated adoption of stablecoins, and divergence in liquidity are creating a market environment that has not been seen so far this year. The current consolidation is likely the calm before the storm. The question is: who will be on the right side of the next market wave?
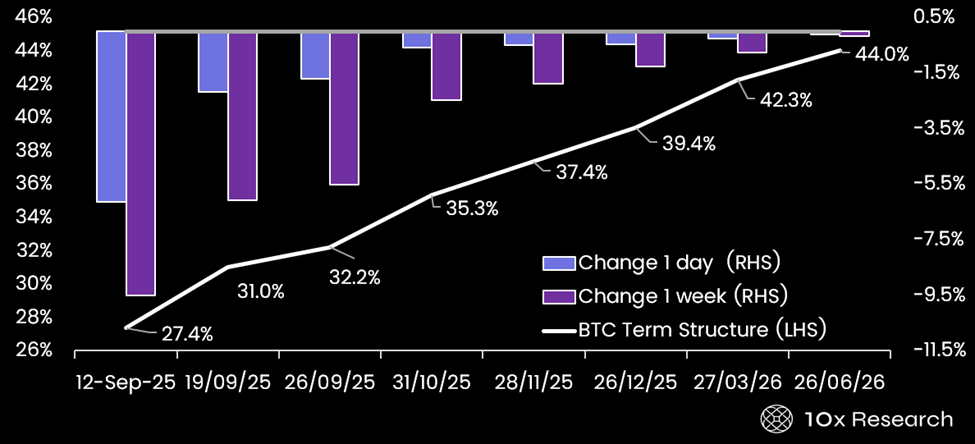
Bitcoin implied volatility (left axis) has significantly declined (right axis)
Core Insights
Bitcoin is never dull; market sentiment often changes in an instant. The rich data dimensions make the crypto market highly valuable for research, and the logic of gaining information advantages is similar to traditional markets. The difference is that most data in the crypto market is public, and the key lies in having the right channels (usually professional paid versions) and the ability to efficiently integrate at the right time.
After the PPI was below expectations last Wednesday and the CPI met expectations on Thursday, Bitcoin and Ethereum options experienced significant bullish repricing. The market has digested expectations for three interest rate cuts this year. Short-term implied volatility has significantly declined, with BTC dropping 6% on contracts expiring on September 12, and ETH down 12%, leading to an overall downward shift in the term structure.
Risk Reversal indicators have also risen; while late September remains a relatively low point, the magnitude is not as pronounced as before. Interestingly, the forward upward skew for Ethereum in Q2 2026 has weakened, indicating that traders' optimism about extreme long-term increases has decreased, even though short-term pessimistic expectations have largely been digested.
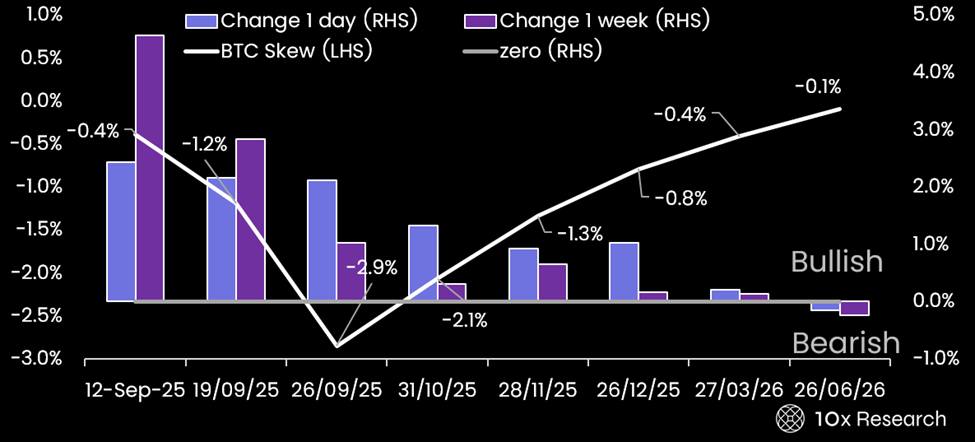
Bitcoin risk reversal (left axis) repricing upward (right axis) — bullish signal
Options and Capital Flow
In the past week, BTC options trading has been primarily dominated by selling call options, accounting for 27.3% of the total nominal trading volume; on the ETH side, selling put options was predominant, accounting for 32.2%. The market is clearly dominated by volatility sellers, which has suppressed implied volatility but also highlighted a lack of effective upward leverage deployment. Despite ETH having a higher Beta, traders are more willing to sell downside risk rather than upside, and in BTC, they tend to believe that the upside potential is limited.
MicroStrategy: Constraints of NAV Compression
One of the most active buyers of Bitcoin—MicroStrategy, is constrained by net asset value (NAV) compression. This was anticipated as early as when volatility declined in the summer. Since June 2025, MSTR's NAV multiple has dropped from 1.75 to 1.24.
We pointed out in June that when NAV approaches 1.5 times, the company's ability to repurchase Bitcoin would rapidly decline: financing capabilities are limited, and retail demand for premiums tends to saturate. It is important to emphasize that we focus on NAV (corresponding to market value), rather than the mNAV (slightly higher) that includes enterprise value.
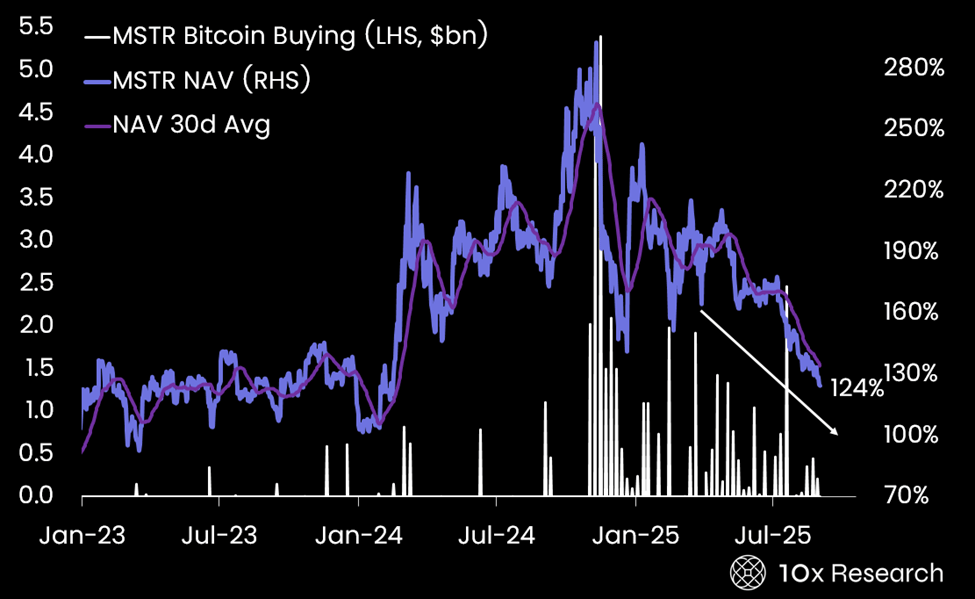
MicroStrategy's Bitcoin purchase volume (left axis, in billions) vs. net asset value (right axis)
Aside from a few preferred stock issuances, MicroStrategy has made almost no new Bitcoin purchases this summer. In the three and a half months since June 1, the company has only raised $4.2 billion, far below $5.4 billion on November 25, 2024, and $4.6 billion on November 18. The past "golden age" of financing is gone.
Of the company's total financing of $43 billion, $19.9 billion came from premiums paid by investors—these values have almost evaporated. Many investors who bought at a 2x NAV multiple have suffered heavy losses.
During Bitcoin's roughly sideways movement, MSTR's NAV has clearly entered a bear market. In the crypto world, there always seems to be a corner in a bear market. If Bitcoin volatility cannot significantly rebound, it will be extremely difficult to rebuild NAV premiums. Meanwhile, MSTR's average daily trading volume has dropped from a peak of $14 billion in November 2024 to $3.5 billion, and recently closer to $2.4 billion.
The business model that relies on high multiple NAV and high volatility to extract value from retail investors is collapsing. In the past, high volatility attracted not only retail but also institutional investors, especially convertible bond buyers, due to the embedded call options being undervalued. Now, with the disappearance of these two advantages and investors seeking alternative crypto exposure, the era of Bitcoin "treasury-type" companies relying on equity financing to hoard coins is hard to replicate.
It is not surprising that MSTR's stock price has fallen from $400 to $326; we have warned of correction risks in several previous reports. Now that resistance has basically eased, NAV has compressed to reasonable levels, and MicroStrategy's relative valuation to BTC has dropped by 22%, approaching historical bottom ranges. Technical indicators are oversold, and further downside potential is limited, even compared to our initial target of $300.
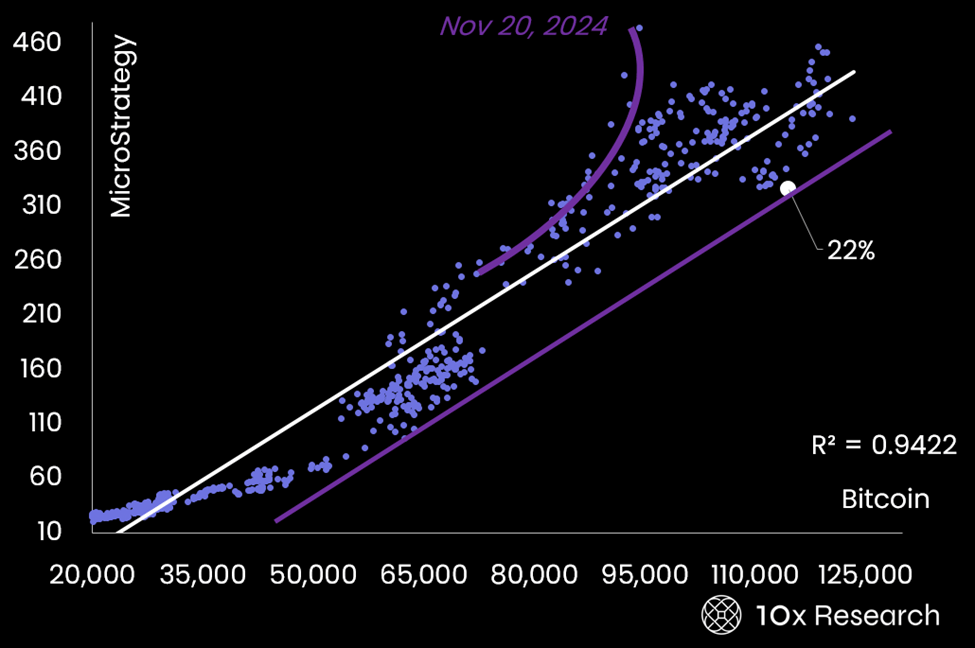
MSTR vs. BTC relative valuation: close to the bottom
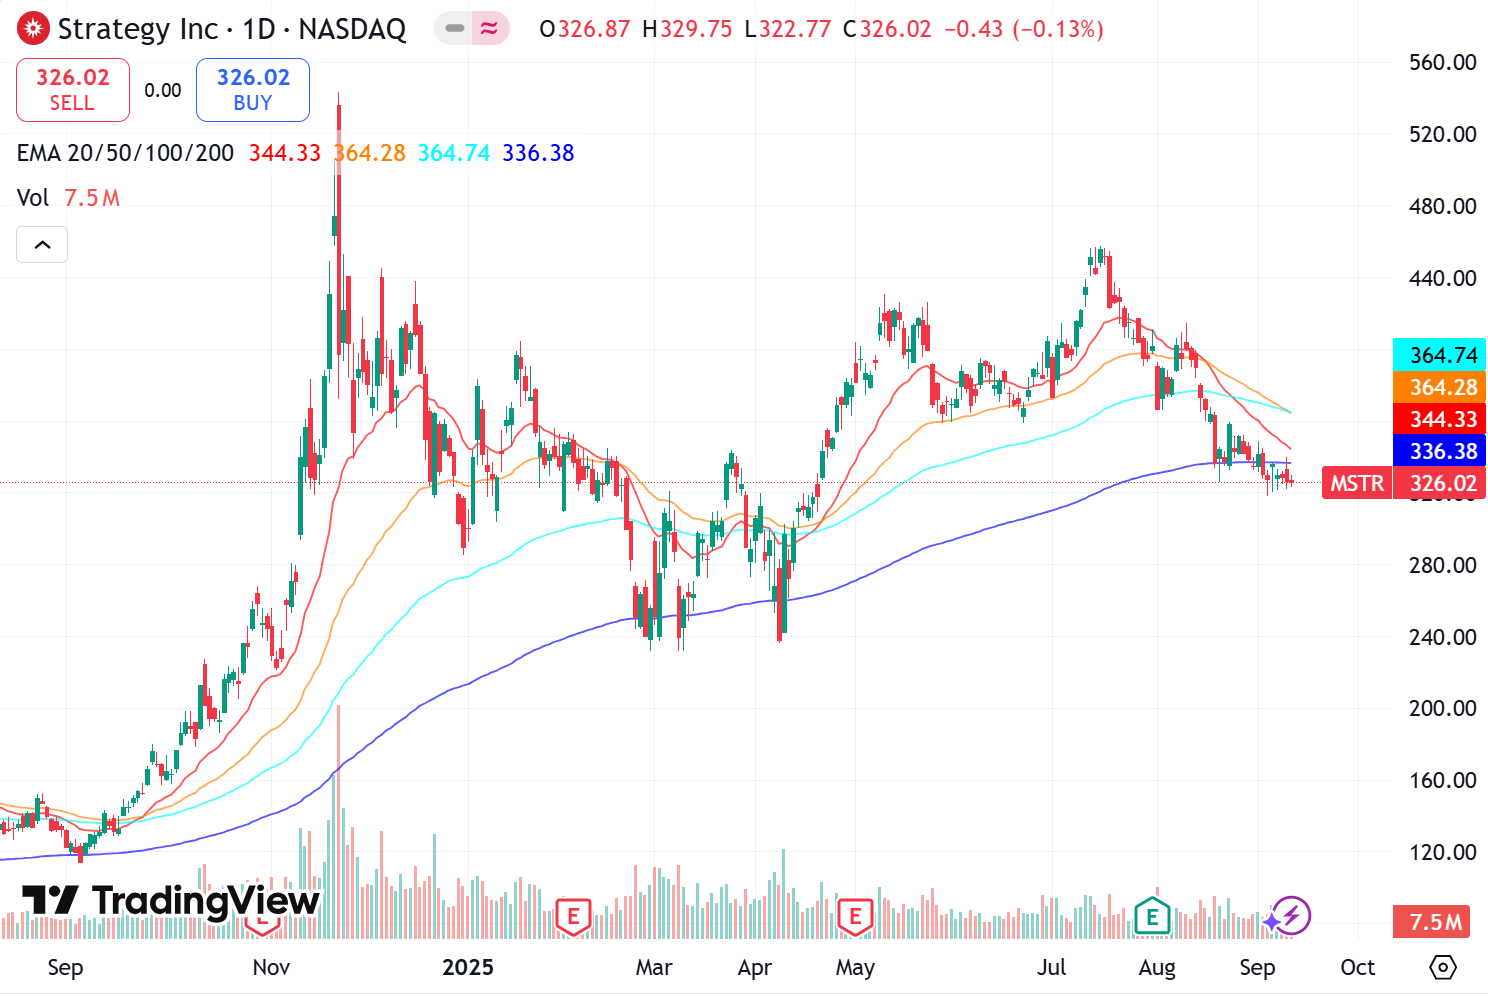
MSTR price trend
Metaplanet: Attractive Pricing
We also held a bearish stance on Metaplanet in June, and the stock subsequently plummeted 66% due to concerns over potential changes in Japan's crypto tax policy, diminishing its appeal as a Bitcoin alternative.
Nevertheless, Metaplanet's NAV multiple remains at 1.5 (down from 6), and the stock price is highly volatile intraday. Driven by retail funds, the stock remains extremely unstable. However, its market value has dropped from $596,000 when we issued the bearish report to $173,000, gradually appearing more attractive.
Odaily Planet Daily adds: Currently, Metaplanet has seen trading volume increase for three consecutive days, but the price has not experienced further significant declines, and a bottom structure may be anticipated soon.
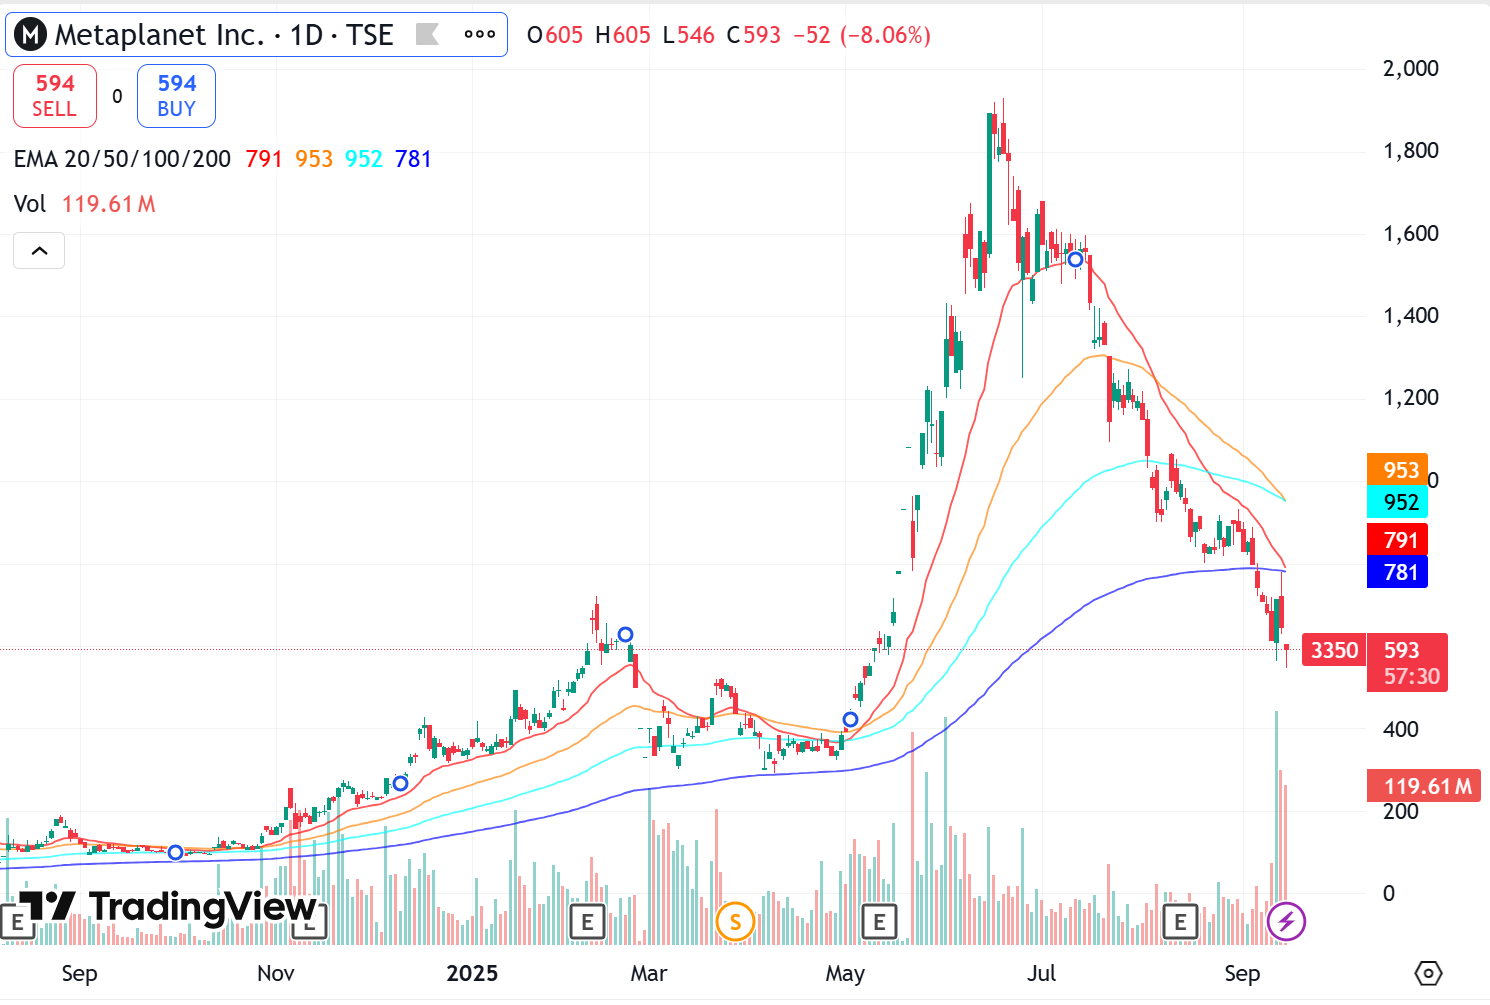
MTPLF price chart
Circle: Becoming the New Winner
In contrast, we have recently favored Circle, whose stock price has fallen 63% from its peak. We had been waiting for it to drop to around $100, and when the stock price fell to $112 on September 9, it triggered a buy signal. We also expect that this week's inflation data will bring macro tailwinds, potentially leading to a squeeze in Bitcoin.
Since the report was published on September 9, Circle has risen 19.6%. The reason is that expectations of interest rate cuts by the Federal Reserve have boosted liquidity and accelerated the adoption of stablecoins. We reiterate our "buy" rating with a target price of $247. Circle's collaboration with Finastra to integrate USDC into the global banking system further strengthens its adoption prospects.
We are pleased to have captured this wave early and correctly anticipated that the inflation data would shift macro sentiment from headwinds to tailwinds, thus driving Circle's rebound and Bitcoin's upward attempts. Notably, Circle has even lagged behind Coinbase in this round of adjustments, while we believe Circle is more attractive and has significant room for catch-up.
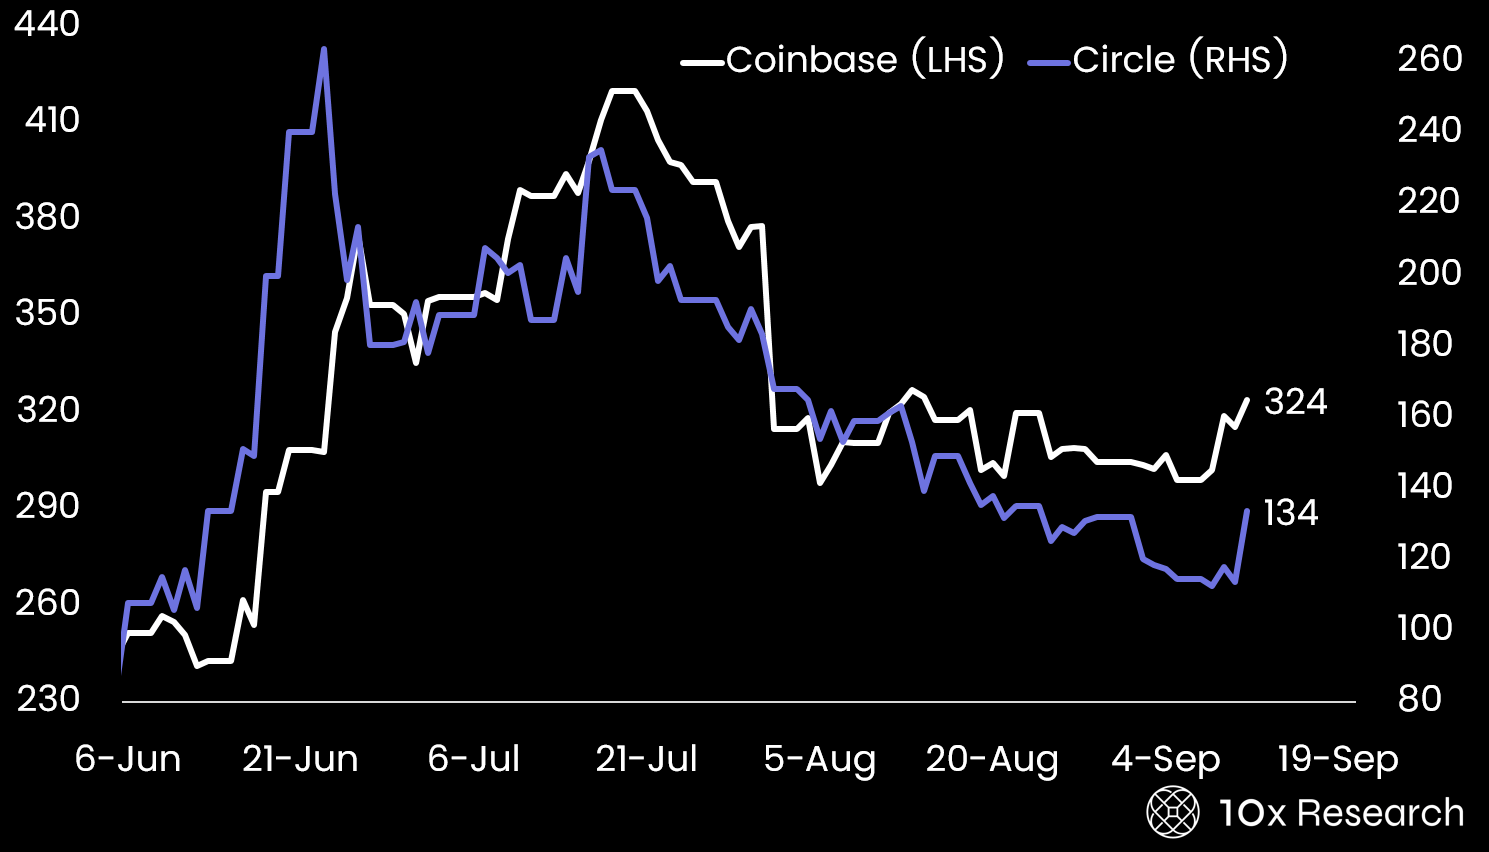
Coinbase (left axis) vs. Circle (right axis)
Odaily Planet Daily adds: Circle (CRCL) stock price has recently achieved a significant volume breakout on the daily chart, and it seems poised to enter an upward channel in the short term.
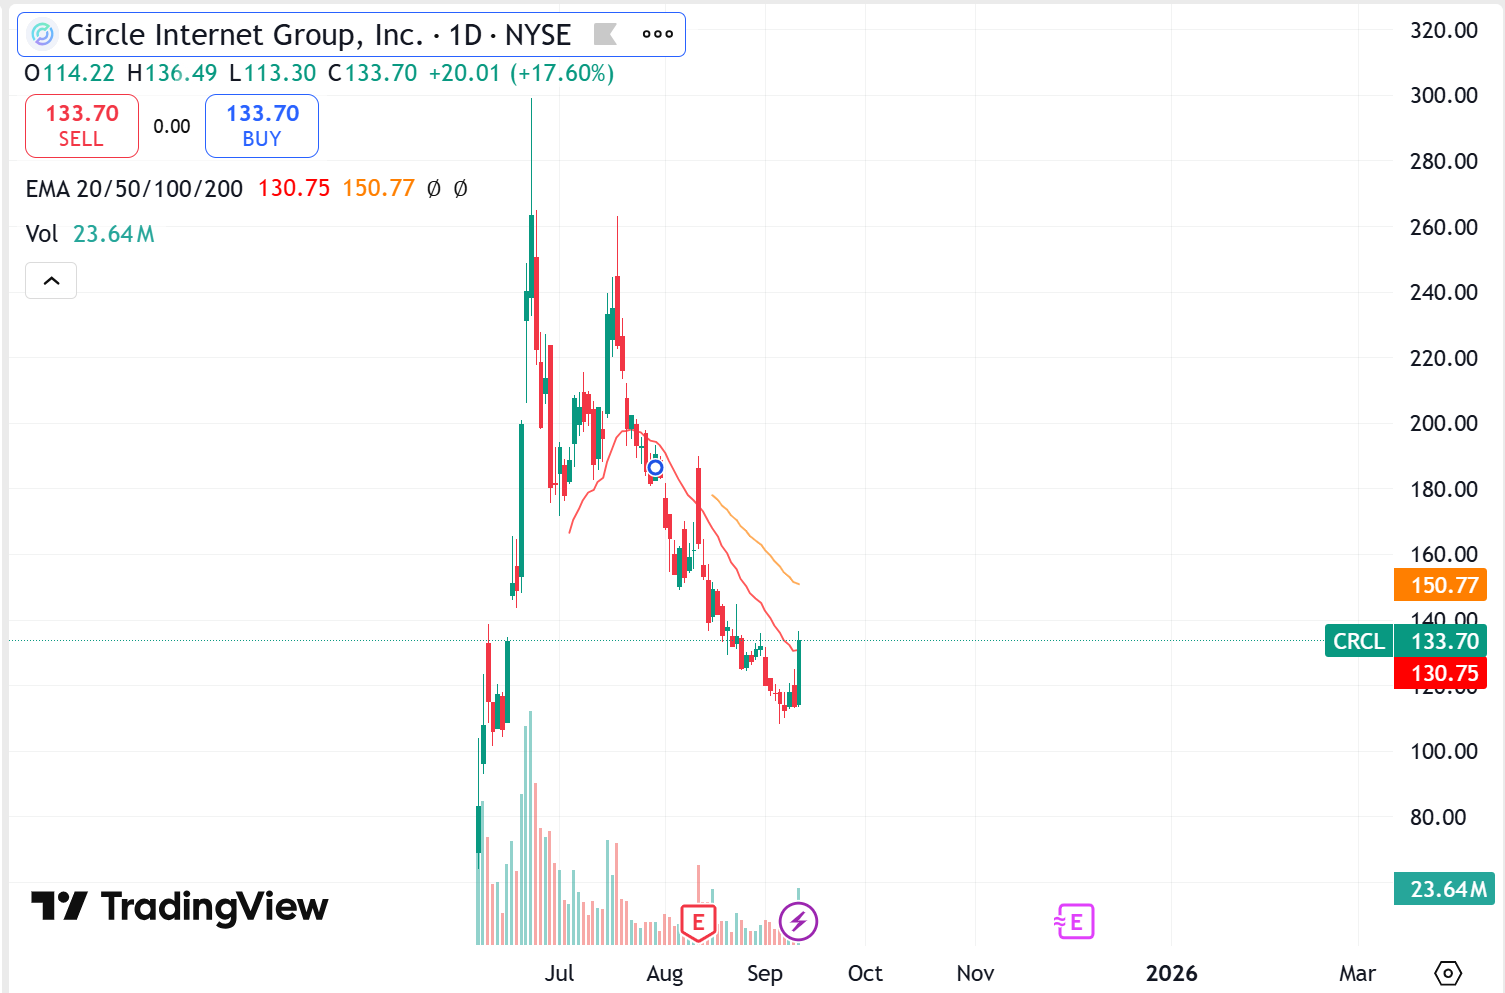
CRCL price chart
Conclusion
Behind Bitcoin's sideways movement, a deep transformation of capital flow and positioning is brewing, which may lay the groundwork for the next upward wave. As MicroStrategy faces constraints and Circle gains momentum, capital is flowing toward truly opportunistic targets. A large amount of volatility selling has suppressed implied volatility, but it also makes the market more susceptible to a short squeeze—because once a squeeze is triggered, the upward movement will be exceptionally fierce.
Circle's rebound indicates that once liquidity tailwinds return, the speed of sentiment reversal may exceed expectations. And when the tide comes in, some targets are destined to run faster than others.
免责声明:本文章仅代表作者个人观点,不代表本平台的立场和观点。本文章仅供信息分享,不构成对任何人的任何投资建议。用户与作者之间的任何争议,与本平台无关。如网页中刊载的文章或图片涉及侵权,请提供相关的权利证明和身份证明发送邮件到support@aicoin.com,本平台相关工作人员将会进行核查。


