Bitcoin Price Watch: Bear Market Bounce or True Reversal? All Eyes on Volume

CN
2 hours ago

Bitcoin remains below key resistance, signaling caution. The trend has shifted across timeframes, but volume lacks the strength needed to confirm a macro reversal. A deeper pullback or breakout will likely define the next leg.

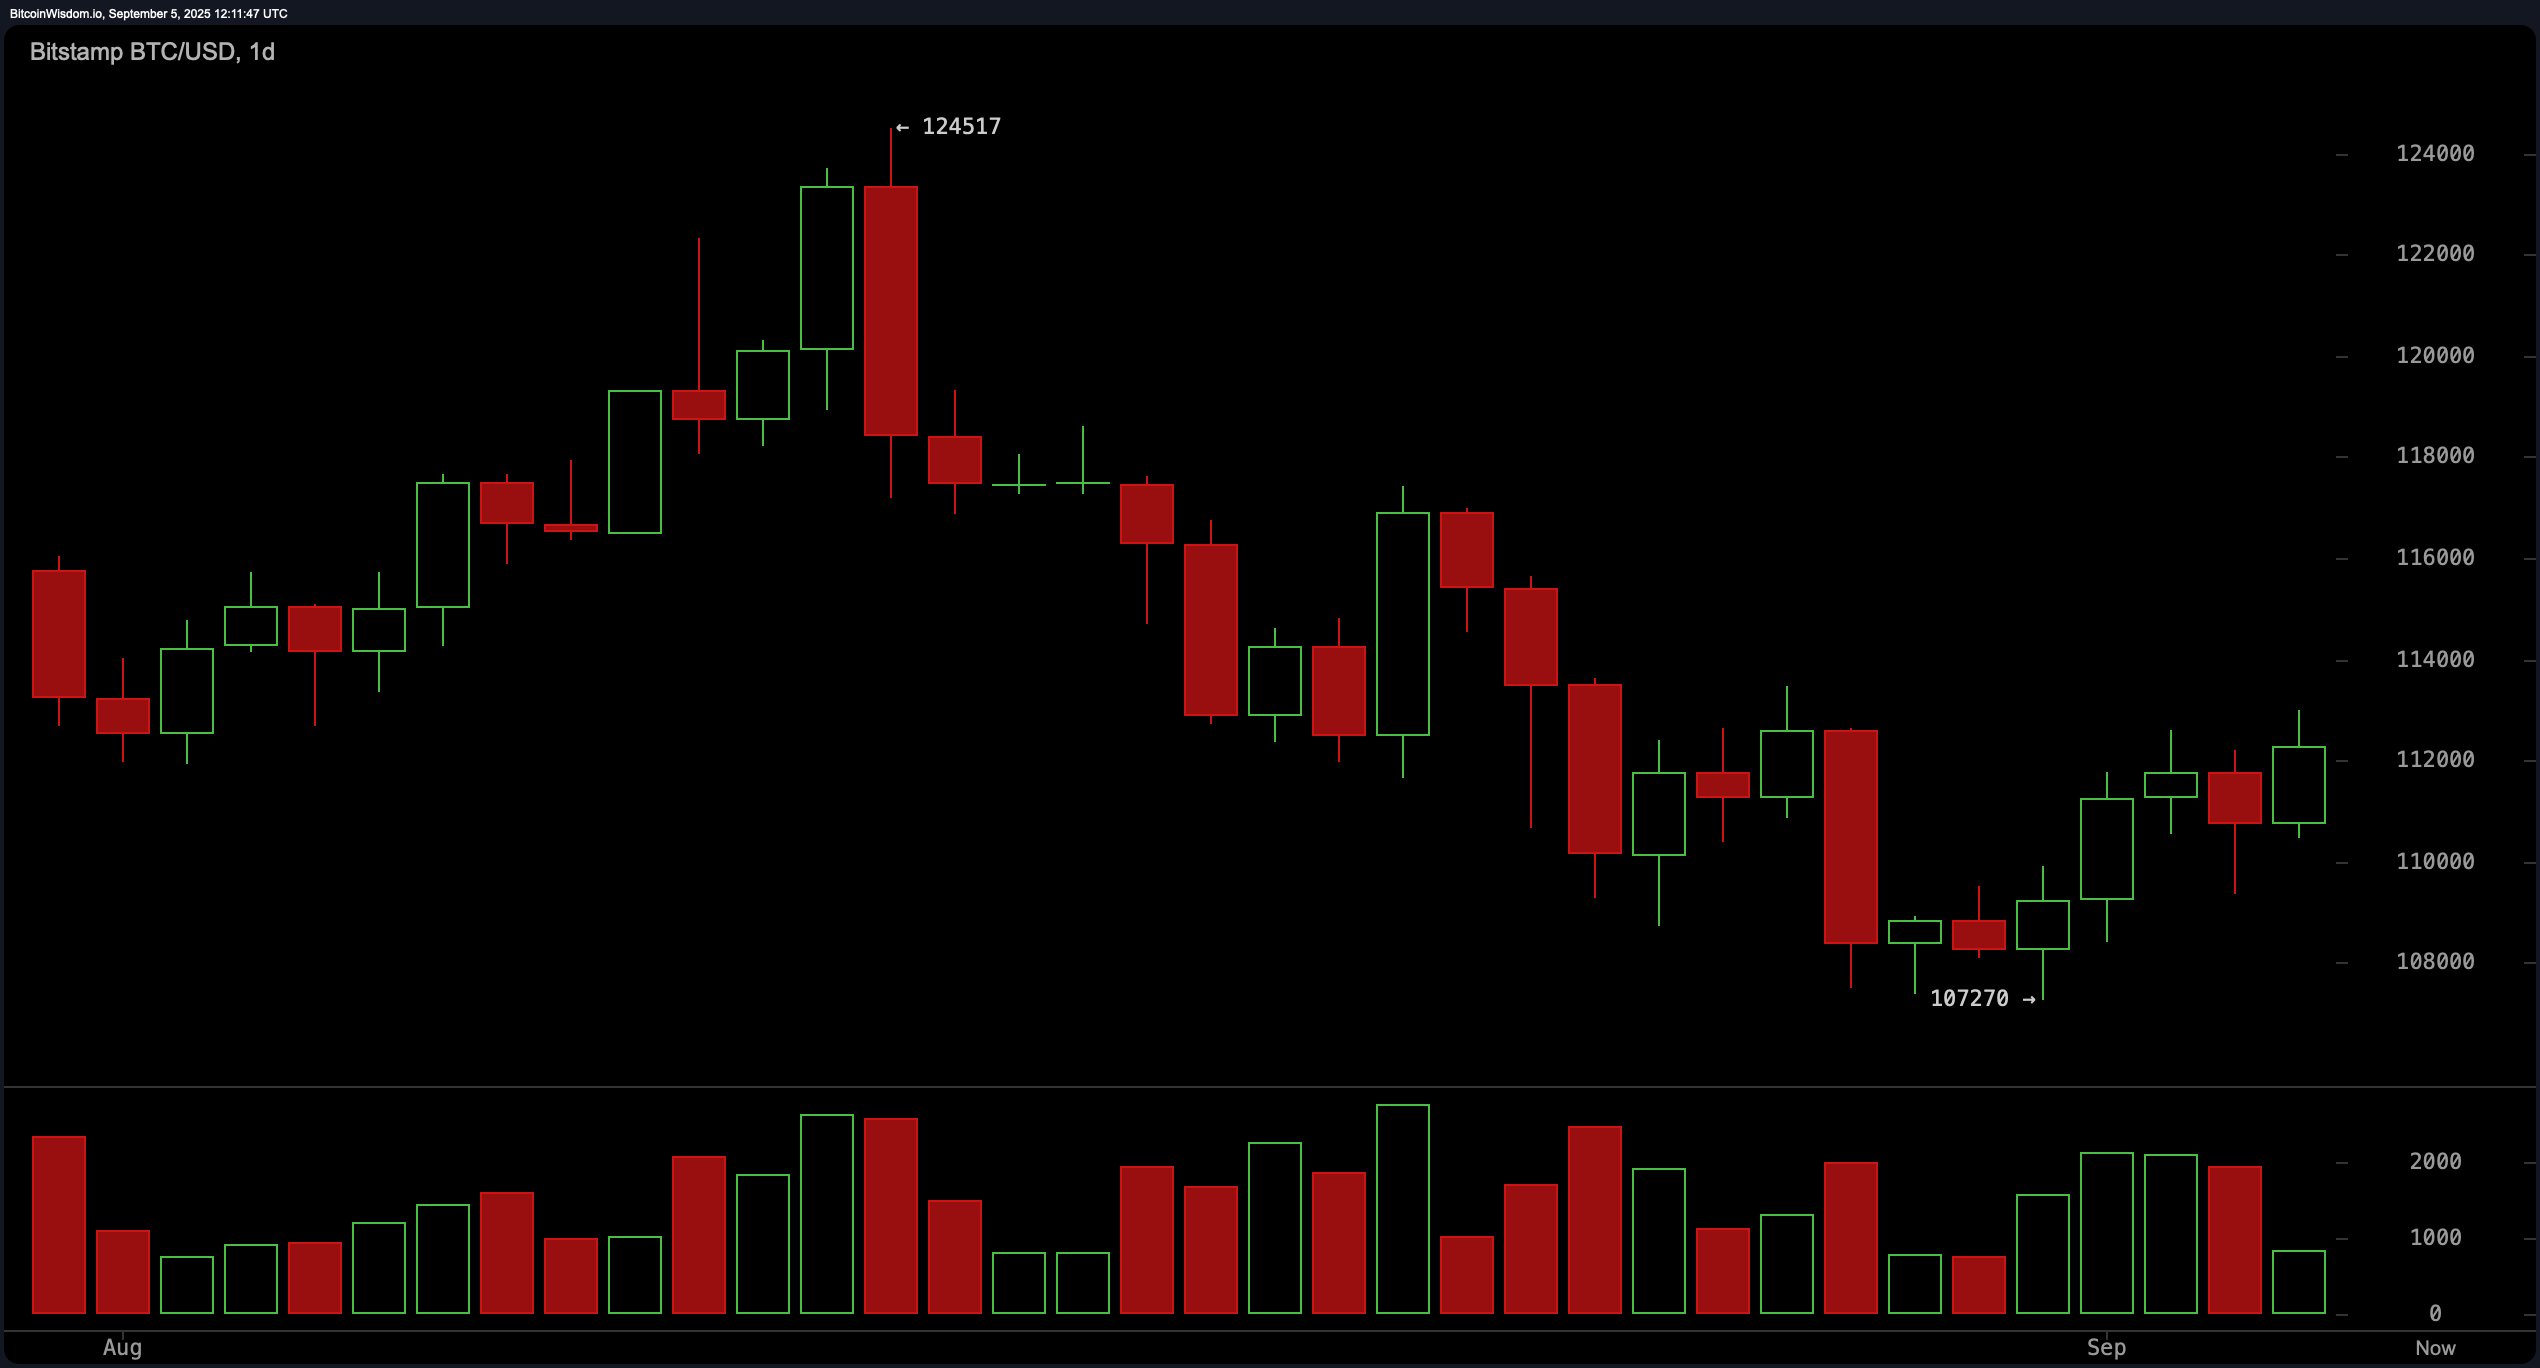
The daily bitcoin chart shows a clear downtrend from a peak of $124,517. After hitting a local bottom at $107,270, bitcoin bounced, but the move lacks follow-through. The structure remains bearish, printing lower highs. Resistance sits heavy between $113,000 and $114,000, where sellers stepped in before. Support lies near $107,000, with $105,000 below as a final defense. Buy interest has increased, but not enough to shift the larger trend.

Bitcoin Price Watch: Bear Market Bounce or True Reversal? All Eyes on Volume

BTC/USD 1-day chart via Bitstamp on Sept. 5, 2025.

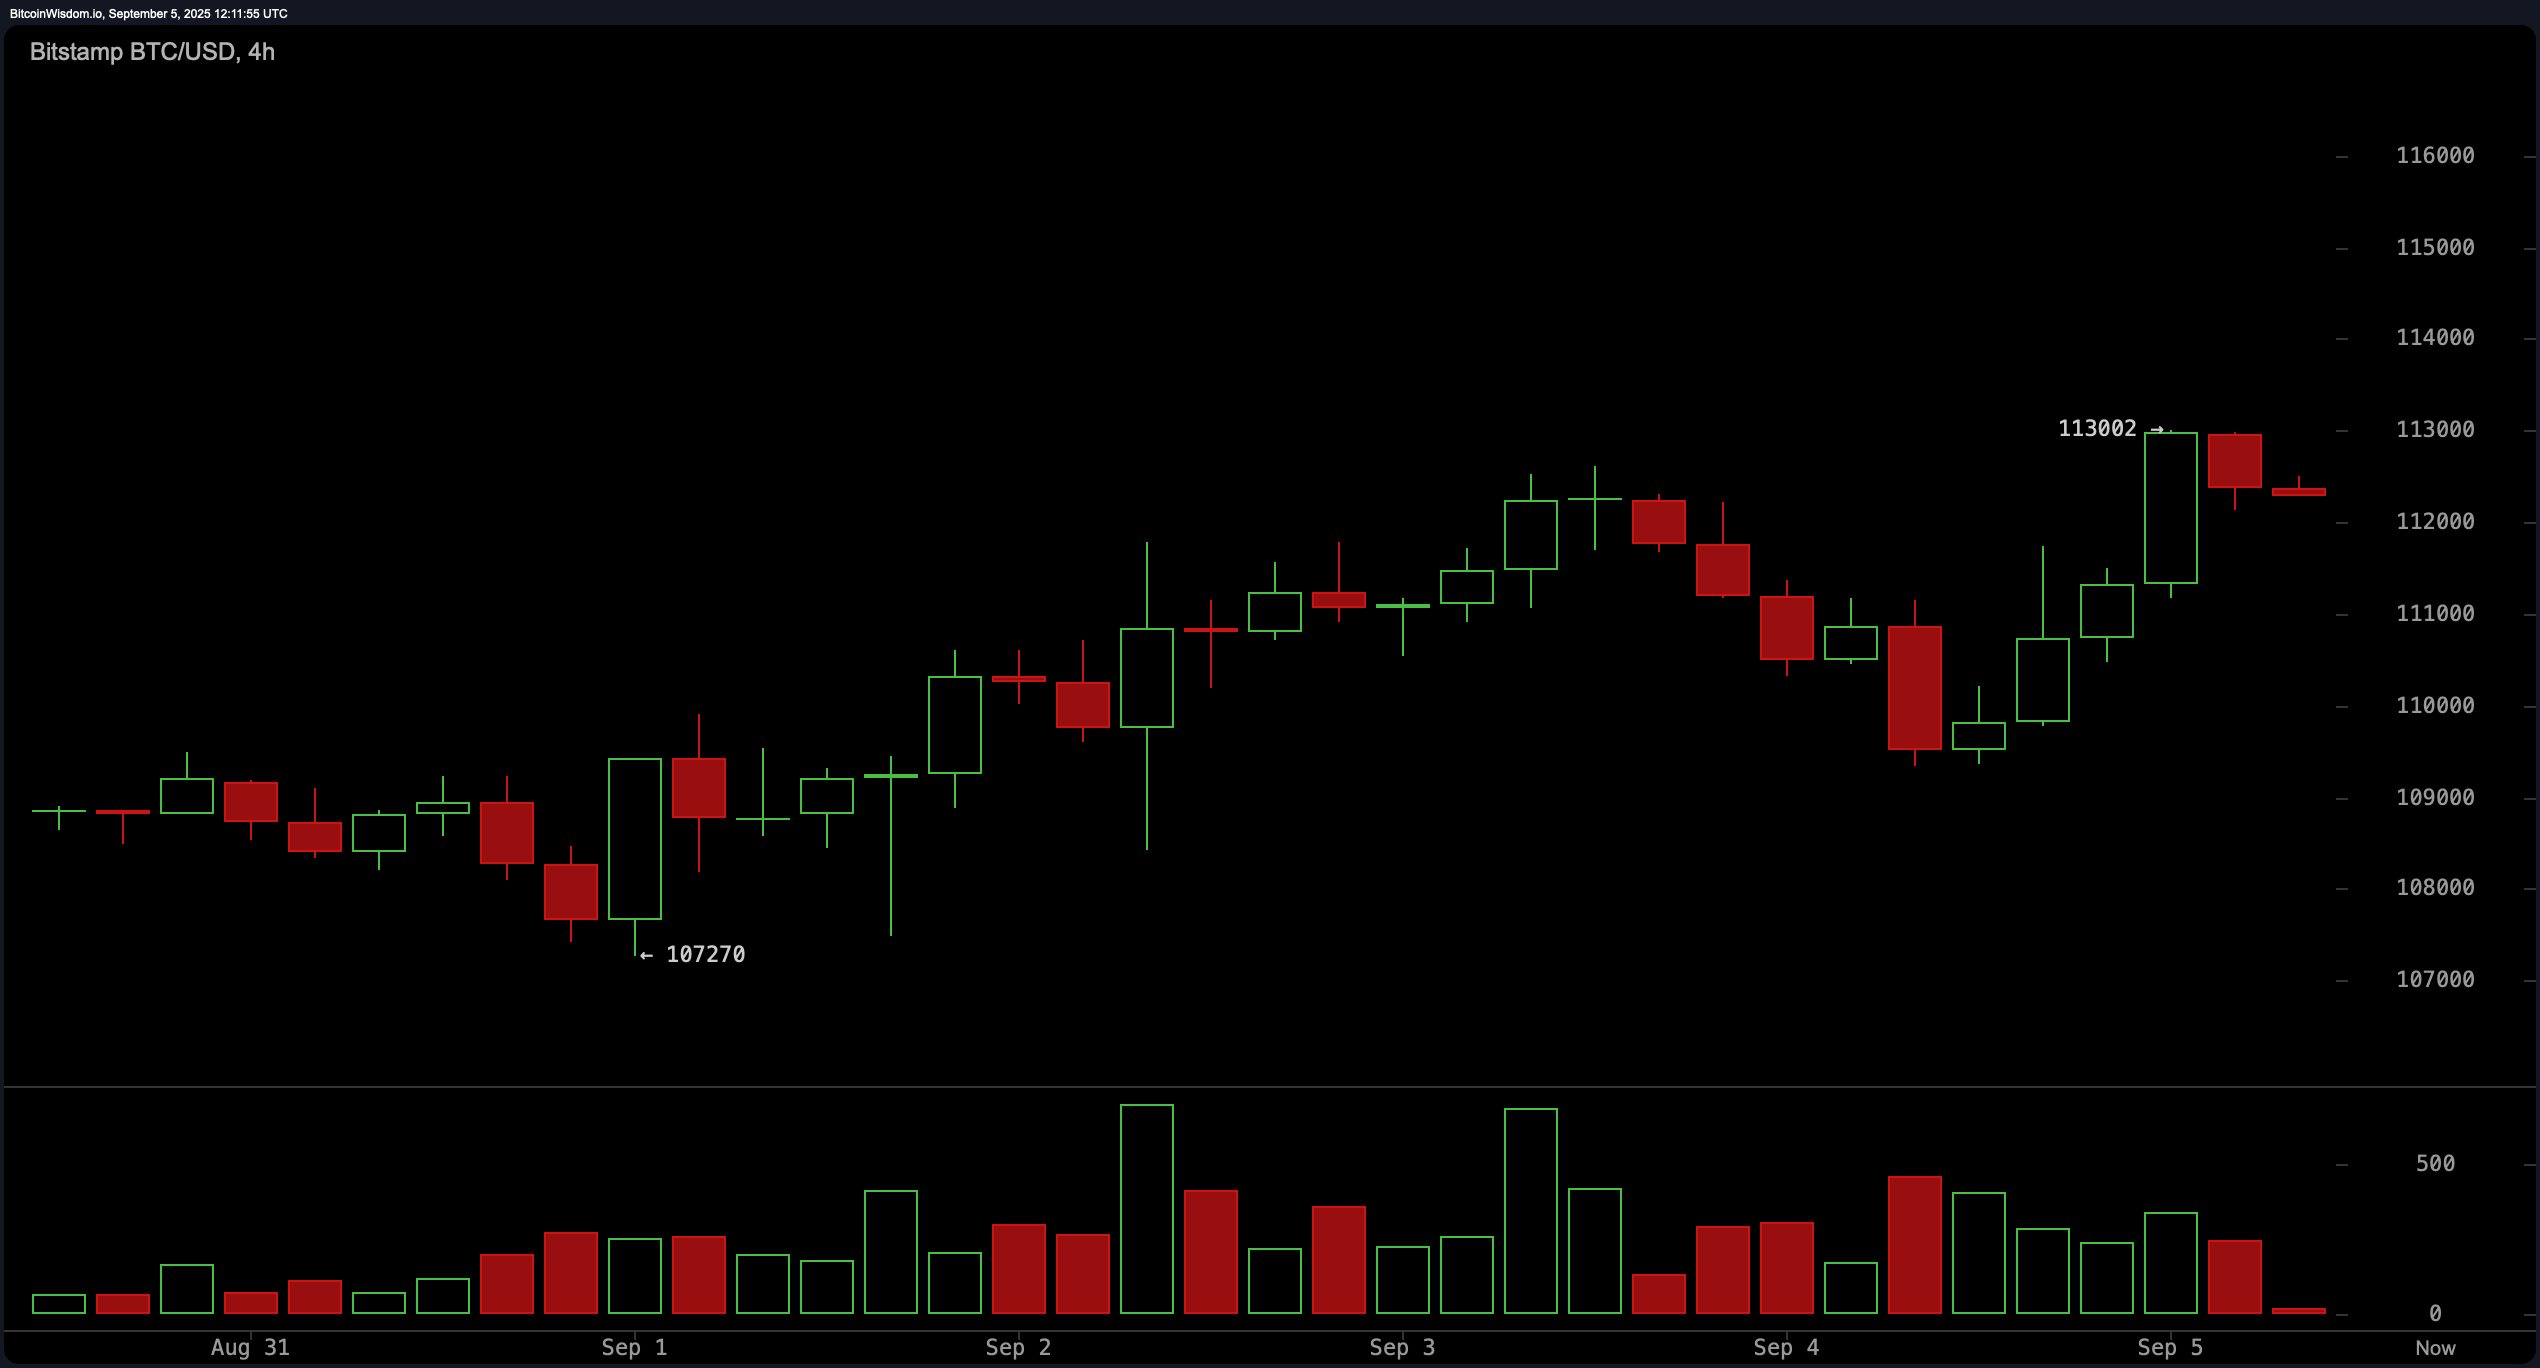
On the 4-hour bitcoin chart, momentum has turned bullish. Bitcoin reclaimed $107,270 and pushed toward $113,002, a key level aligning with the daily resistance. Volume increased during this move, showing buyers returning to the market. A pullback toward $111,000–$111,500 could offer a solid long entry if supported by volume. If resistance at $113,000 fails to break, profit-taking could send prices lower.

Bitcoin Price Watch: Bear Market Bounce or True Reversal? All Eyes on Volume

BTC/USD 4-hour chart via Bitstamp on Sept. 5, 2025.

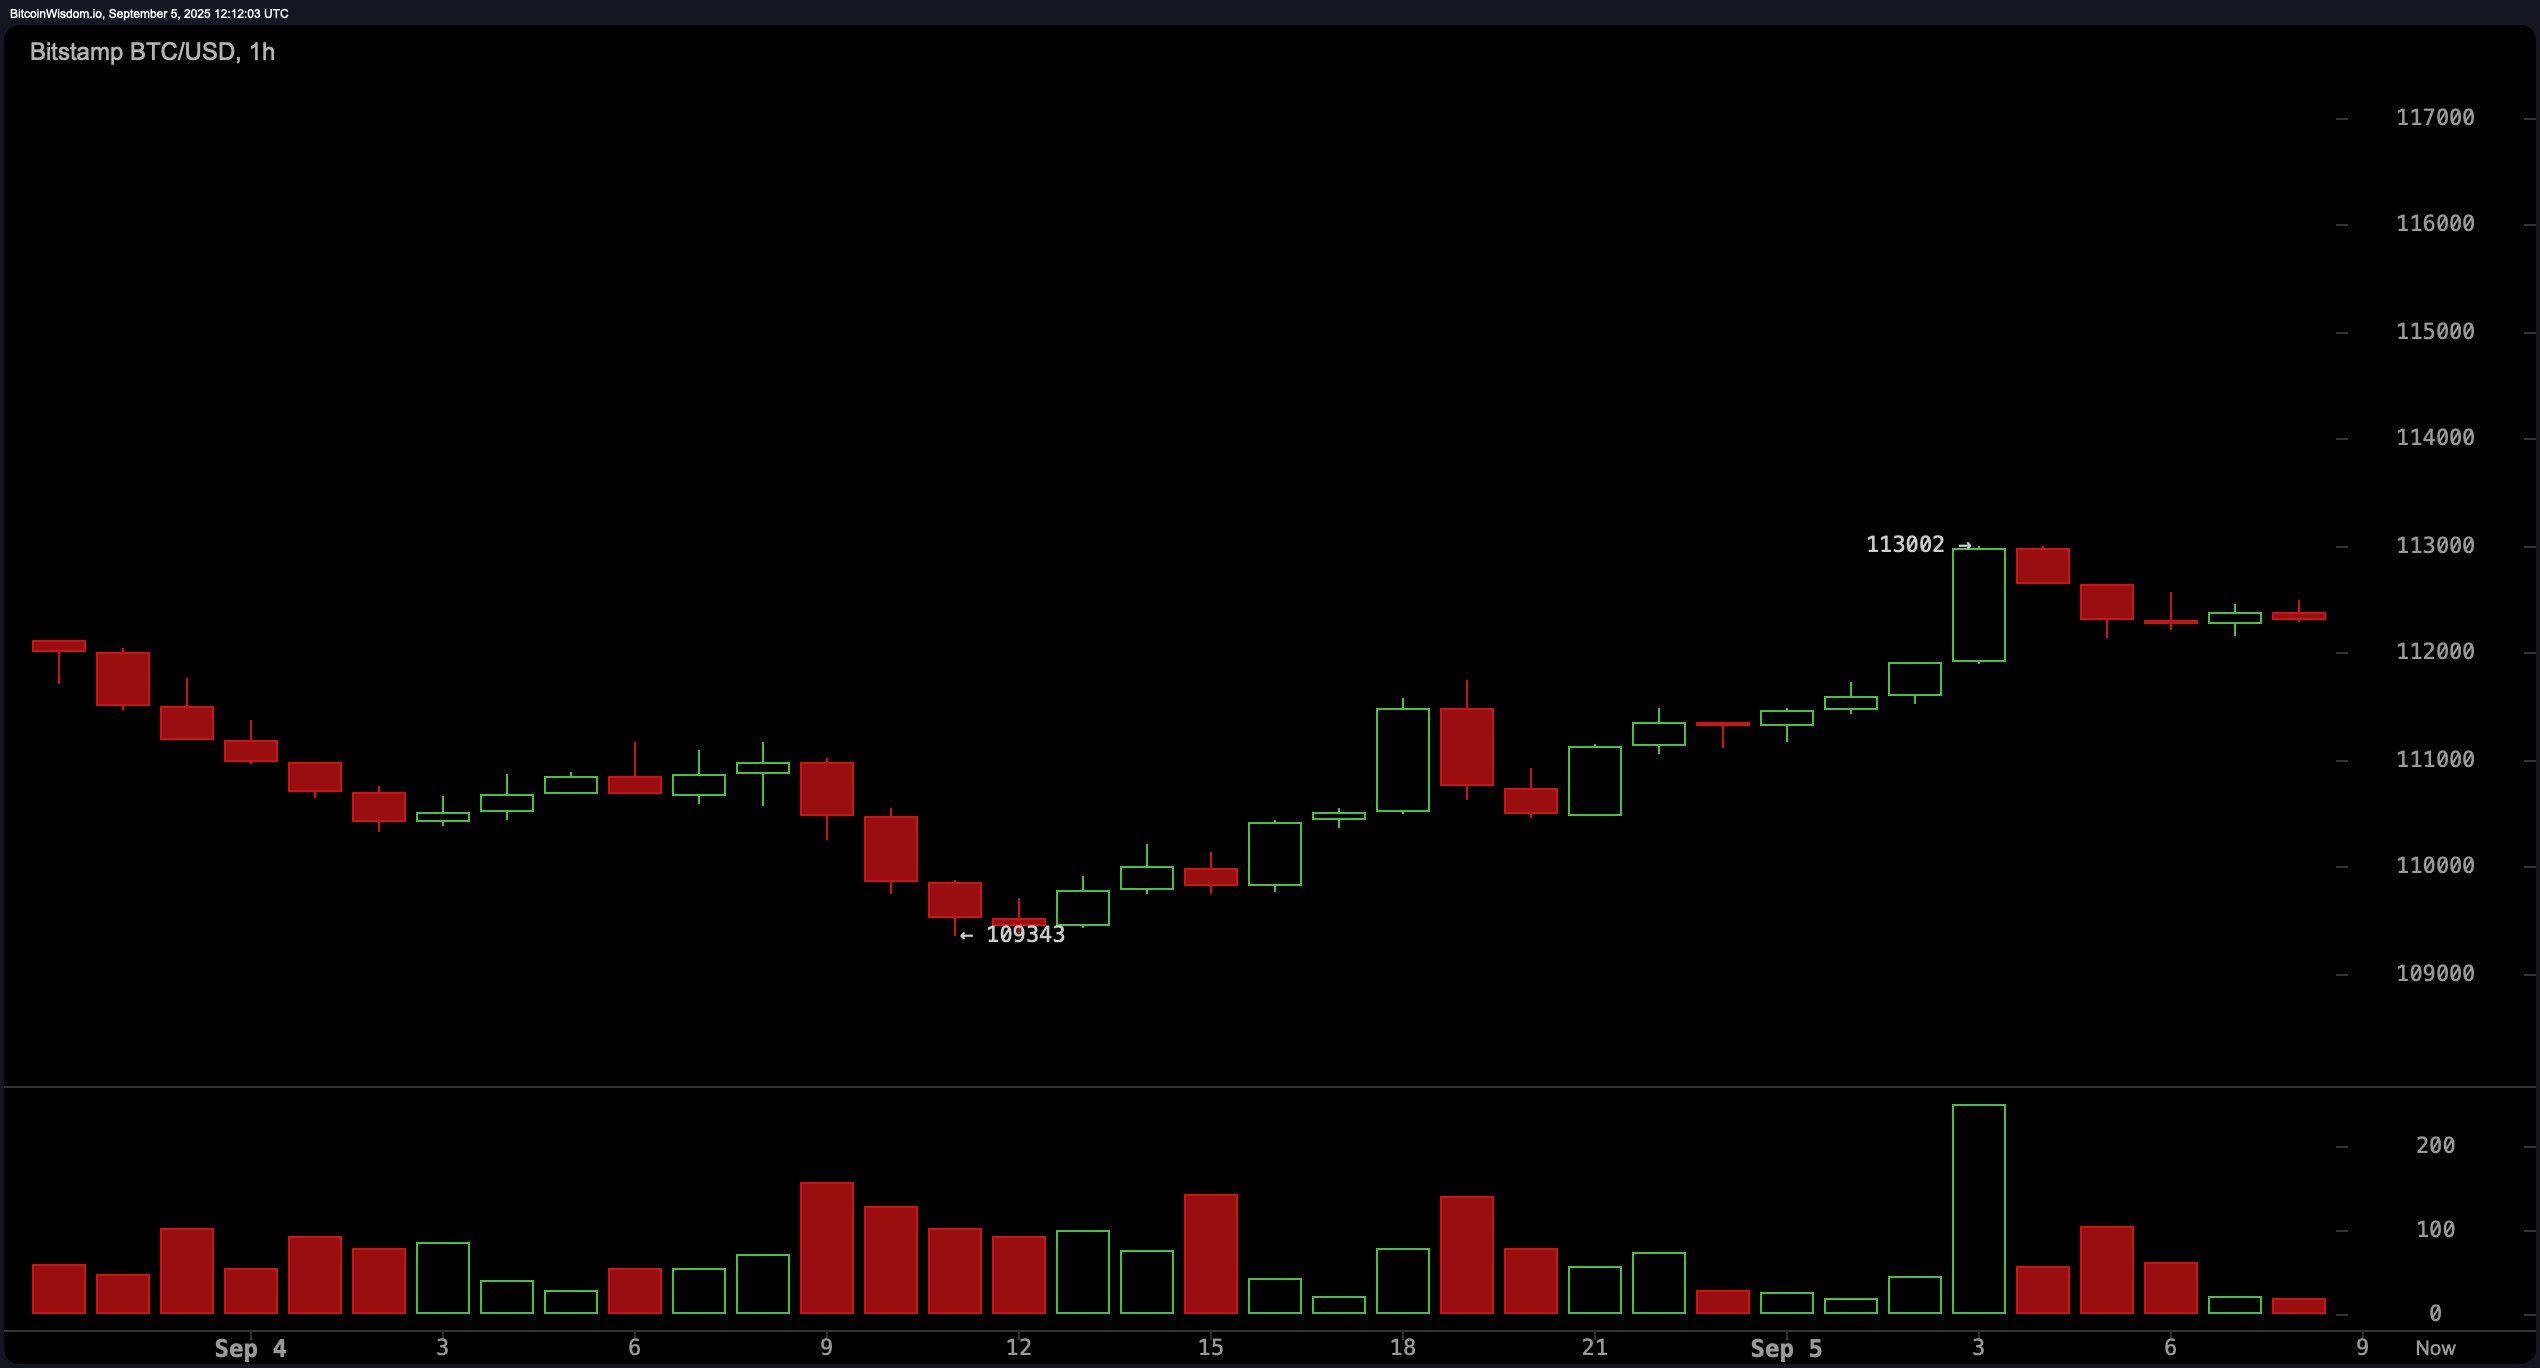
The 1-hour bitcoin chart tells a shorter story. Bitcoin formed a series of higher highs and lows, peaking at $113,002. It now moves sideways, consolidating under resistance. Volume spiked at the high, then faded, suggesting buyer exhaustion. A move above $113,000 could trigger a breakout. But a drop below $112,000 may test $111,500 or even $110,000. Intraday trades should target that range until a clear breakout.

Bitcoin Price Watch: Bear Market Bounce or True Reversal? All Eyes on Volume

BTC/USD 1-hour chart via Bitstamp on Sept. 5, 2025.

Oscillators paint a neutral to mildly bullish picture. The relative strength index (RSI) stands at 49. The Stochastic oscillator reads 44. Both signal a market in balance. The commodity channel index (CCI) is at −9, and the average directional index (ADX) at 18—both neutral. Momentum sits at 628, a bullish sign. The moving average convergence divergence (MACD) level is −1,365 and also shows a bullish signal.

Moving averages (MAs) show a market in transition. Short-term averages are bullish. The exponential moving average (EMA) and simple moving average (SMA) for 10 and 20 periods are all in a positive territory. But longer-term EMAs and SMAs from the 30- to 50-period range suggest selling pressure. The 100- and 200-period moving averages, both exponential and simple, still favor bulls, indicating support at deeper levels.

The market is caught between trends. Momentum is improving, but resistance is firm. If bitcoin breaks above $113,000 with volume, it could retest $114,000 or beyond. But failure to hold $111,000 may drag it toward $109,000 or $107,000. Traders should watch volume closely. This current rally might still be a bear market bounce.

Bull Verdict:

If bitcoin breaks and holds above $113,000 on strong volume, it confirms a short-term bullish reversal. Buyers could push toward $114,000 and potentially reclaim higher levels if momentum sustains.

Bear Verdict:

If bitcoin fails to hold $111,000, it risks falling back to $109,000 or even $107,000. Without volume support, this rally may fade as part of a broader downtrend continuation.

免责声明:本文章仅代表作者个人观点,不代表本平台的立场和观点。本文章仅供信息分享,不构成对任何人的任何投资建议。用户与作者之间的任何争议,与本平台无关。如网页中刊载的文章或图片涉及侵权,请提供相关的权利证明和身份证明发送邮件到support@aicoin.com,本平台相关工作人员将会进行核查。

交易瓜分20,000GT !注册送$10K
Ad
Share To
APP

X

Telegram

Facebook

Reddit

CopyLink