The fluctuations in the cryptocurrency market are like the waves in a turbulent sea, making people feel anxious. However, its charm lies in the fact that it never looks at your past report card. Stop saying "I'll enter the market when it stabilizes"; opportunities in the crypto world never lie in "stability." The real dividends always belong to those who dare to position themselves amid uncertainty. Market volatility is not a risk; not understanding the trend is the biggest risk.
The price of Bitcoin is oscillating between $110,000 and $112,000, with short-term momentum increasing but trading volume shrinking. A breakthrough of key resistance levels is needed to open up upward space.
From a technical perspective, the daily chart has shown three consecutive days of gains. Today, after an unsuccessful attempt to break through $113,000, a pullback has begun, and the daily chart is showing a bearish state. The hourly chart is in a state of oscillating downward, and the MACD indicator shows that the bullish momentum is dominant. However, caution is needed regarding the divergence caused by shrinking trading volume, which may weaken the sustainability of the trend.
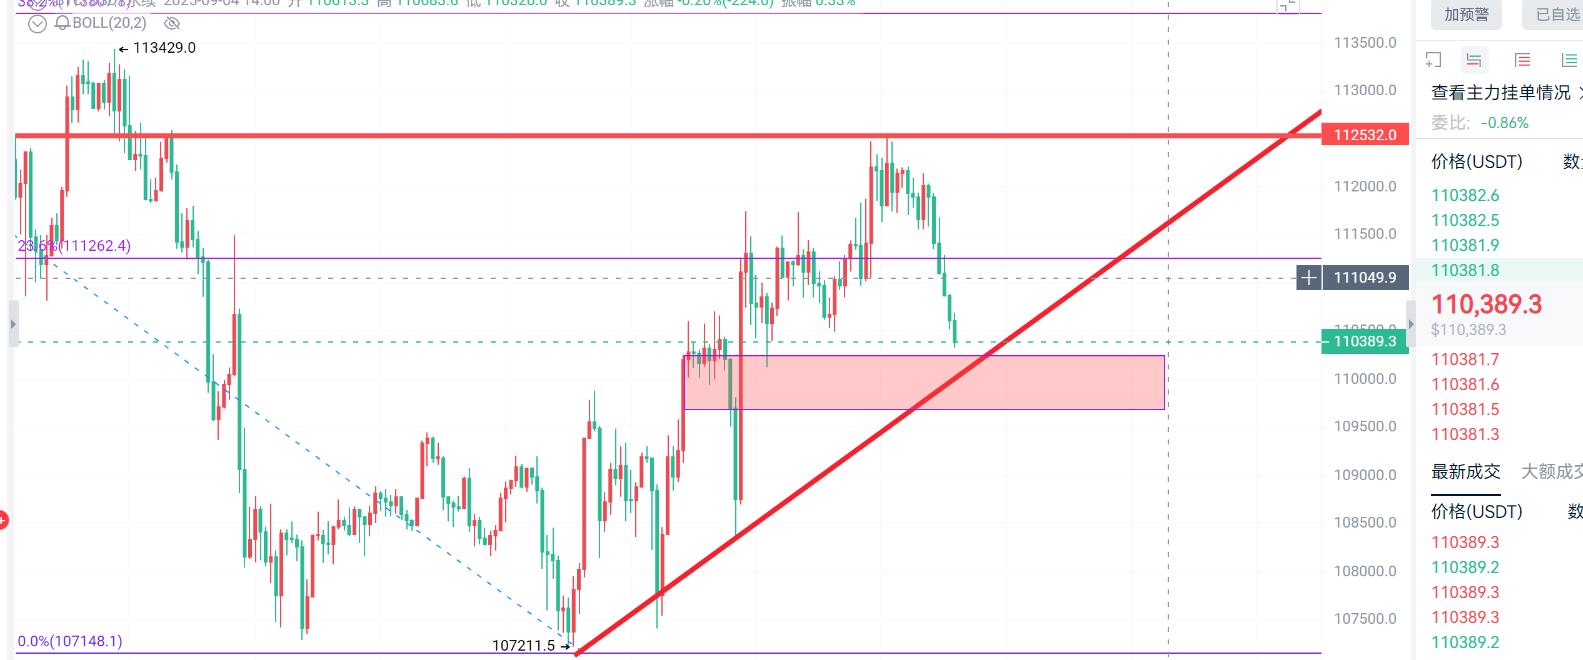
Suggested trading range for Bitcoin: Enter in batches in the $109,000-$110,000 range, targeting the $112,000-$113,000 range.
Recently, Ethereum has been oscillating between the lower support level of $4,200 and the upper resistance level of $4,500. The resistance at $4,500 is quite strong, and several attempts to break through have been unsuccessful.
From a technical perspective, a golden cross has appeared in the short-term moving averages, and the price has broken through the long-term moving average, accompanied by a bullish engulfing pattern, indicating some rebound momentum in the market. However, trading volume has significantly shrunk, and the divergence between volume and price raises doubts about the effectiveness of the upward movement, so caution is needed regarding the risk of false breakouts. The hourly chart has shown six consecutive bearish candles, and the MACD green momentum is beginning to shrink. Currently, the main focus is on whether the price can break below the $4,350 level. Today, it is recommended to primarily focus on low long positions, with short positions as a supplement.
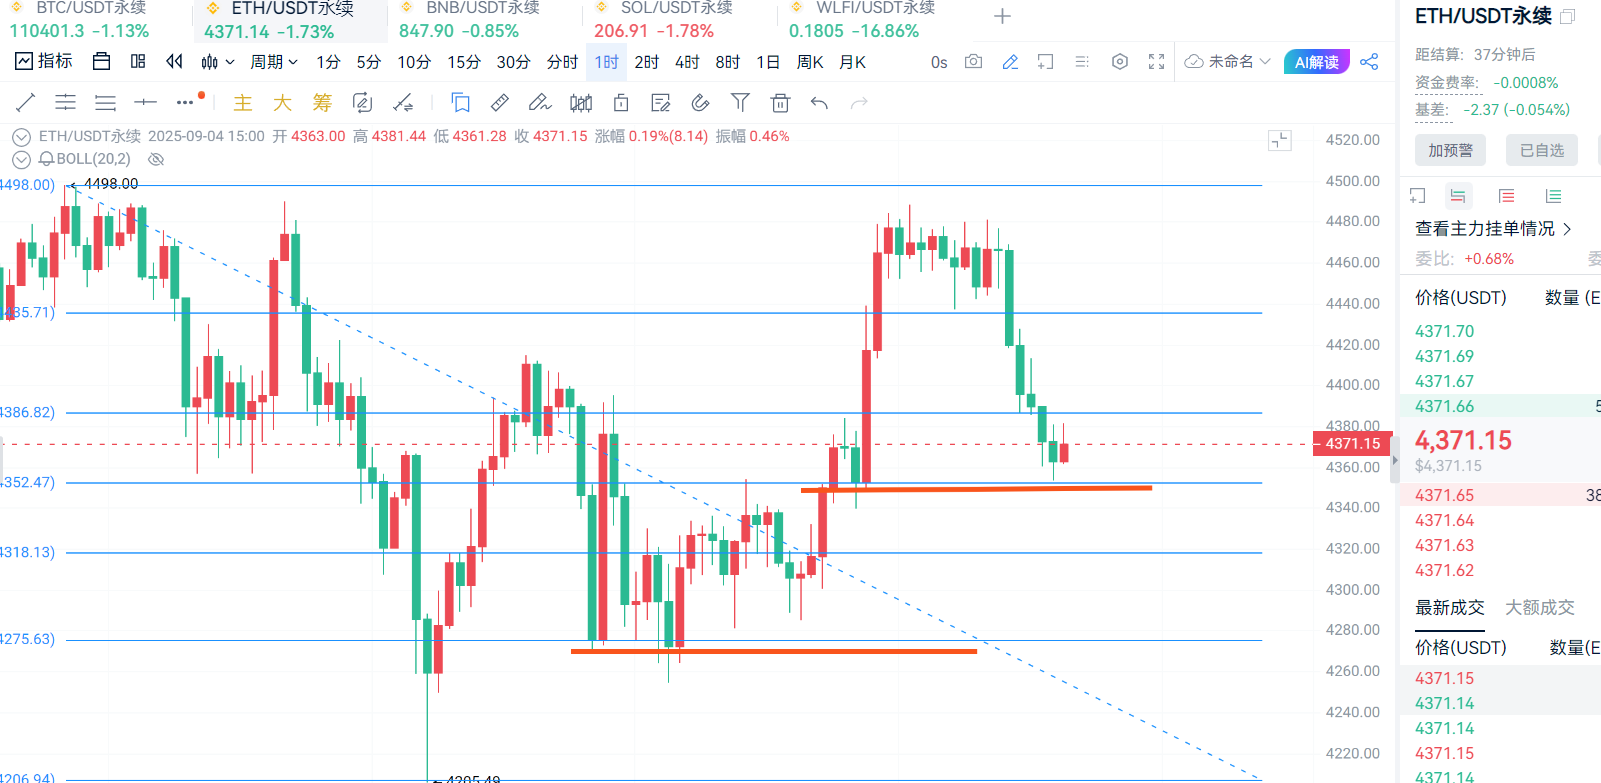
Suggested trading range for Ethereum: If the price pulls back to the $4,280-$4,330 range, enter in batches, targeting $4,400-$4,440.
Due to the time-sensitive nature of price points, there may be delays in post reviews, so specific operations should be based on real-time market conditions. The above trading range analysis is for reference only. The cryptocurrency market is highly risky, so please manage your risk well and make cautious decisions when investing. If you are interested in specific indicator analysis or the impact of new market dynamics on prices, feel free to scan the QR code for the public account in the article below. You are welcome to visit.

Warm reminder: The content of the above article is original by the author. The advertisements at the end of the article and in the comments section are unrelated to the author, so please be cautious!
免责声明:本文章仅代表作者个人观点,不代表本平台的立场和观点。本文章仅供信息分享,不构成对任何人的任何投资建议。用户与作者之间的任何争议,与本平台无关。如网页中刊载的文章或图片涉及侵权,请提供相关的权利证明和身份证明发送邮件到support@aicoin.com,本平台相关工作人员将会进行核查。


