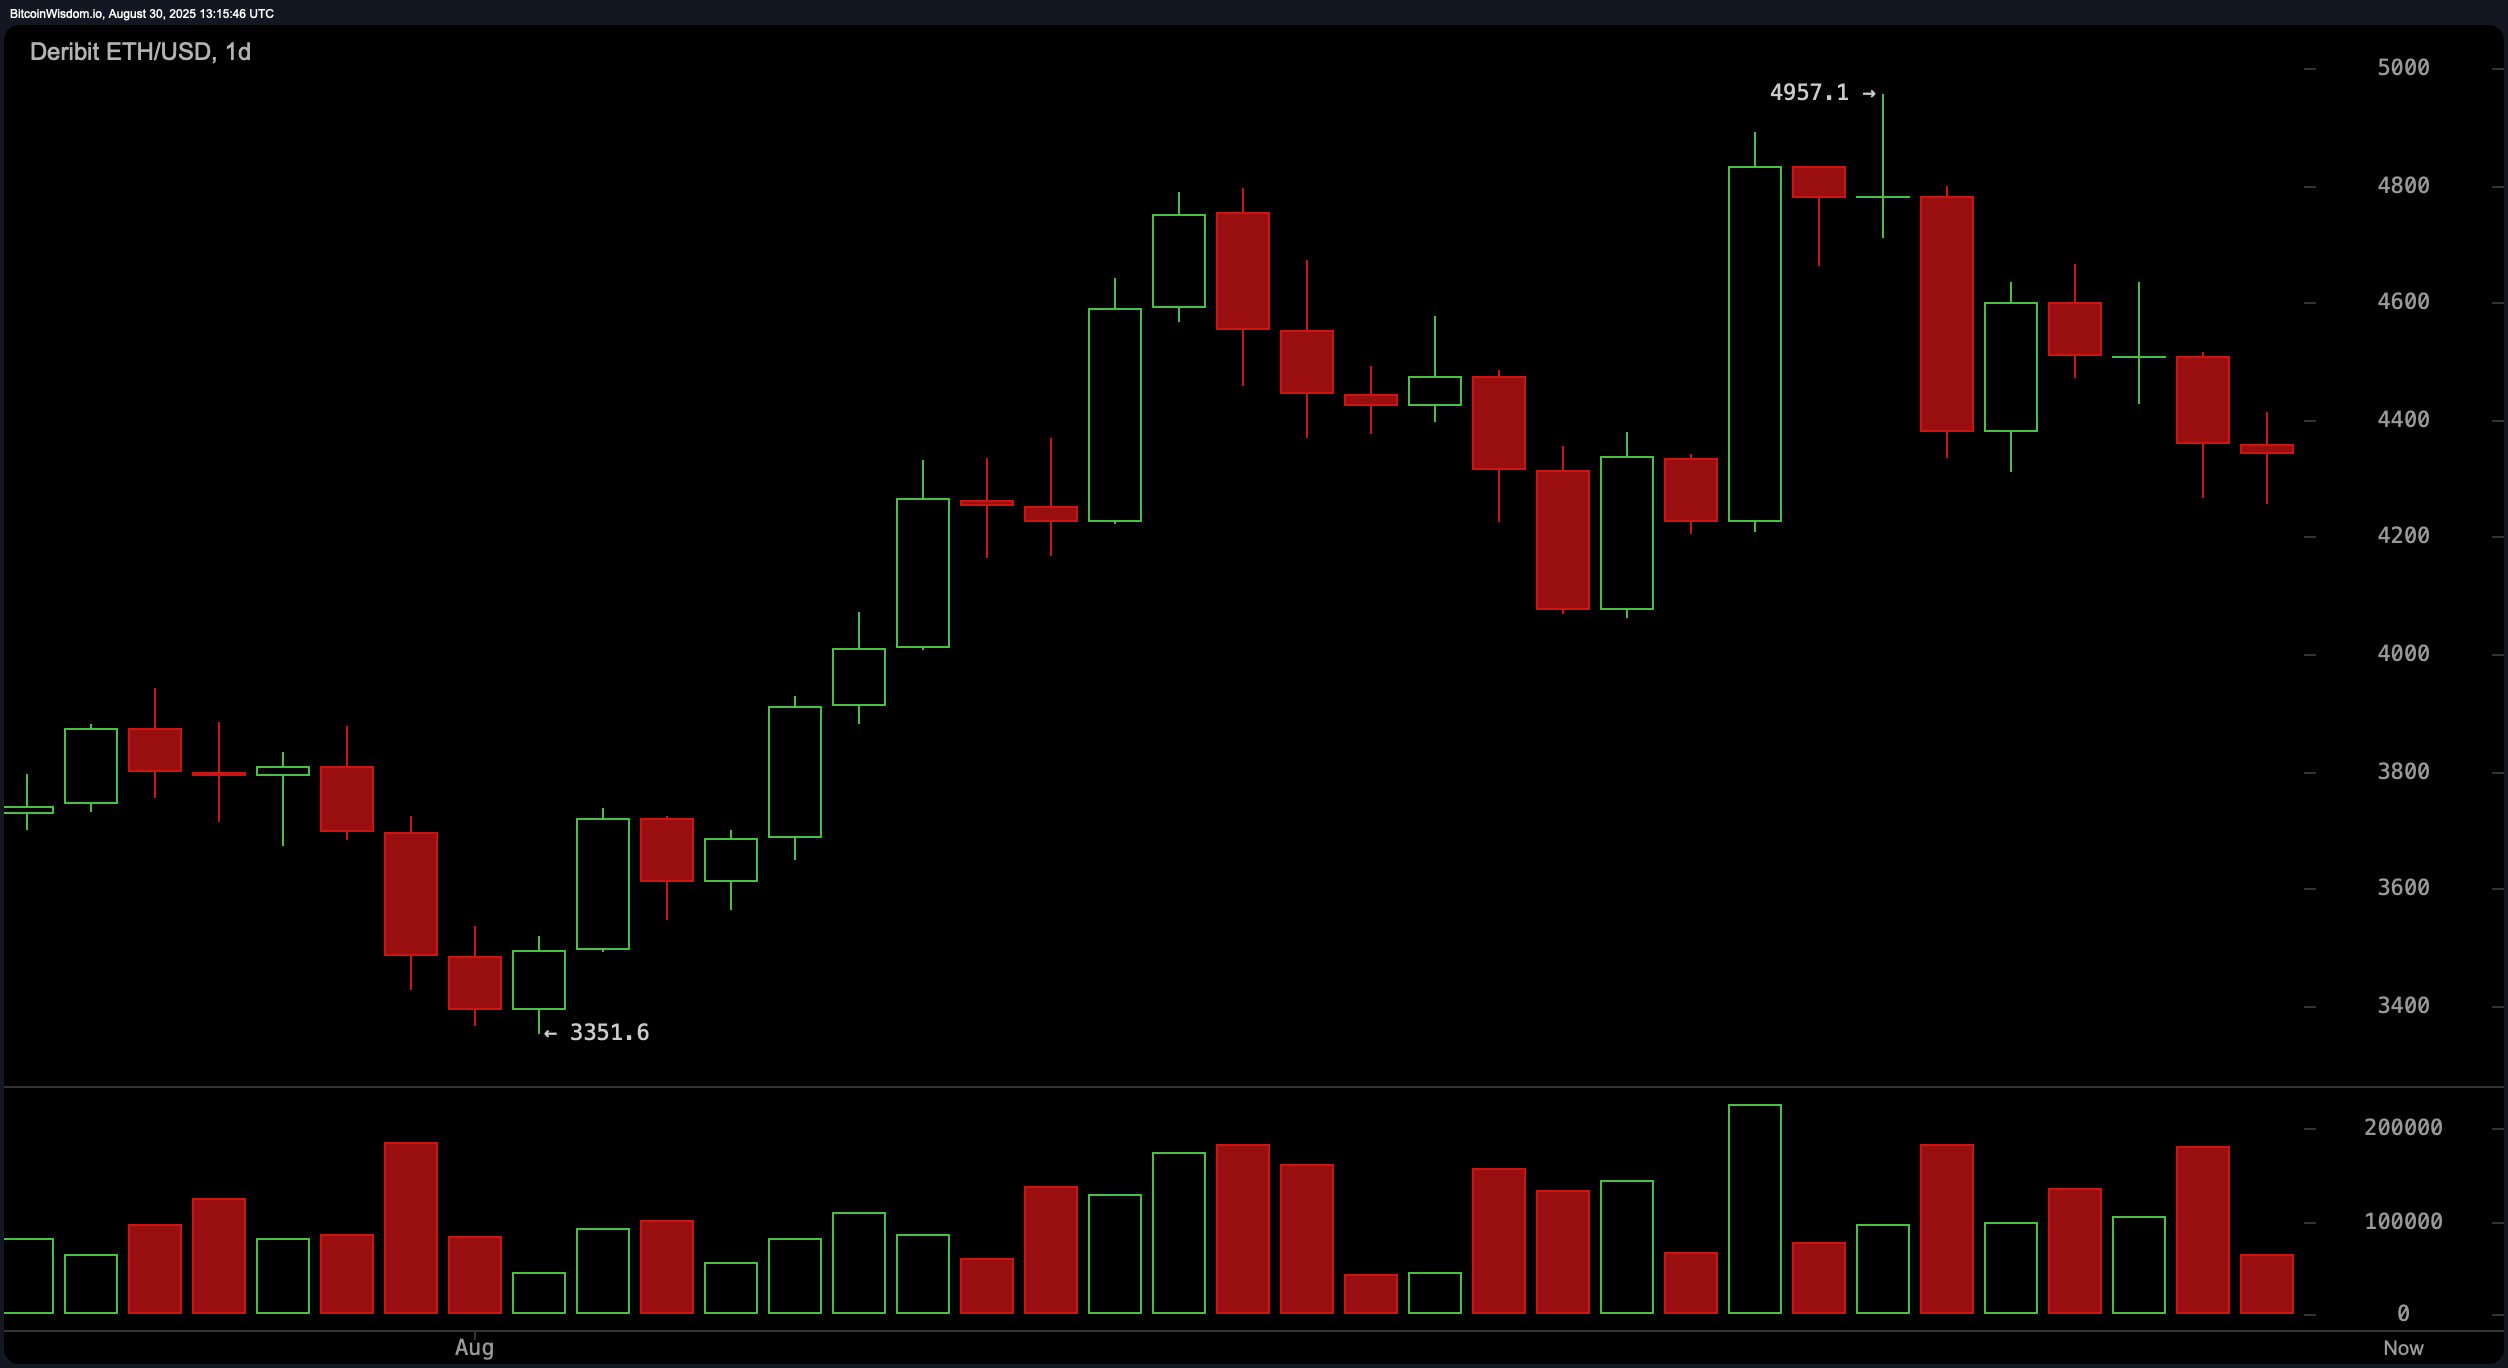
On the daily chart, ether continues to trace a downtrend after peaking at $4,957.1. Price action confirms a consistent formation of lower highs and lower lows, accompanied by an uptick in red candle volume—suggesting robust selling pressure. The current support band around $4,200 to $4,300 is proving crucial, lying just below today’s average price. A confirmed bounce here, particularly one marked by a bullish hammer or green engulfing candle, could offer a mid-term entry opportunity. A more aggressive signal would be a decisive push beyond $4,500, reclaiming prior support turned resistance. Conversely, breaching $4,200 could trigger a retreat toward $4,000 or even $3,850.

ETH/USD 1-day chart on Aug. 30, 2025.
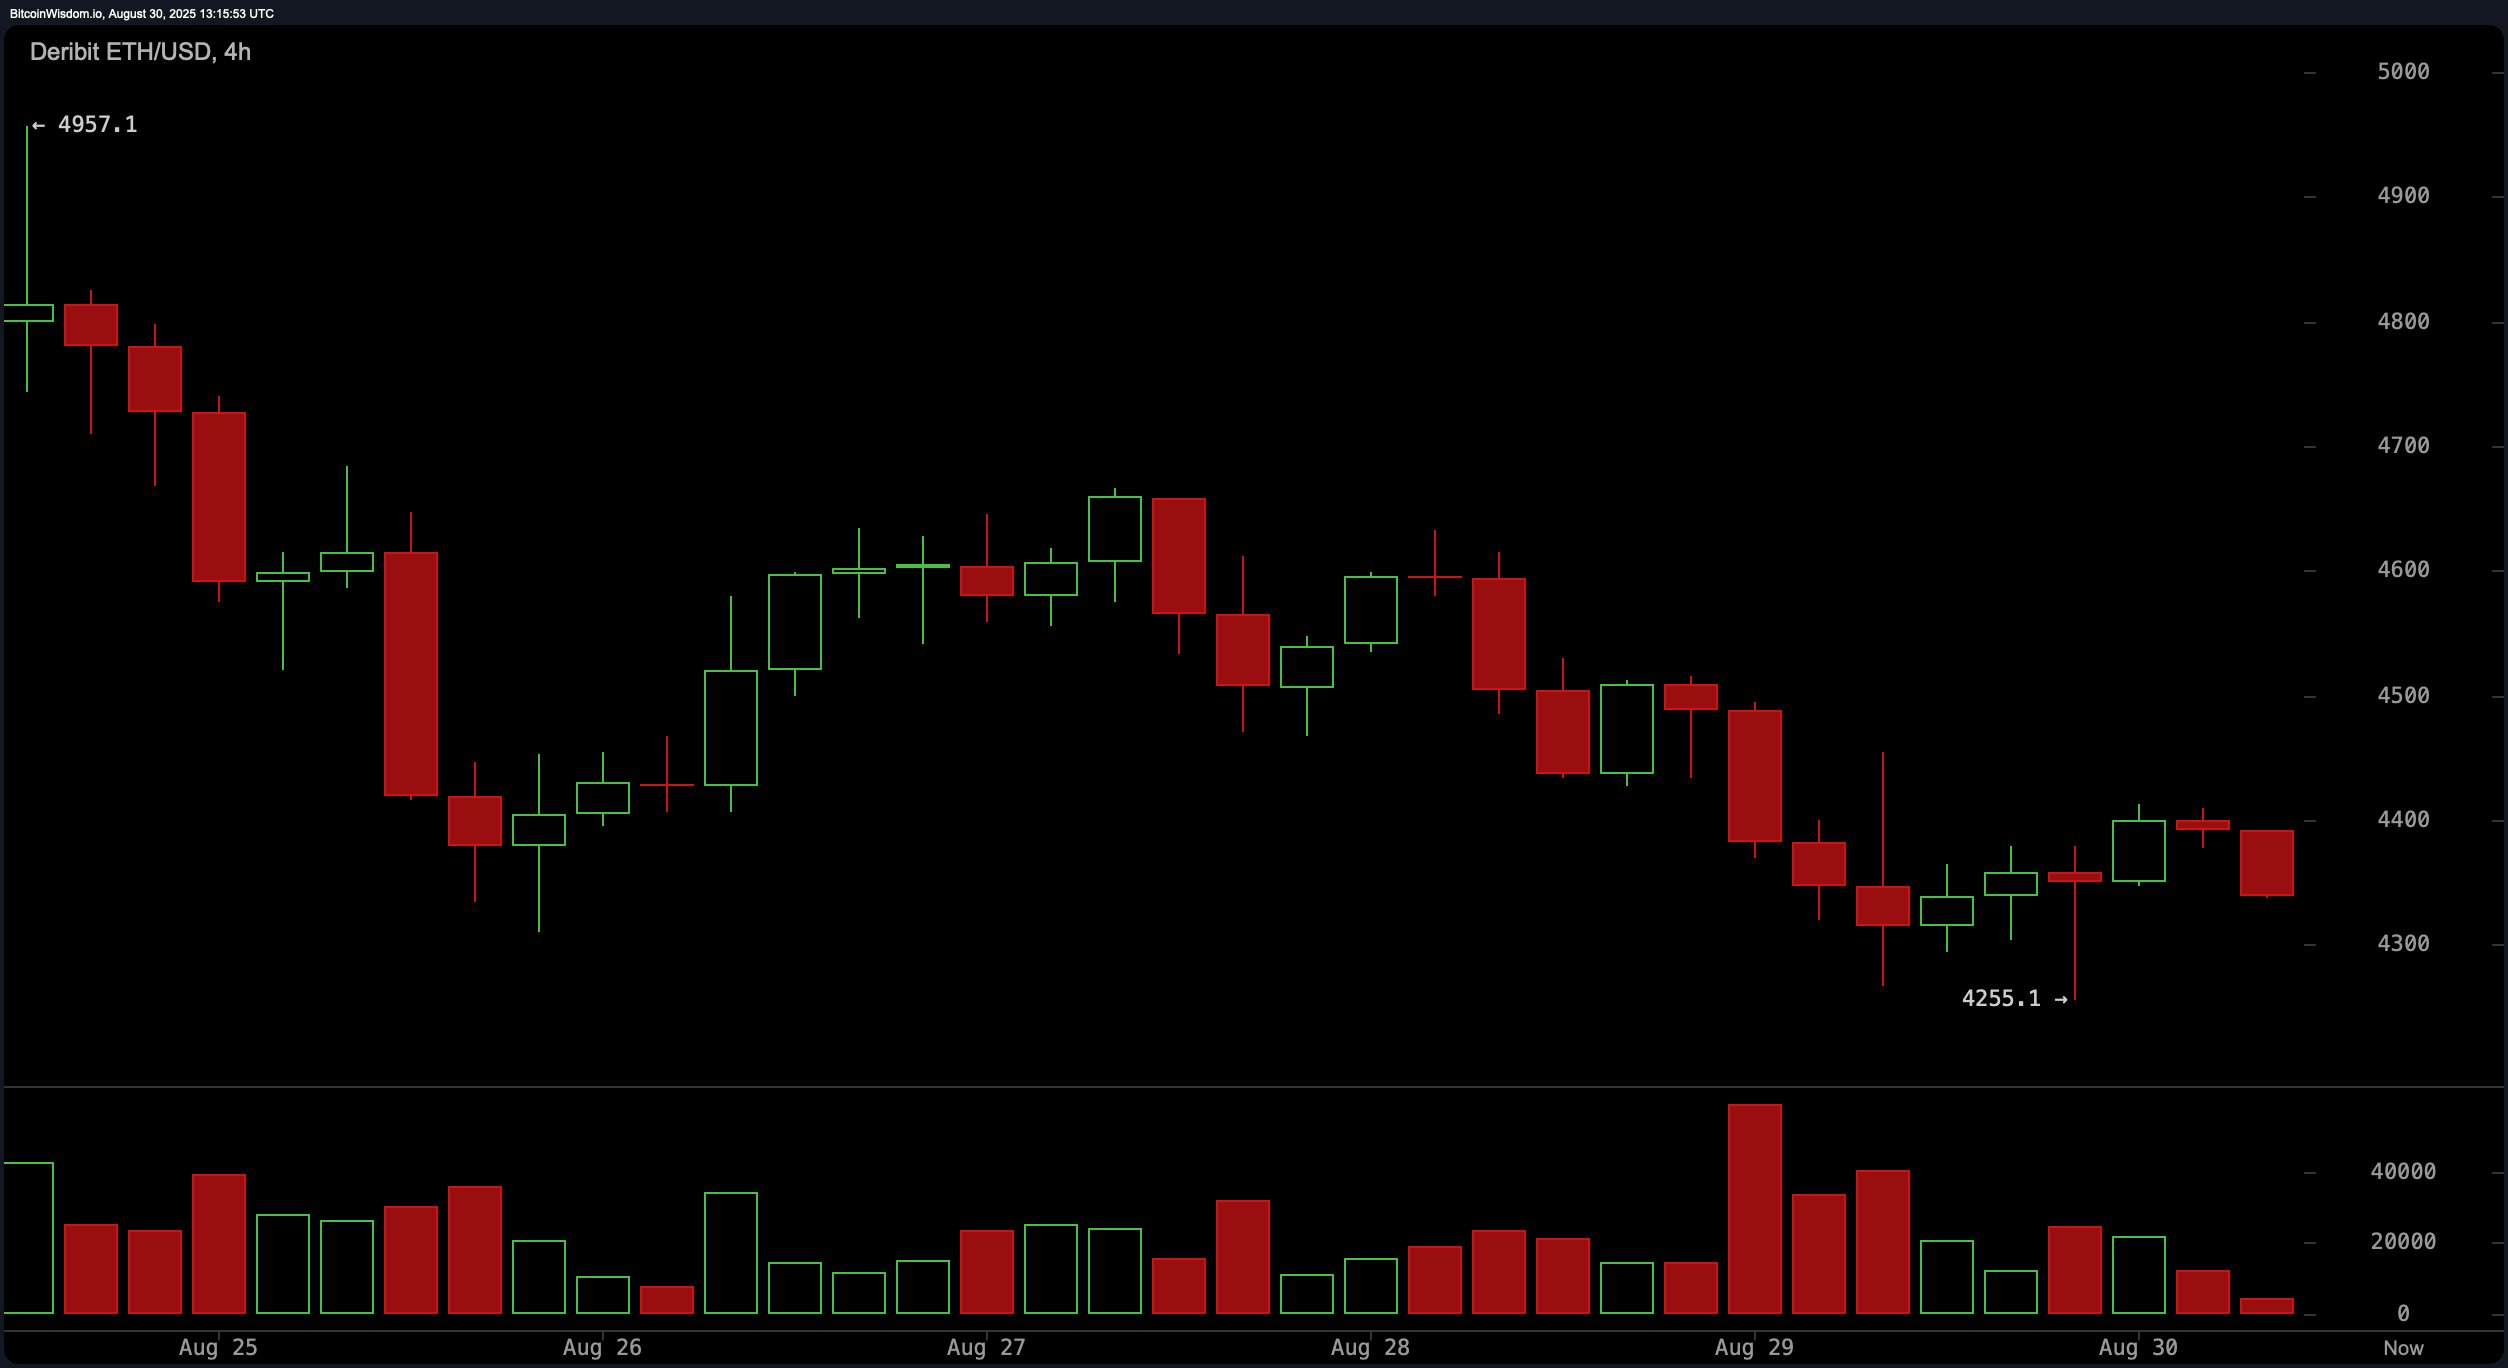
The 4-hour ethereum chart reflects a more immediate downtrend extending from $4,957 to recent lows near $4,255. Volume spikes on red candles support a narrative of persistent sell-offs, while the relative strength index (RSI) appears to hover near oversold territory. This opens a narrow window for short-term bullish divergence, especially if price consolidates or double-bottoms around $4,250–$4,300. Traders eyeing entries might consider a break above $4,400–$4,420 as an early signal, though any upward momentum should be treated cautiously. Tight stop-loss strategies remain critical given resistance between $4,480–$4,500.

ETH/USD 4-hour chart on Aug. 30, 2025.
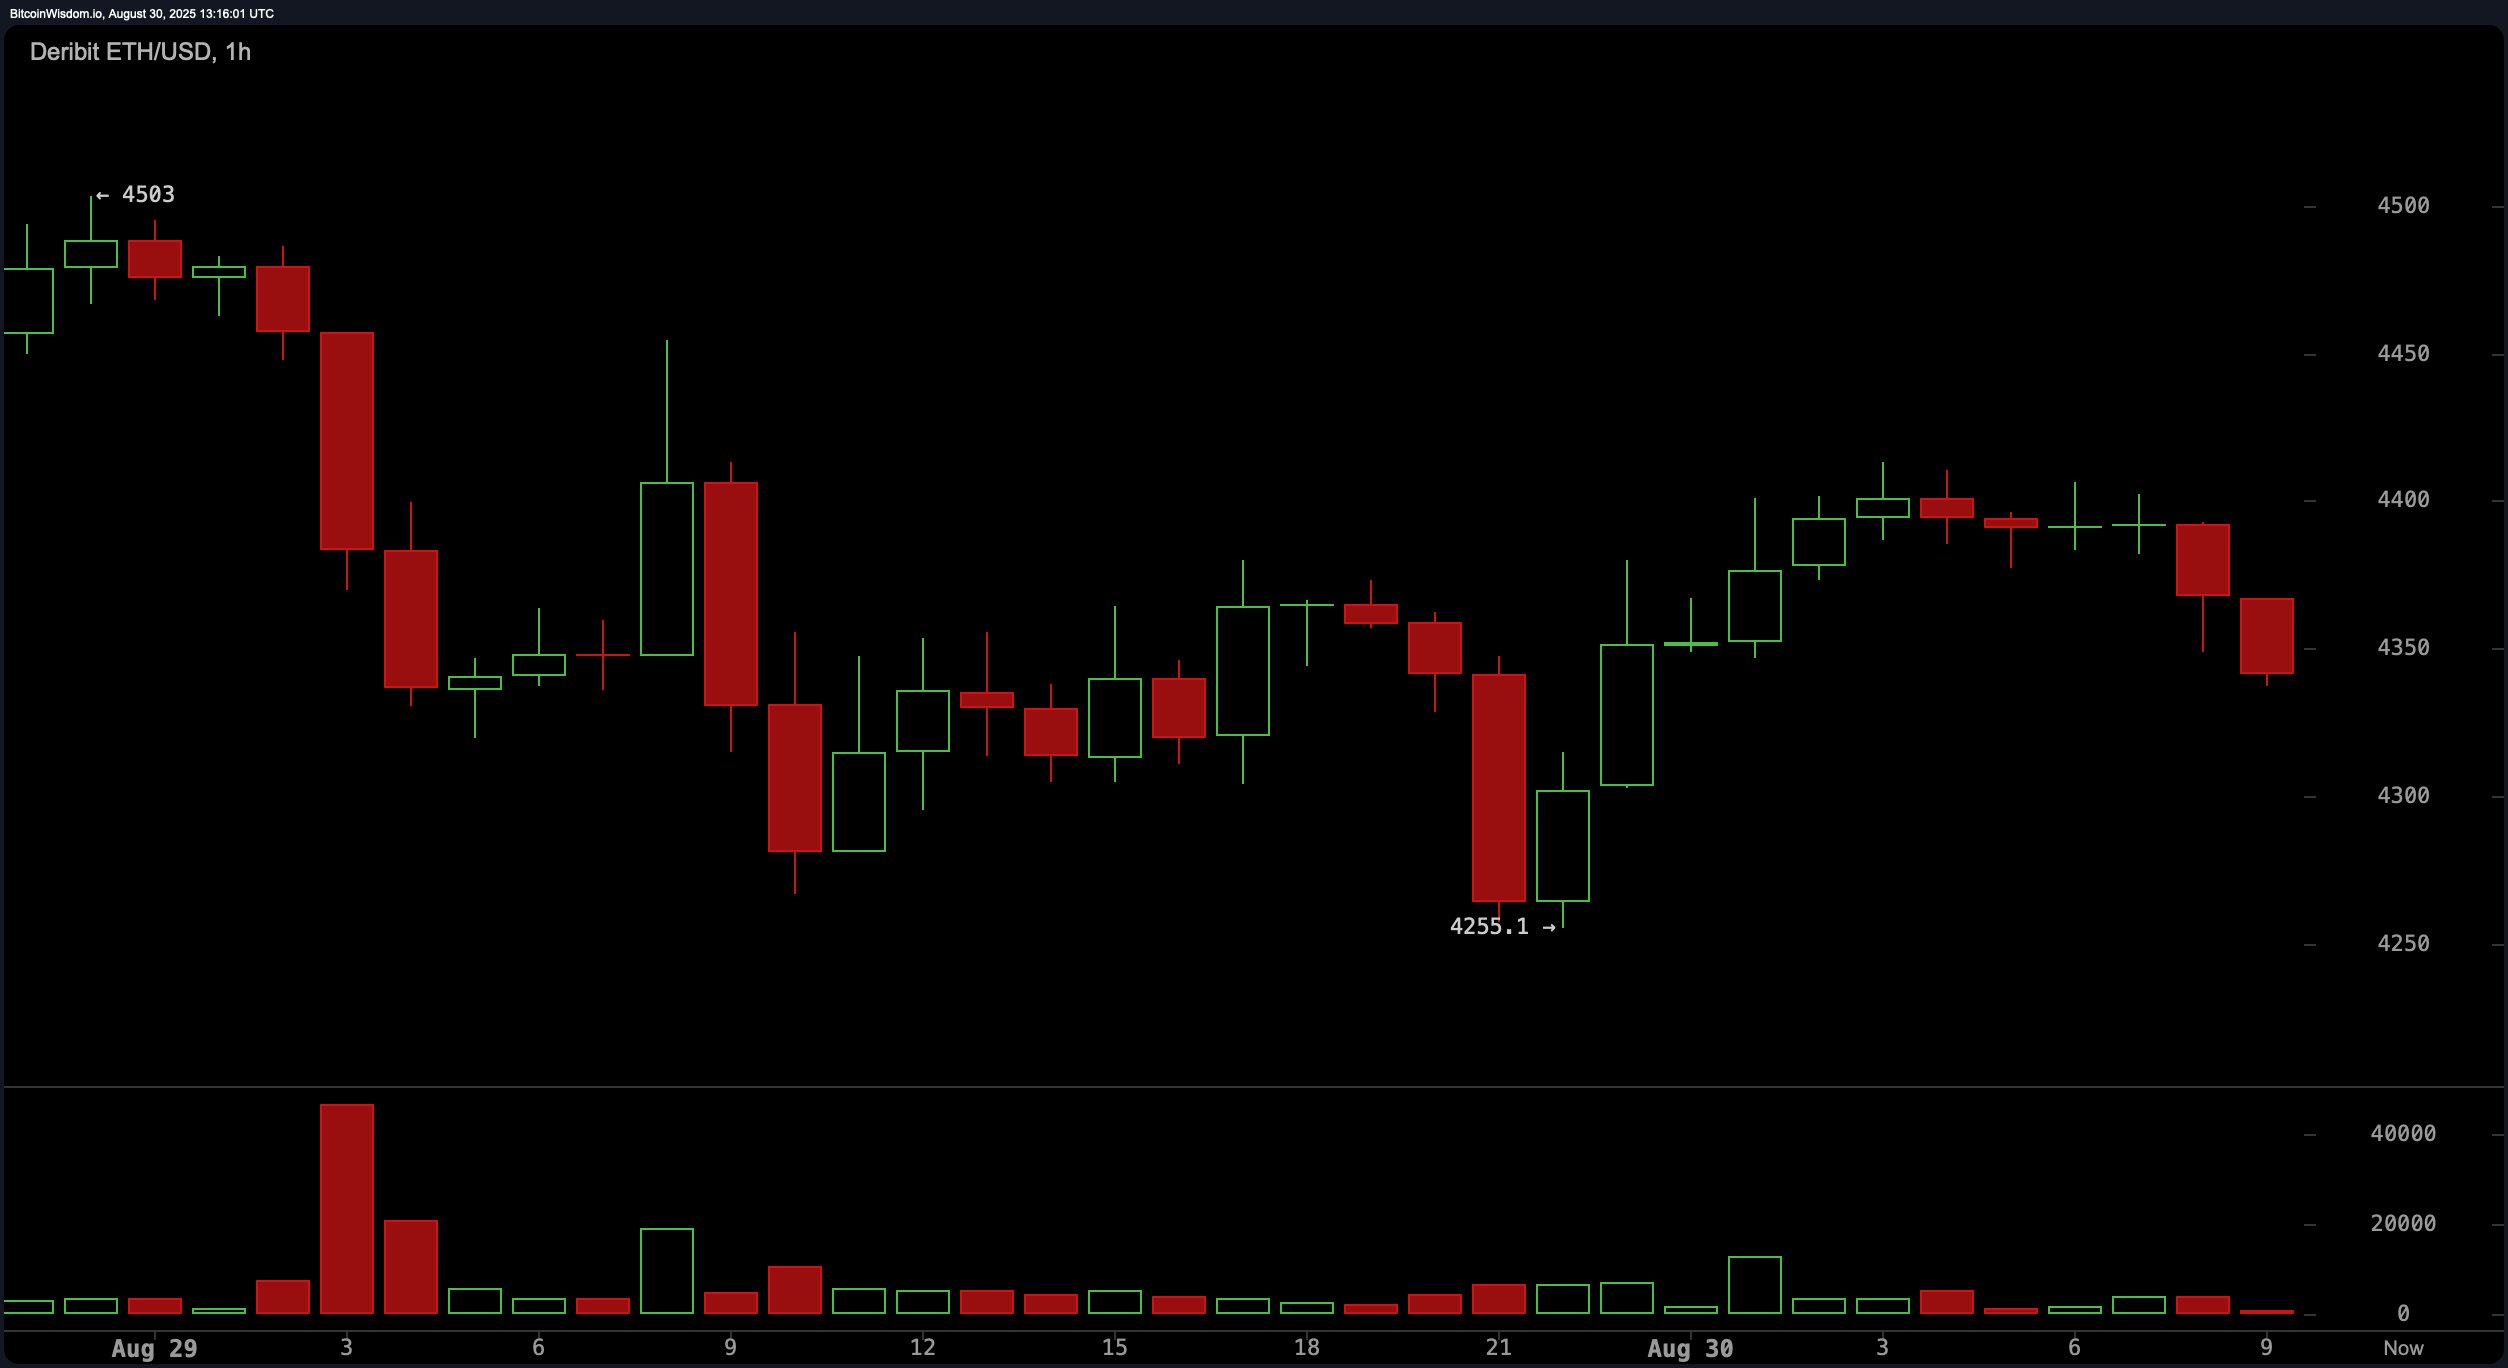
The 1-hour ether chart highlights a pattern of mini-consolidations after each downward movement, hinting at trader hesitation or market indecision. Ethereum briefly rebounded toward $4,400 but was swiftly sold into, signaling the bulls’ lack of strength. A reversal might form near $4,255, contingent on holding the $4,300 level and breaking above $4,380 with a supporting surge in volume. Should price close under $4,250 with significant volume, bearish continuation becomes more probable, and a short or flat positioning would be prudent. Immediate resistance remains concentrated in the $4,400–$4,450 corridor.

ETH/USD 1-hour chart on Aug. 30, 2025.
Oscillators deliver a mixed outlook, with the relative strength index (RSI), Stochastic oscillator, commodity channel index (CCI), average directional index (ADX), and Awesome oscillator all holding neutral positions. However, the momentum indicator and moving average convergence divergence (MACD) both signal bearish momentum, with the latter showing a level of 151.0. These divergences point to the importance of waiting for confirmation before positioning, particularly in a market lacking unified oscillator sentiment.
Moving averages reflect a transitional phase. Short-term averages such as the exponential moving average (EMA) and simple moving average (SMA) over 10 and 20 periods suggest continued weakness, all posting bearish signals. However, medium- to long-term trends show strength, with bullish signals across the 30, 50, 100, and 200-period moving averages. This divergence between short- and long-term signals could indicate ethereum is attempting to stabilize, but confirmation is still pending. For now, traders would benefit from tracking volume shifts and structural consolidations on lower timeframes.
Bull Verdict:
If ether maintains support between $4,200 and $4,300 and breaks above the $4,380–$4,420 zone with volume confirmation, a short-term recovery rally could extend toward $4,500 and potentially $4,600–$4,700. The alignment of mid- and long-term moving averages in a bullish territory supports a cautiously optimistic outlook for bulls, especially if selling pressure wanes and oscillators shift out of neutral territory.
Bear Verdict:
Should ethereum break decisively below the $4,200 support level with increased sell volume, downside targets of $4,000 and $3,850 become likely. With short-term moving averages and key momentum indicators like the moving average convergence divergence (MACD) and momentum indicator signaling bearishness, sellers retain the upper hand unless a structural reversal emerges.
免责声明:本文章仅代表作者个人观点,不代表本平台的立场和观点。本文章仅供信息分享,不构成对任何人的任何投资建议。用户与作者之间的任何争议,与本平台无关。如网页中刊载的文章或图片涉及侵权,请提供相关的权利证明和身份证明发送邮件到support@aicoin.com,本平台相关工作人员将会进行核查。


