
大饼短期价格有重返箱体底部截止最高触及了103300,4小时走上升通道,MACD柱体缩短日线KDJ交叉,但是量能不足,今天晚上公布失业金数据,明天晚上有PCE这两个会比较关键会决定在现有降息预期的基础上增加还是减少9月降息的概率。
以太总体表现的仍然比大饼强,但是短线偏震荡,高点在降低这个区间减少操作,我们仍然在等待更好的入场机会。
伦敦金走强现在也来到了收敛三角的下方关注它的突破情况,美元指数反而在下降,美国10年期国债和五年期国债也同样出现下跌。
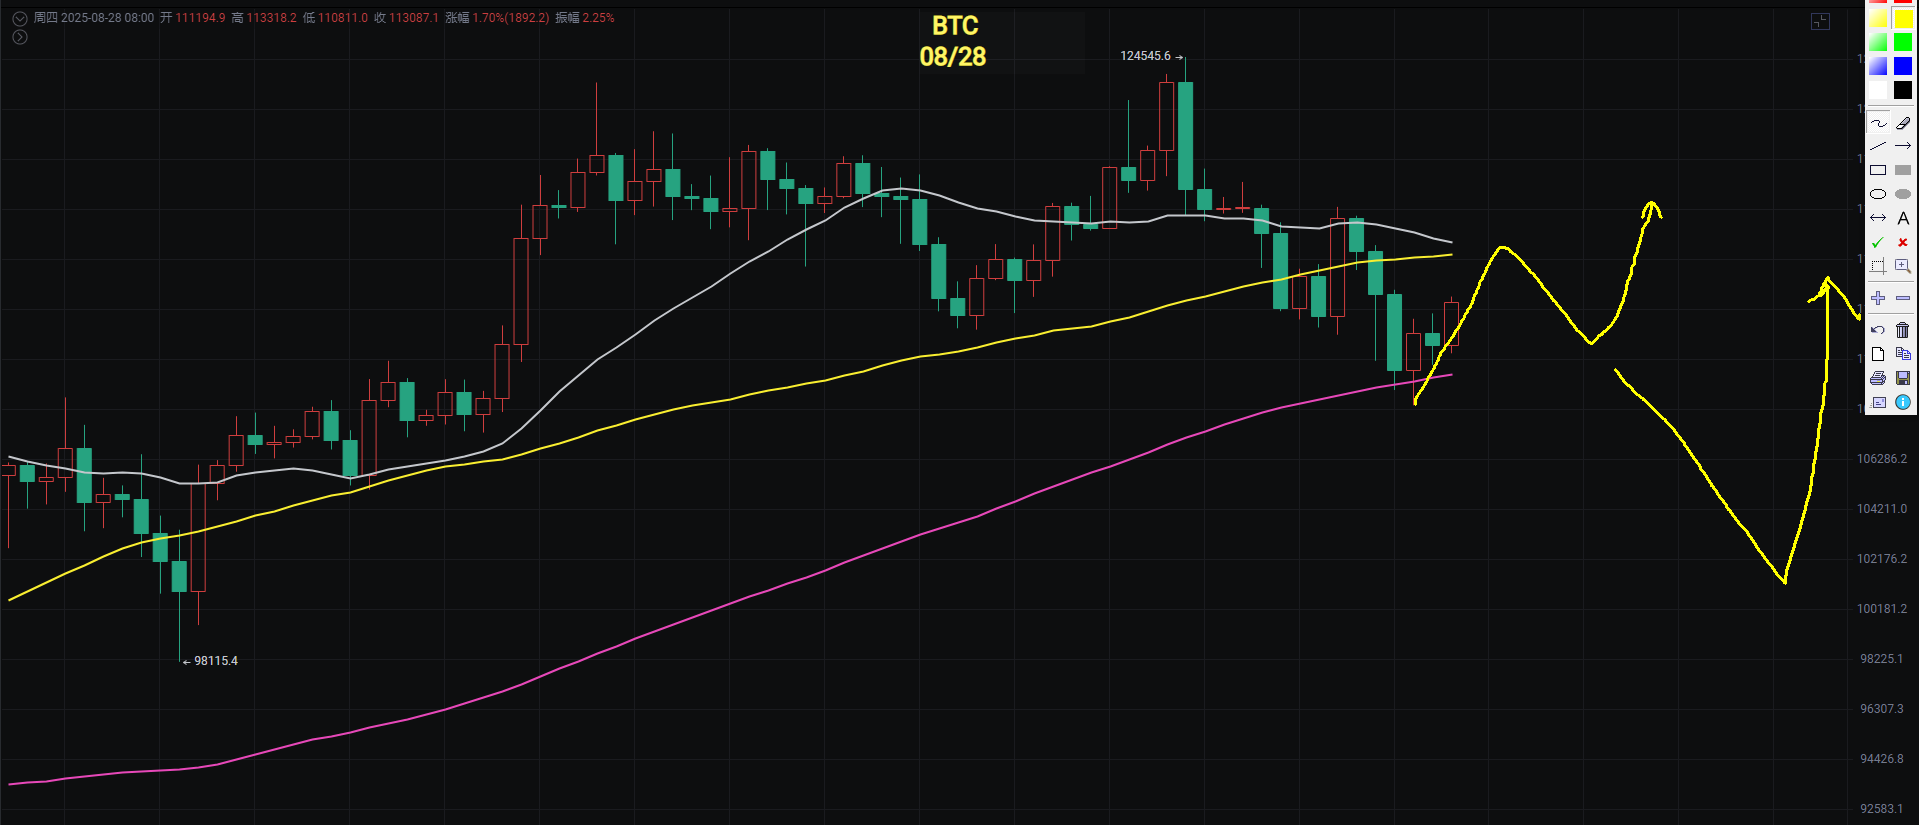
大饼
牛市行情里面MA120是非常重要的支撑,也被称为牛熊分界线,所以这一波下跌也同样回踩了,最低跌到了108666反弹,目前关注115000和MA20和MA60的压制,MACD柱体缩短看是否能走出底背离KDJ形成金叉,量能不足,4小时走了上升通道我们关注此通道破位情况。
公子预判两种走势,第一种就是反弹115000一116000回调继续测试MA120的支撑慢慢地磨上去时间周期拉长。
第二种下破MA120至98000至10万再继续反弹。
支撑:108666一110800
压力:115000一117500一118600
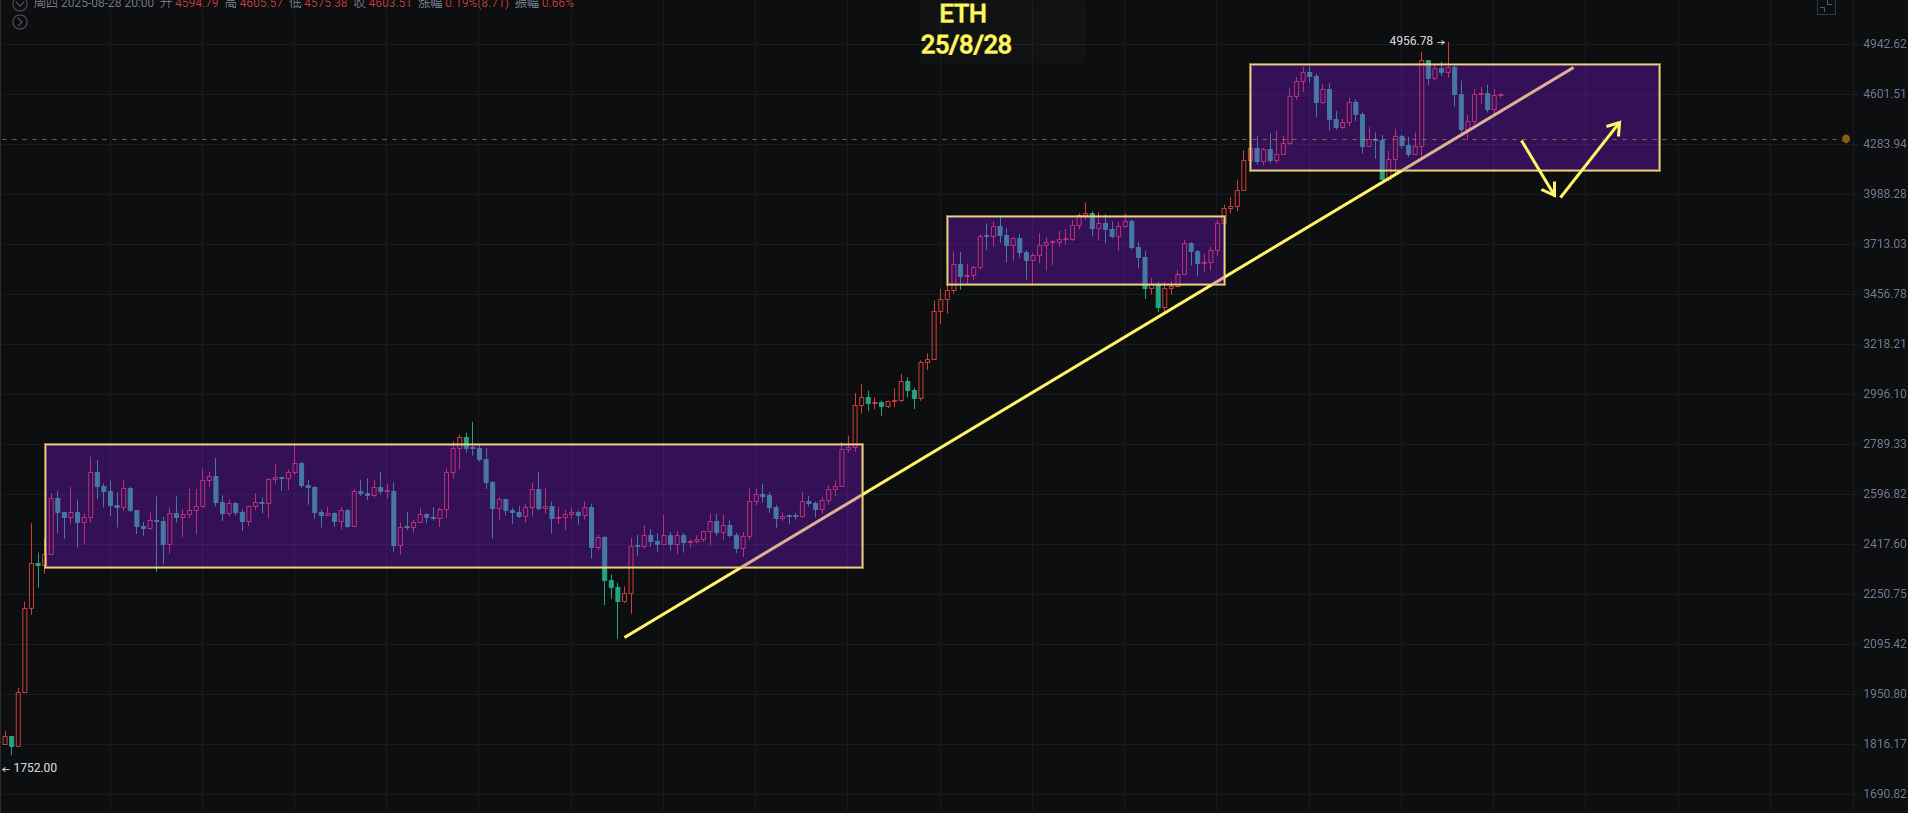
以太
以太整体的回调幅度偏弱价格没多大变化,但是目前还是在高位公子一直不太建议去乱操作性价比不高,后续有机会跌回到4060附近才考虑分批去加仓,而且不排除会去假跌破摸一下3800到3900再反弹。整个这一轮上涨以来都是快速拉升后转震荡,而且也像大饼一样,来个假跌破收回以太也不排除。
日线出现假突破后高点在下移这里不适合追涨,同样也不适合中长线布局,回调4060或下破3800至3900公子觉得是可以分批去布局的。
支撑:3800一3900一4060
压力:4665一4788一4956
你喜欢我的观点,请点赞评论分享,我们一起穿越牛熊!!!
文章具有时效性,仅供参考实时更新
专注k线技术研究,共赢全球投资机会公众号:BTC交易公子扶苏

免责声明:本文章仅代表作者个人观点,不代表本平台的立场和观点。本文章仅供信息分享,不构成对任何人的任何投资建议。用户与作者之间的任何争议,与本平台无关。如网页中刊载的文章或图片涉及侵权,请提供相关的权利证明和身份证明发送邮件到support@aicoin.com,本平台相关工作人员将会进行核查。


