Written by: CryptoVizArt, UkuriaOC, Glassnode
Compiled by: AididiaoJP, Foresight News
The trading price of Bitcoin is close to $111,000, testing the key support level of $107,000–$108,900. A rebound to $113,600 may face continued selling pressure, while deeper declines could target $93,000–$95,000. Currently, the losses remain shallow, spot demand is neutral, and perpetual contracts lean bearish but show mild performance.
Summary
- Bitcoin has retraced to $111,000, with support anchored in the cost basis cluster of $93,000–$110,000. A drop below $107,000–$108,900 could open up downside potential, targeting $93,000–$95,000.
- Short-term holders are still under pressure, so any rebound to $113,600 may encounter resistance as they sell during the bounce.
- Unrealized and realized losses remain shallow, far from the extremes seen in past bear markets, indicating limited selling behavior so far.
- Spot demand has neutralized, while perpetual futures lean bearish, with funding rates showing a weak neutral state.
Filling the Gap
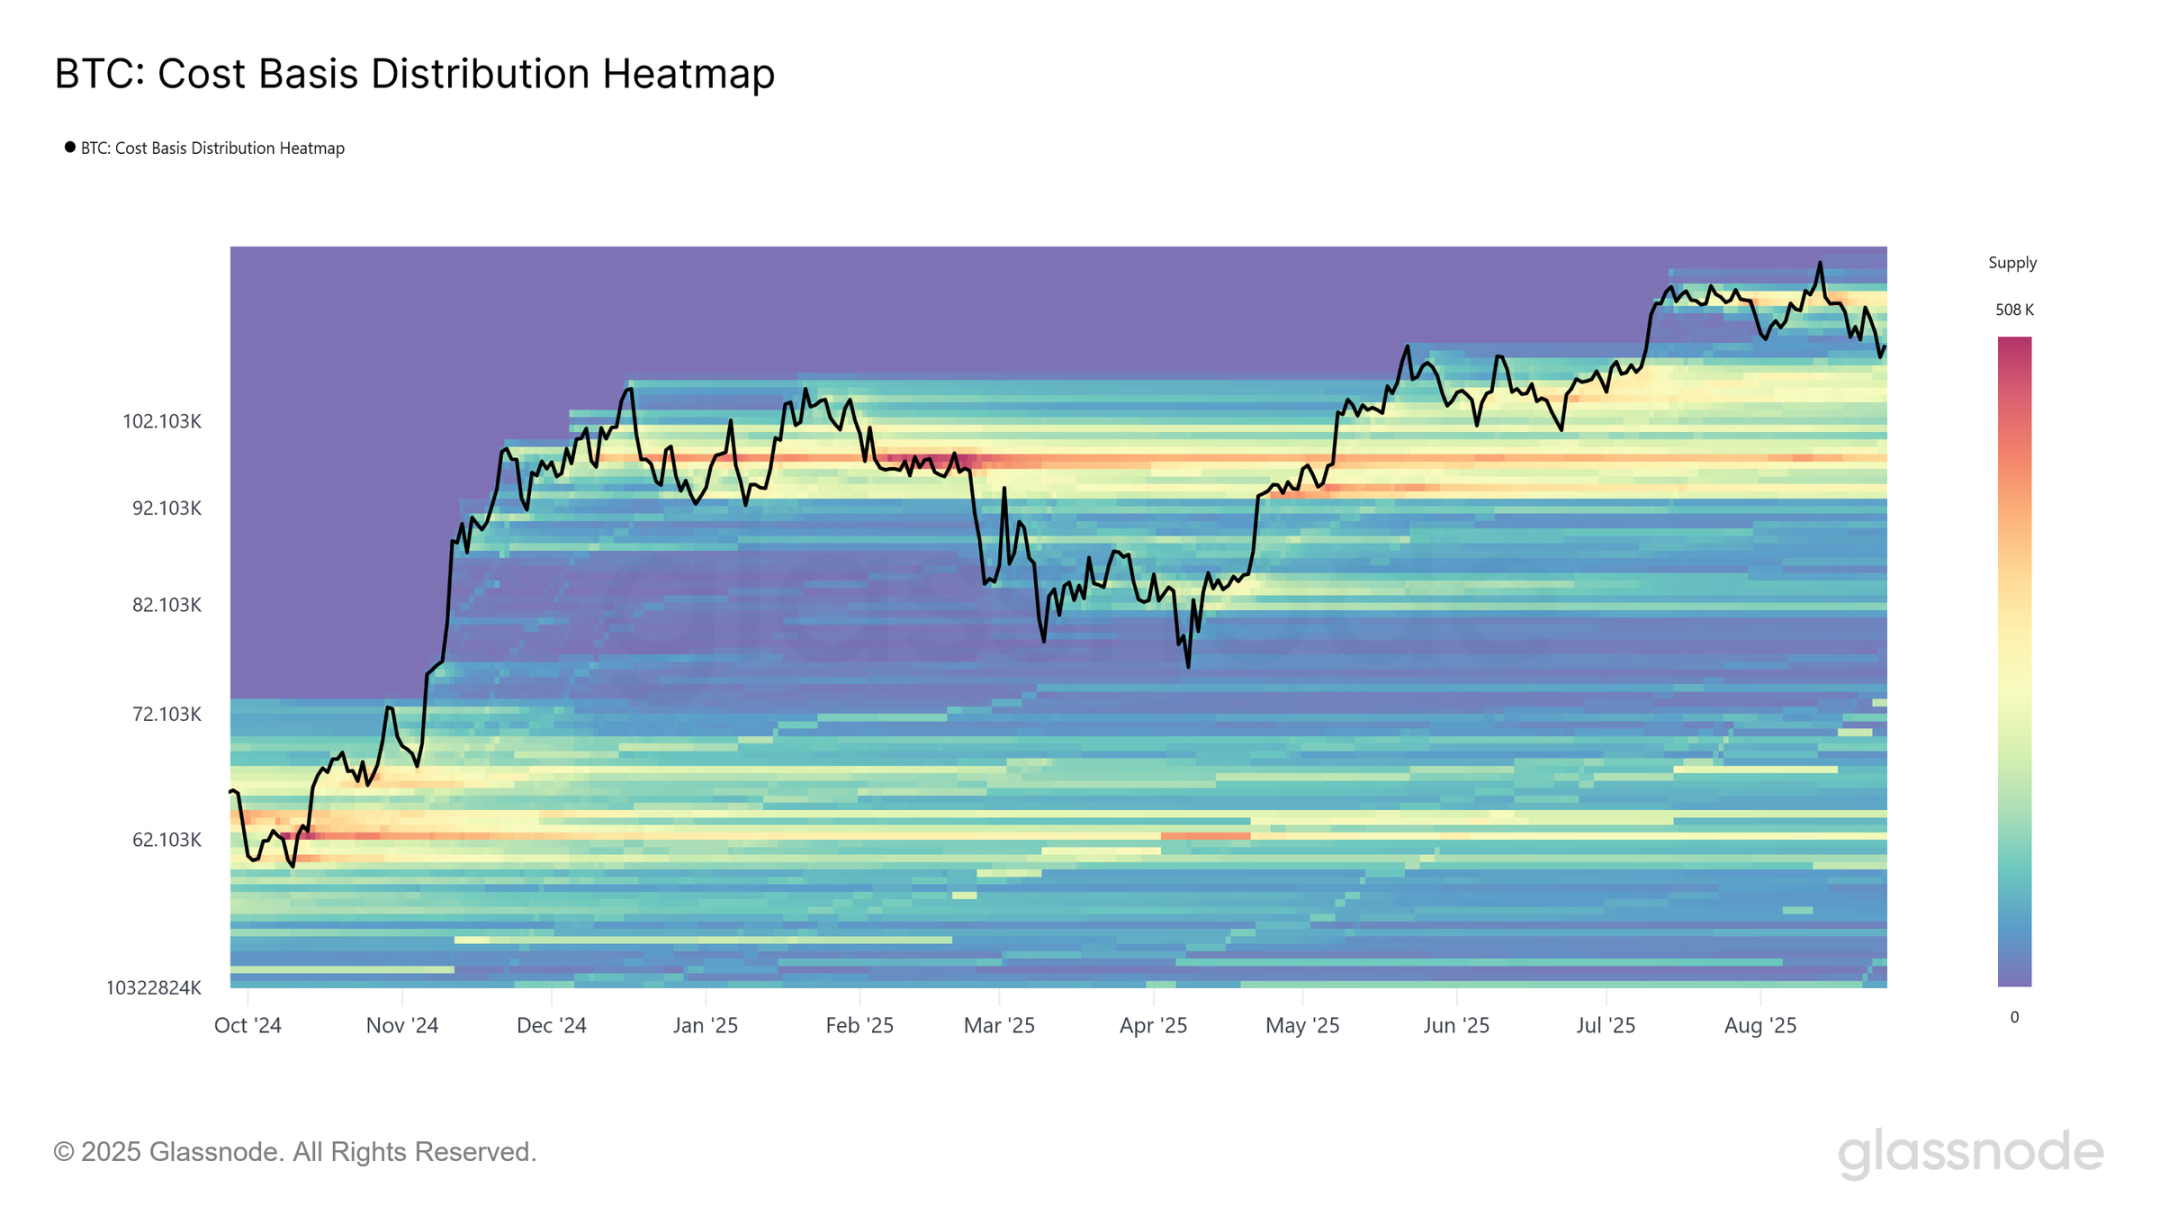
The market has entered the second week of a pullback from the historical high of $124,000, raising the question: is this merely a short pause or the beginning of a deeper retracement? To answer this, we turn to price models, starting with the Cost Basis Distribution (CBD) heatmap.
The CBD heatmap provides a visualization of the concentration of supply at different acquisition prices, highlighting significant portions of the token's last transfer. Each color band reflects dense areas of cost basis that typically act as natural support or resistance zones.
Currently, Bitcoin's trading price is close to $111,000, hovering just above the lower edge of the "price gap." The latest pullback allows for the redistribution of supply at a discount, gradually filling the gap. Notably, since December 2024, a thick supply cluster has formed between $93,000 and $110,000, gradually becoming a potential bottom.
This accumulation helps explain the current resilience above $110,000, indicating that further corrections require either significant short-term selling pressure or a longer absence of demand sufficient to force these investors to capitulate and sell.
Testing New Buyers' Patience
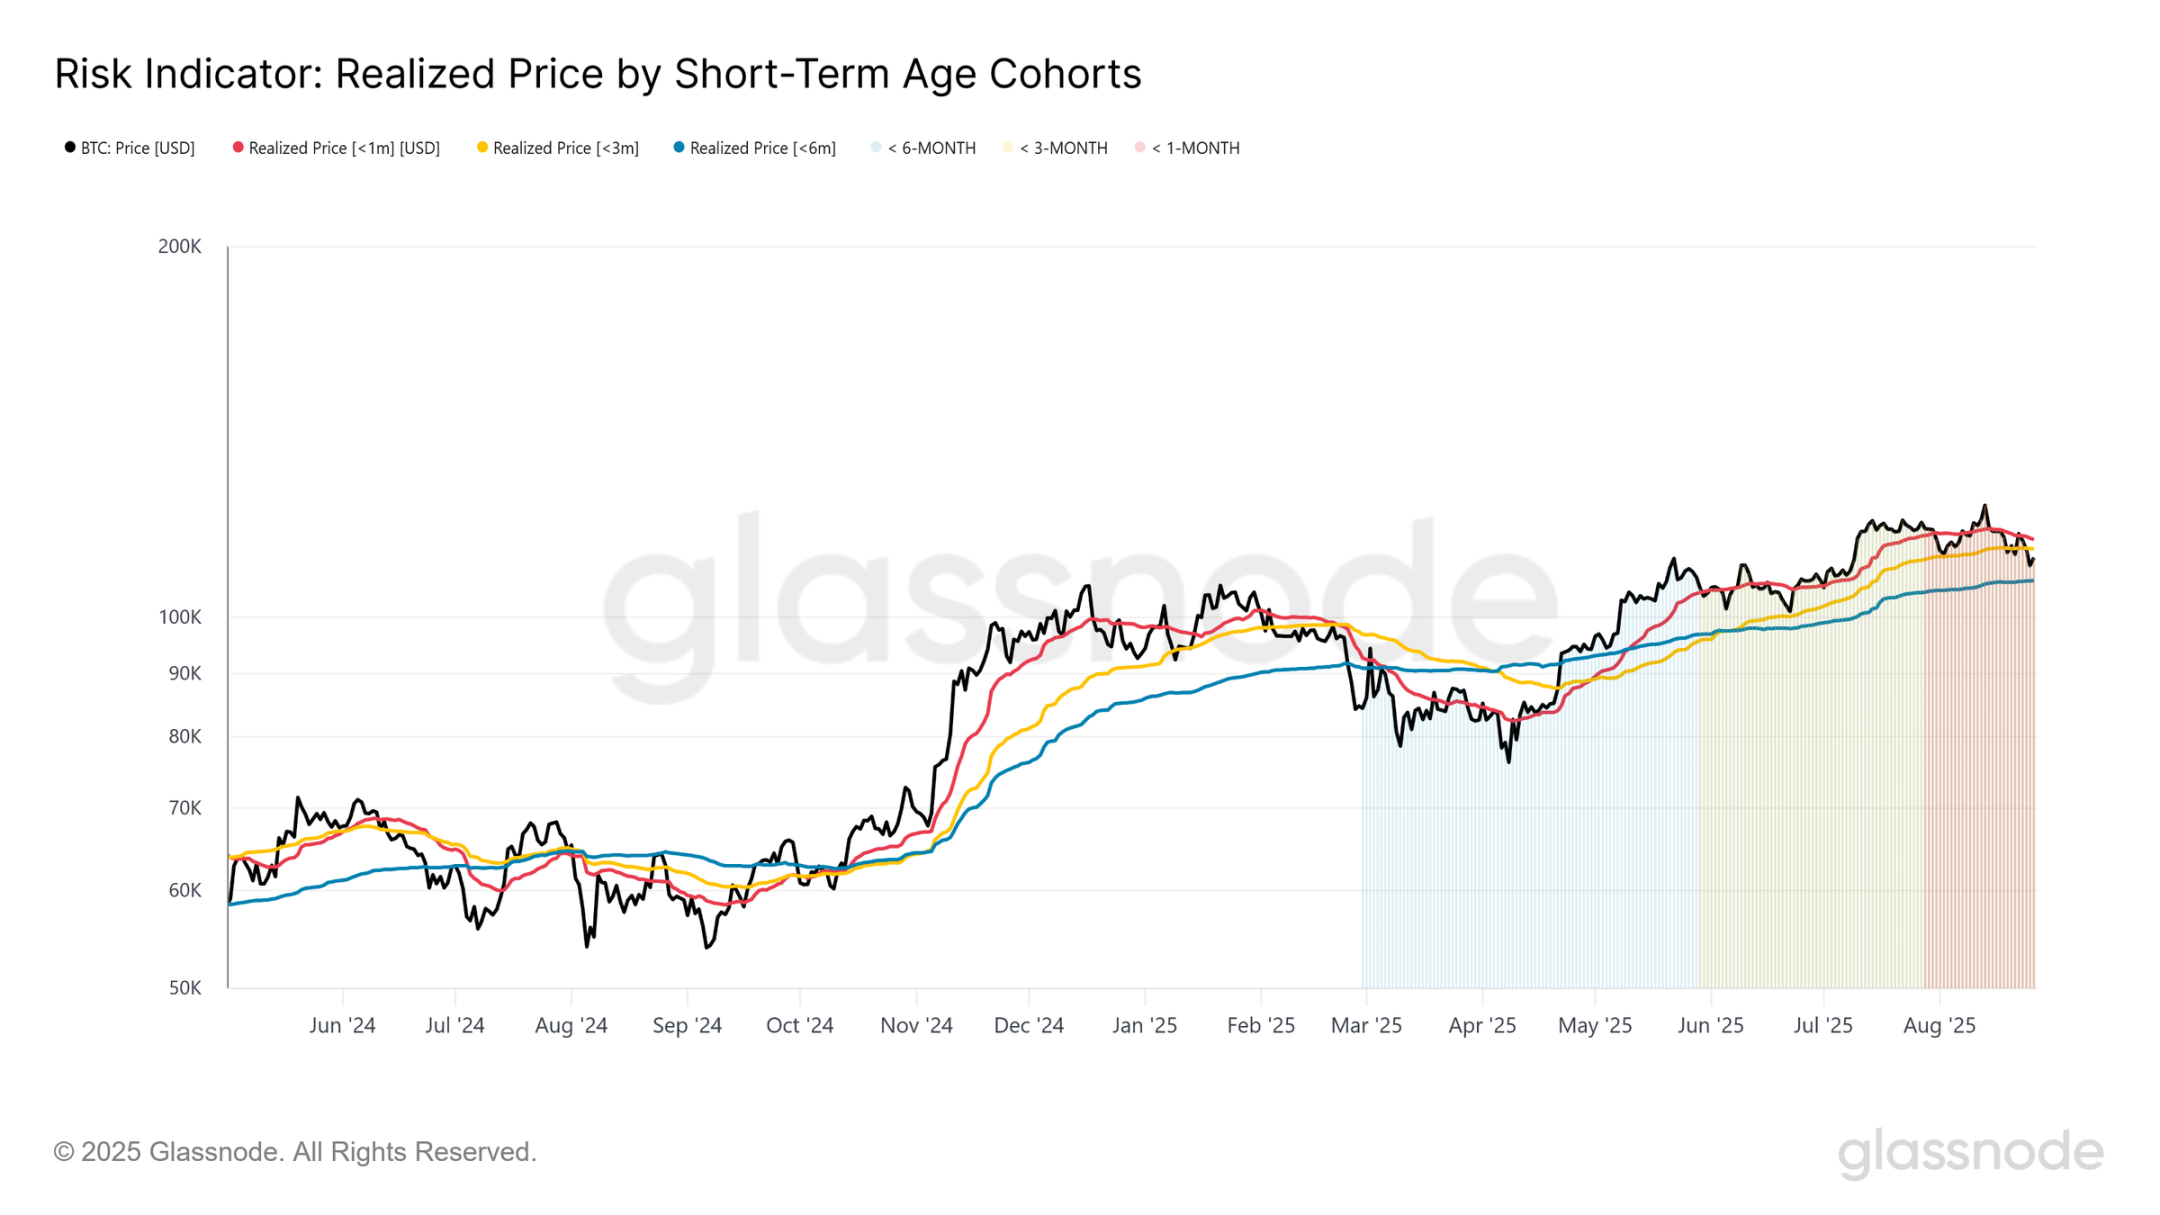
To better gauge the frustration in the market, we turn to the cost basis of recent investors. This metric captures the average acquisition price of holders who entered the market in the past 1 to 6 months, serving as a psychological benchmark. When the market trades below these levels, it typically indicates that new holders are experiencing unrealized losses, a state that may trigger selling pressure.
Currently, Bitcoin is trading below the cost basis of 1-month ($115,600) and 3-month ($113,600) holders, putting these investors under pressure. Therefore, any relief bounce may encounter resistance as short-term holders seek to exit at breakeven.
More critically, the 6-month cost basis is around $107,000. A sustained drop below this level could trigger fear, accelerating downward momentum and pointing to the lower edge of the support supply cluster highlighted in the CBD heatmap.
Mid-term Risks
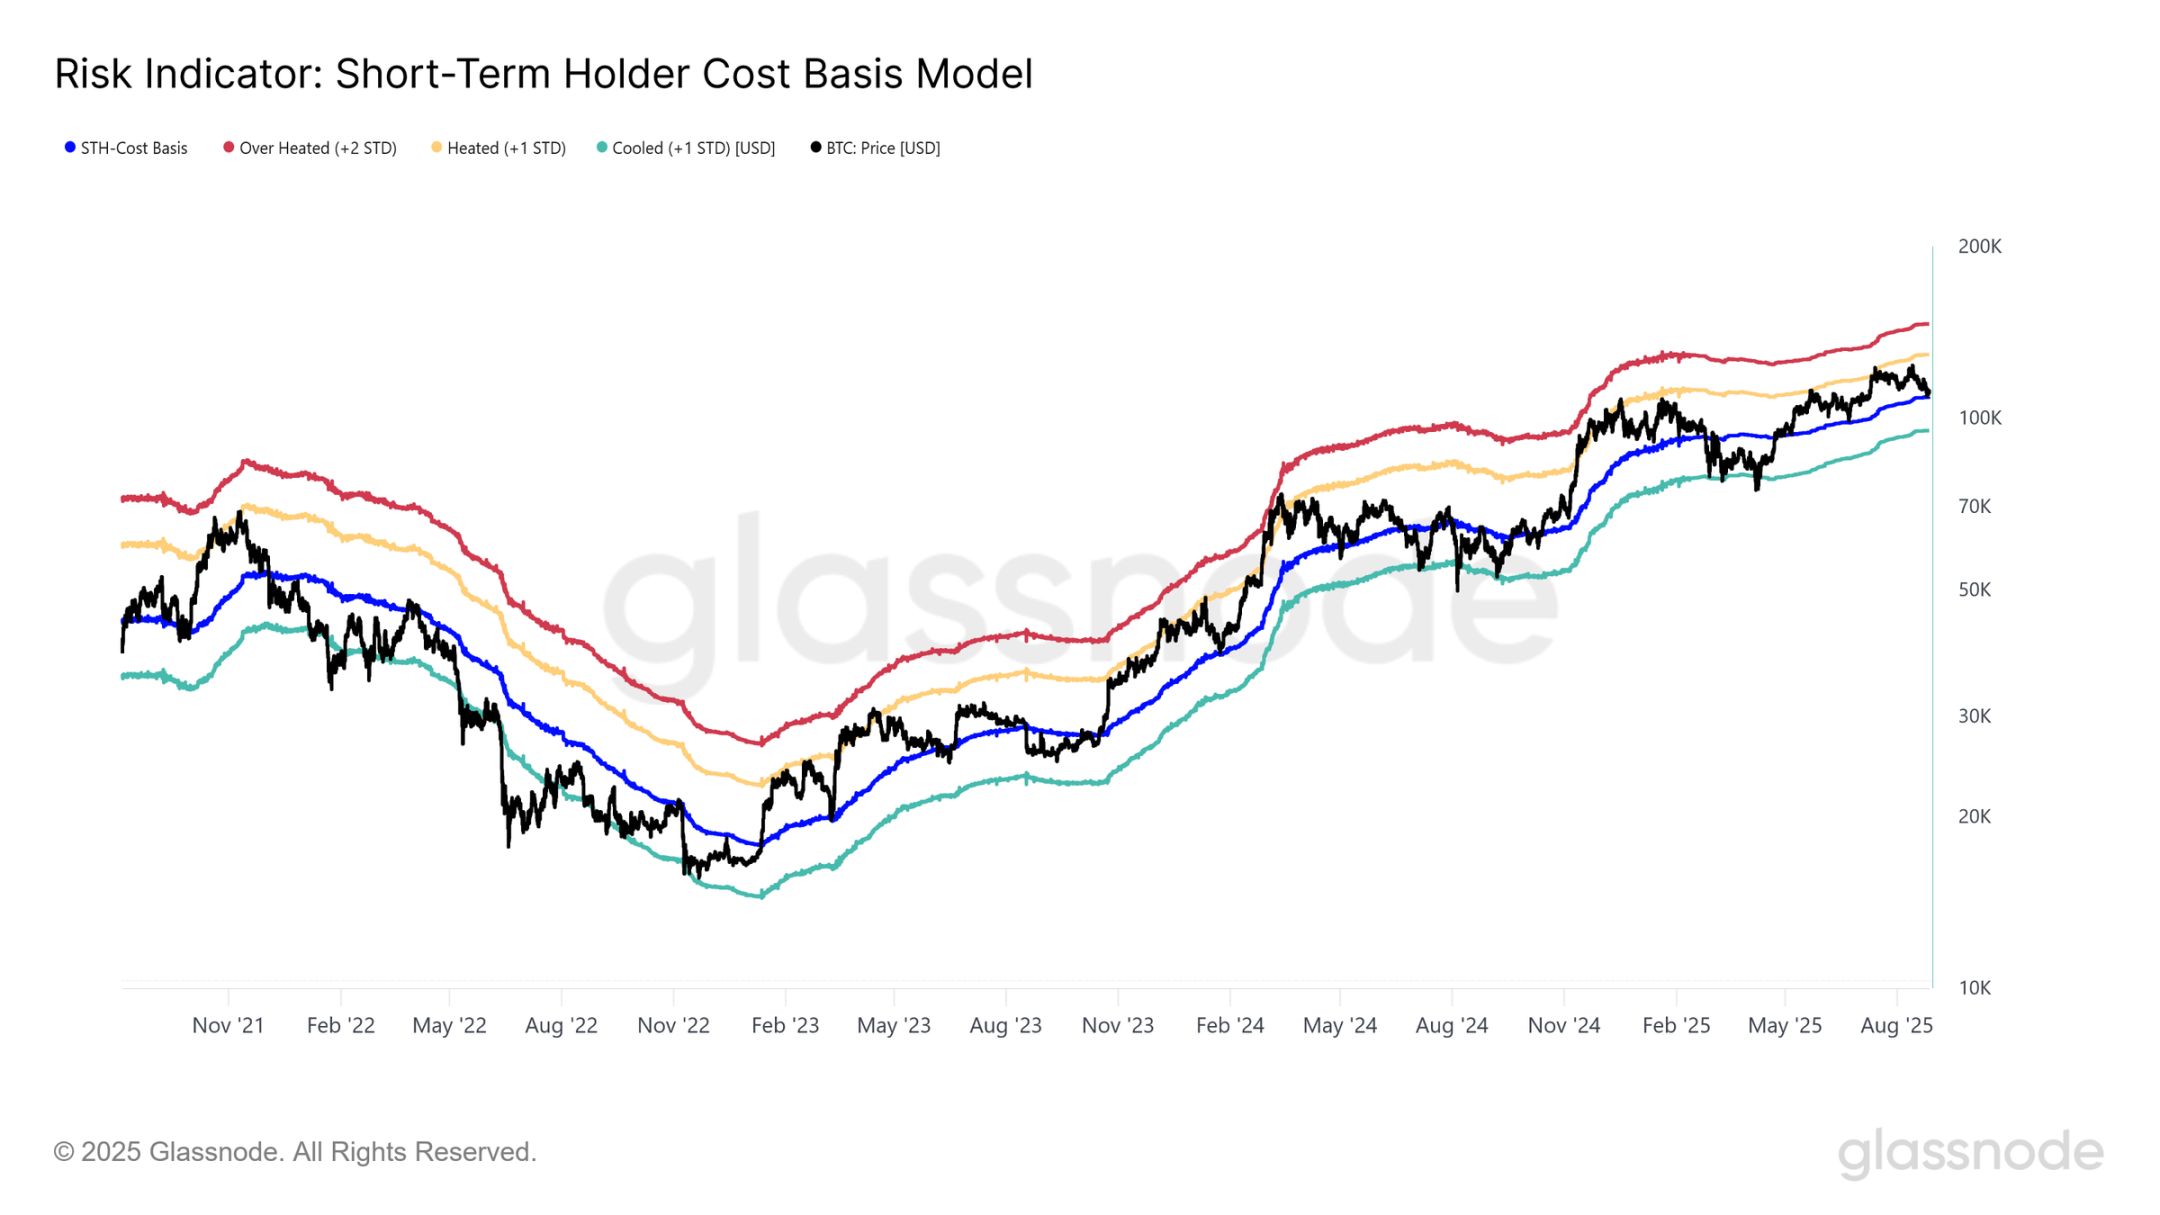
If the current weakness continues, with prices trading persistently below the short-term holders' cost basis near $108,900, history suggests caution is warranted. In past cycles, such breakouts typically herald the beginning of several months of bearish phases, as new investors sell amid increasing unrealized losses.
Framing this risk with 4-year statistical data, previous bearish pullbacks often bottomed near one standard deviation below the short-term holders' cost basis. For the current cycle, this lower bound is estimated around $95,100. Therefore, if Bitcoin fails to regain a foothold above the $107,000–$108,900 threshold, the potential mid-term bottom could form in the $93,000–$95,000 range, consistent with the previously emphasized dense support cluster in the CBD heatmap.
Past Cyclical Bear Markets
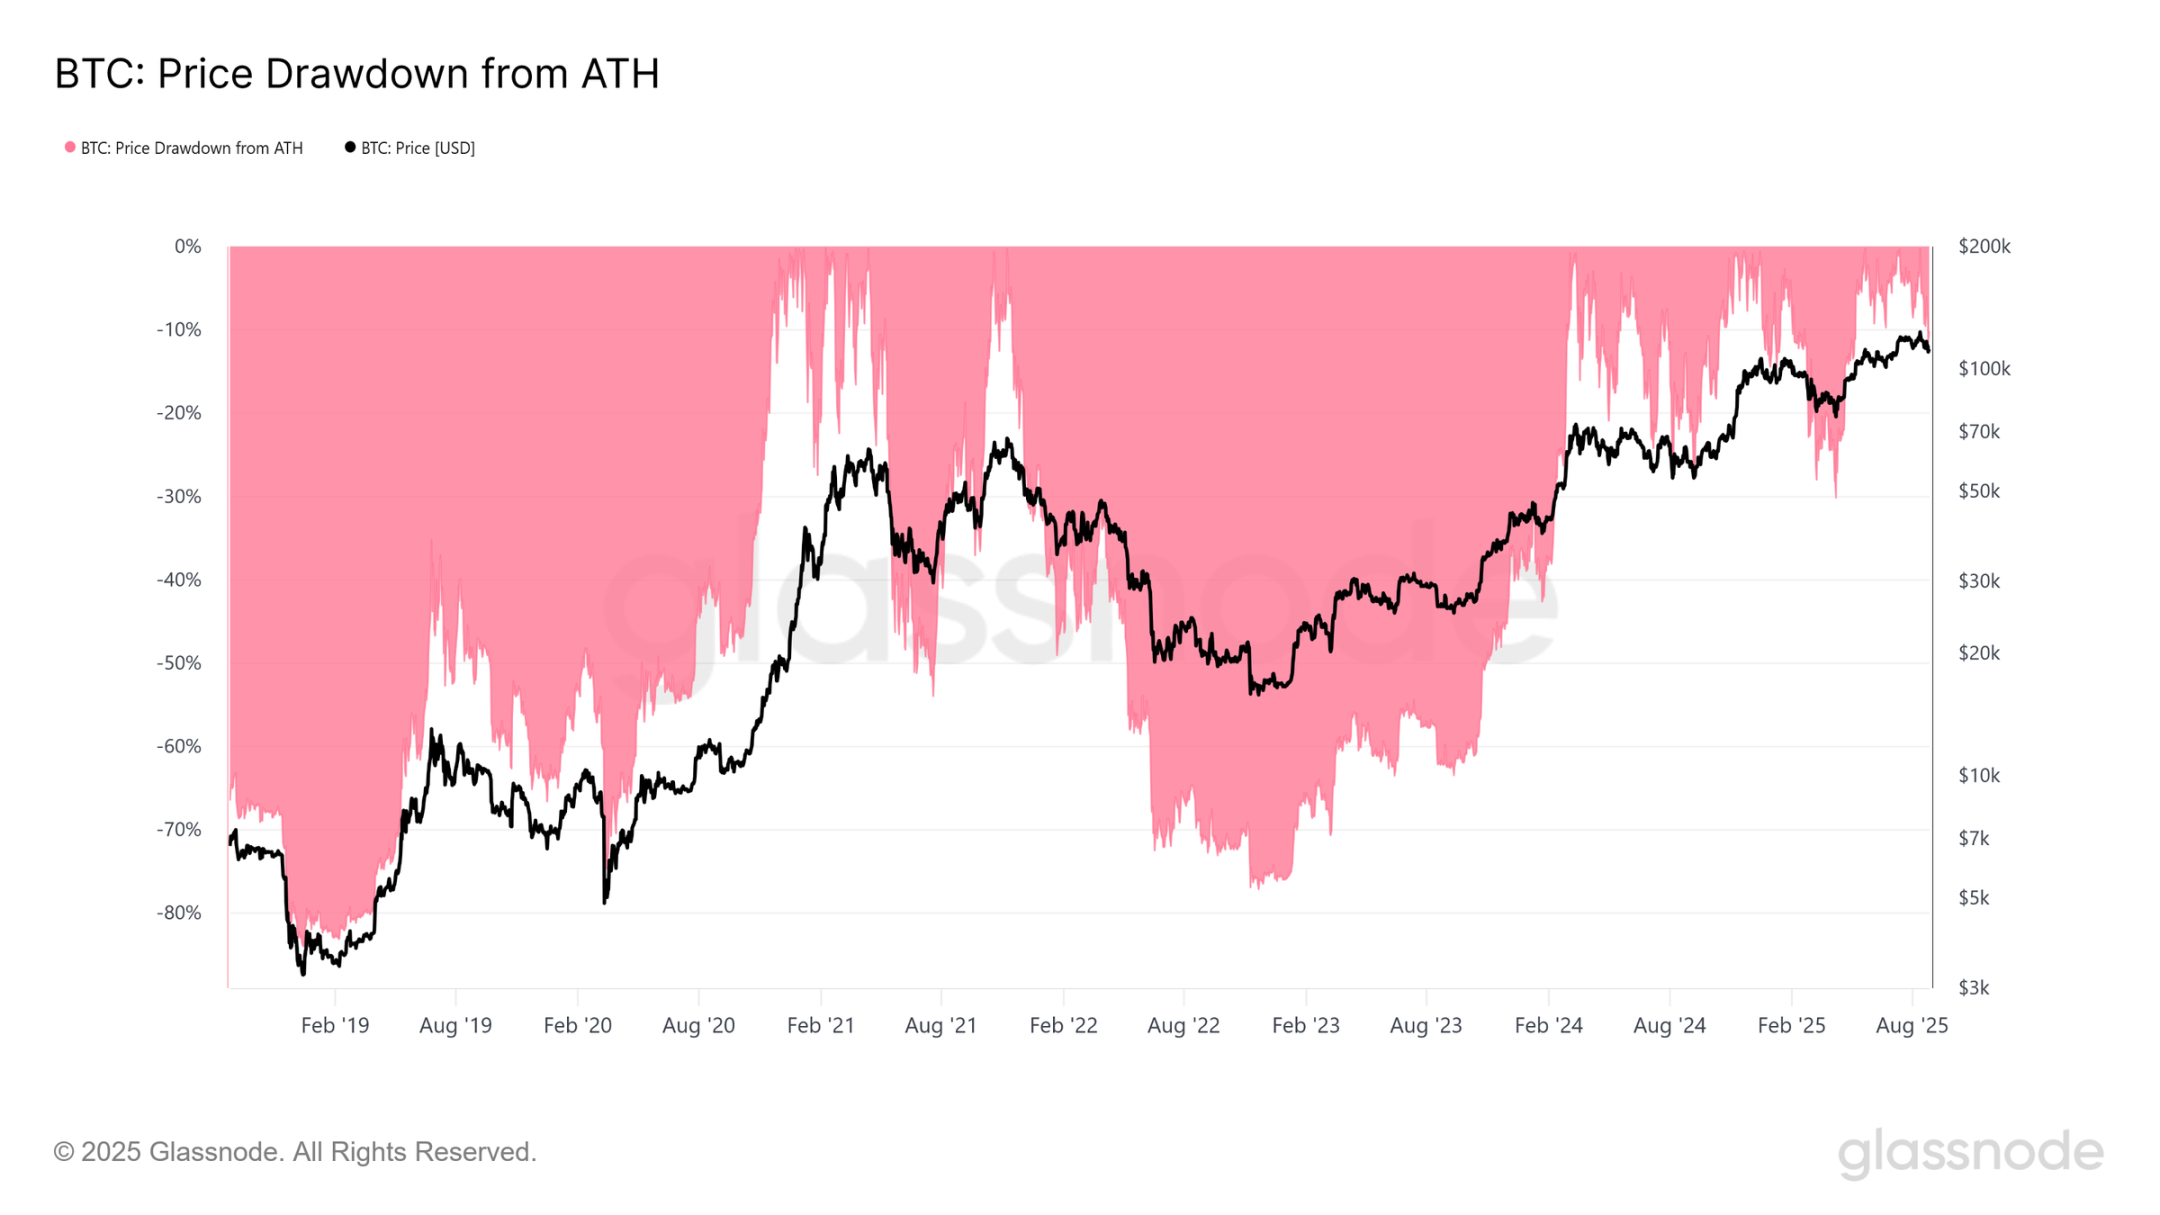
To properly view the current pain levels, we can compare today's market structure with previous cyclical extremes. Historically, bear markets are marked by severe pullbacks that either define mid-term resets or are full-blown sell-off events.
So far, the recent drop to $110,100 represents a pullback of about 11.4% from the historical high of $124,000. Compared to previous mid-term bear markets (typically over 25%) or deep cyclical lows (losses greater than 75%), the current decline is significantly milder. In this context, the intensity of the current correction remains relatively shallow, not resembling the pressure situations seen in historical extremes.
Measuring Pain Through Unrealized Losses
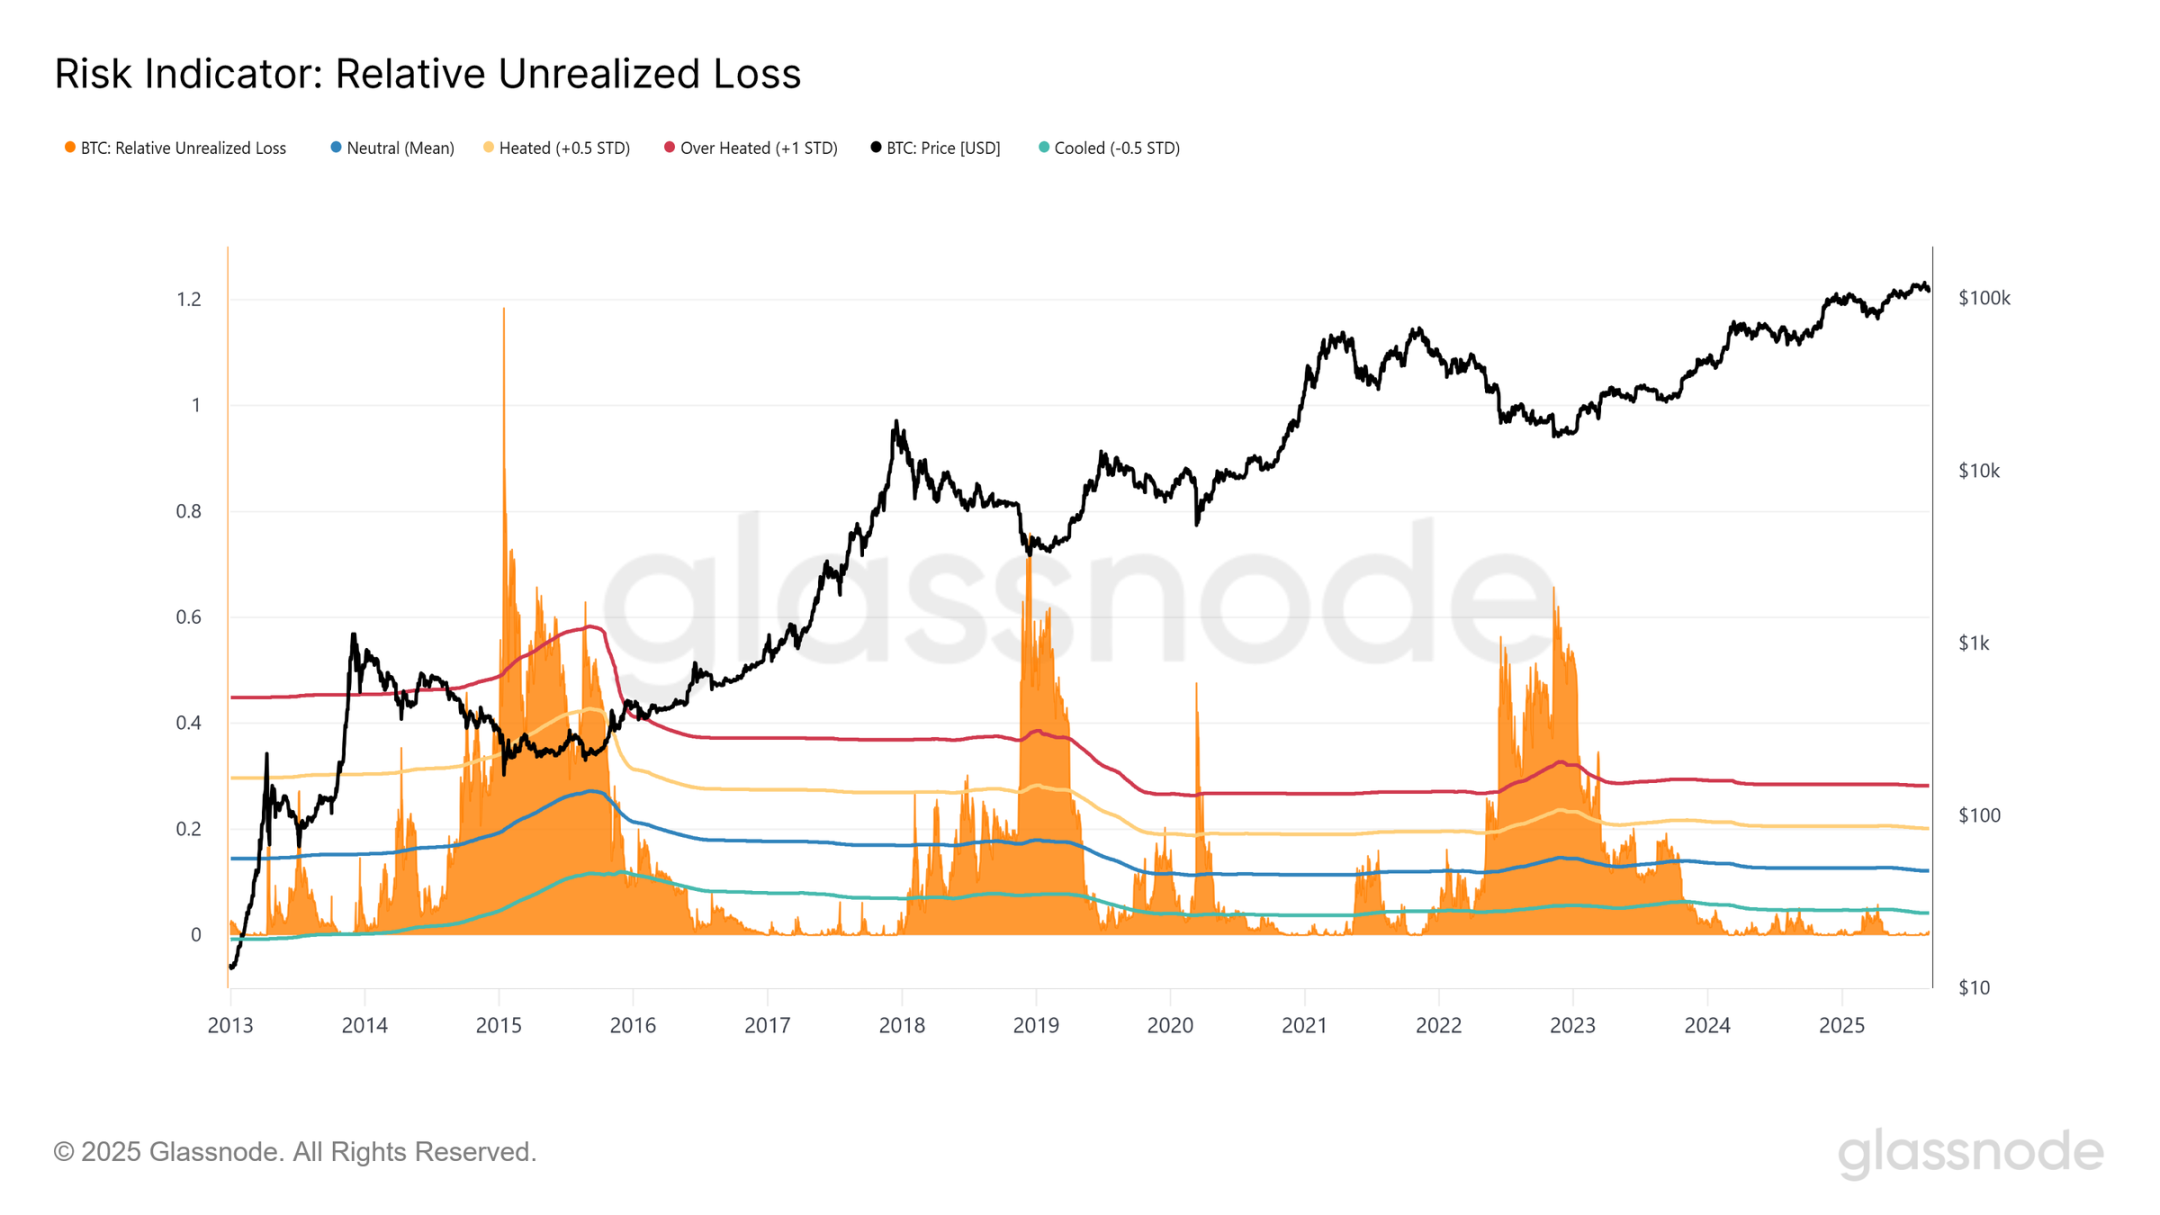
Another way to measure the current correction is through relative unrealized losses, which gauge the total losses in the market relative to market capitalization. This metric highlights the scale of pressure investors are experiencing compared to previous cycles.
Since November 2023, relative unrealized losses have mostly remained below -0.5 standard deviations, around 5%, never approaching the depths observed in the long bear markets of 2018–2020 or 2022–2023.
Currently, with Bitcoin trading close to $111,000, this metric is only at 0.5%, far below the loss levels (>30%) typically associated with deep bear market phases. This perspective reinforces the earlier conclusion: despite the recent pullback causing frustration among short-term holders, the overall market's unrealized pain remains far from historical extremes.
Realized Selling Pressure
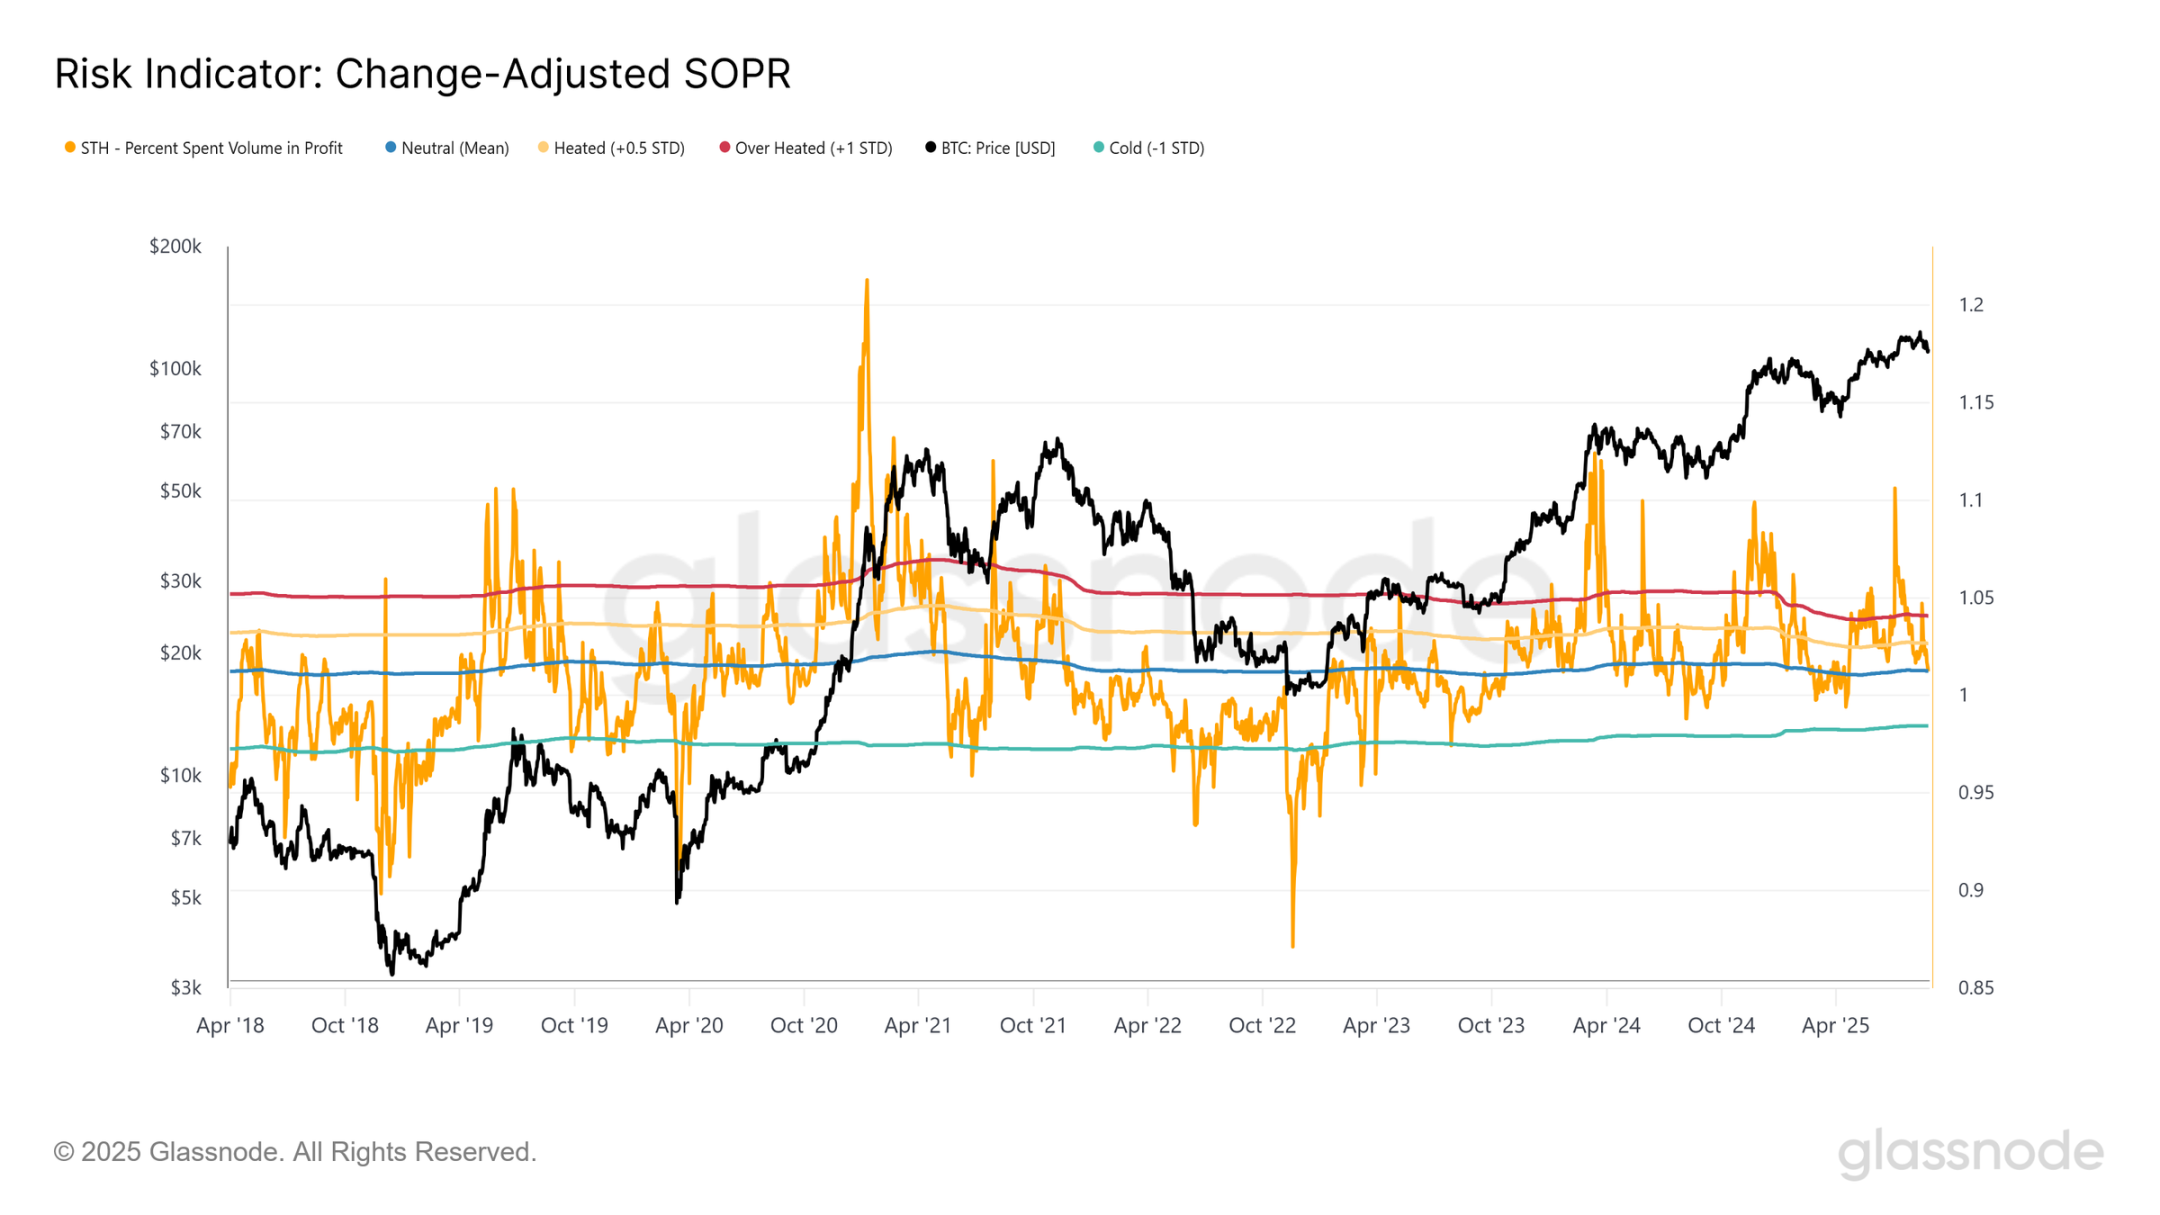
While unrealized losses provide one perspective on observing investor pressure, it is equally important to observe how much of this paper loss is actually realized on-chain. The Spent Output Profit Ratio (SOPR) provides this insight by measuring the ratio of the price at which tokens are spent to their cost basis. Values above 1 indicate profits are being realized, while values below 1 suggest tokens are being sold at a loss, signaling selling pressure.
Currently, the 7-day moving average of the adjusted SOPR (filtering out internal transfers) is near the neutral value of 1. This indicates that most active investors are neither realizing significant profits nor losses, a sign of uncertainty.
Historically, cyclical lows are only confirmed when this metric falls below 0.98, marking widespread sell-offs across the market. The lack of such signals currently suggests that, despite increasing anxiety, the market has yet to experience the deep losses that define a true bear market bottom.
Neutralization in the Spot Market
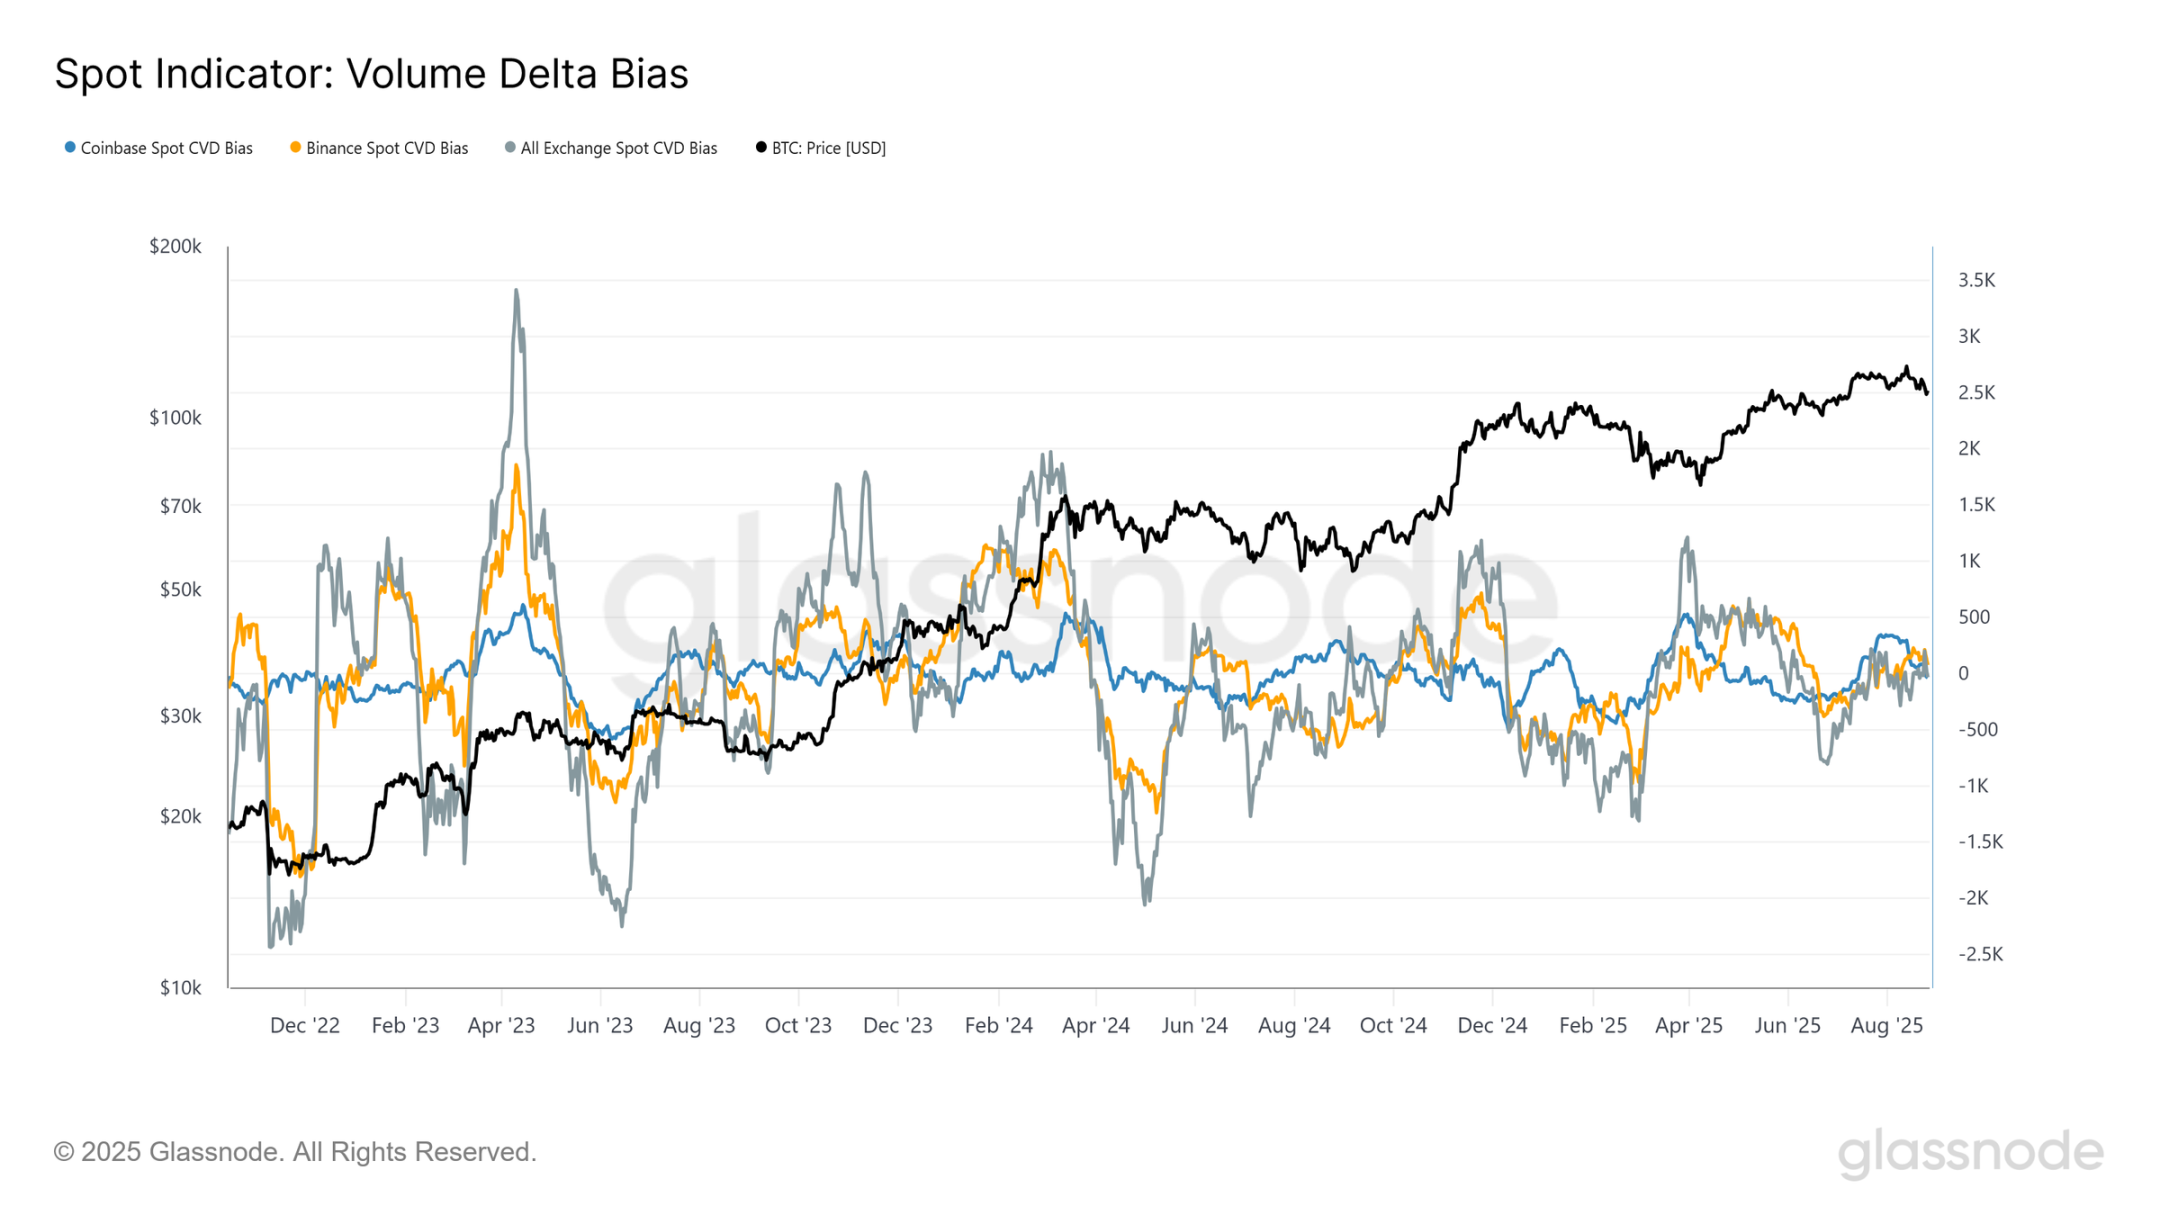
After establishing statistical boundaries for potential price outcomes through on-chain analysis, we can turn to off-chain data to assess sentiment from the perspective of exchange order books. A useful perspective is the Cumulative Volume Delta (CVD), which tracks the net difference between trades initiated by buyers and sellers, then aggregates this imbalance into a cumulative signal.
To measure the shift in spot market behavior, we compare the 30-day moving average of the CVD with its 180-day median. In major venues like Coinbase and Binance, as well as aggregated exchange flows, this bias has recently converged to zero. This represents a significant change from the strong buying pressure observed in April 2025, which drove a rebound from $72,000. While the slight positive value in July helped propel the rebound to $124,000, the broader trend now reflects the neutralization of spot sentiment, indicating weakened conviction among buyers at current levels.
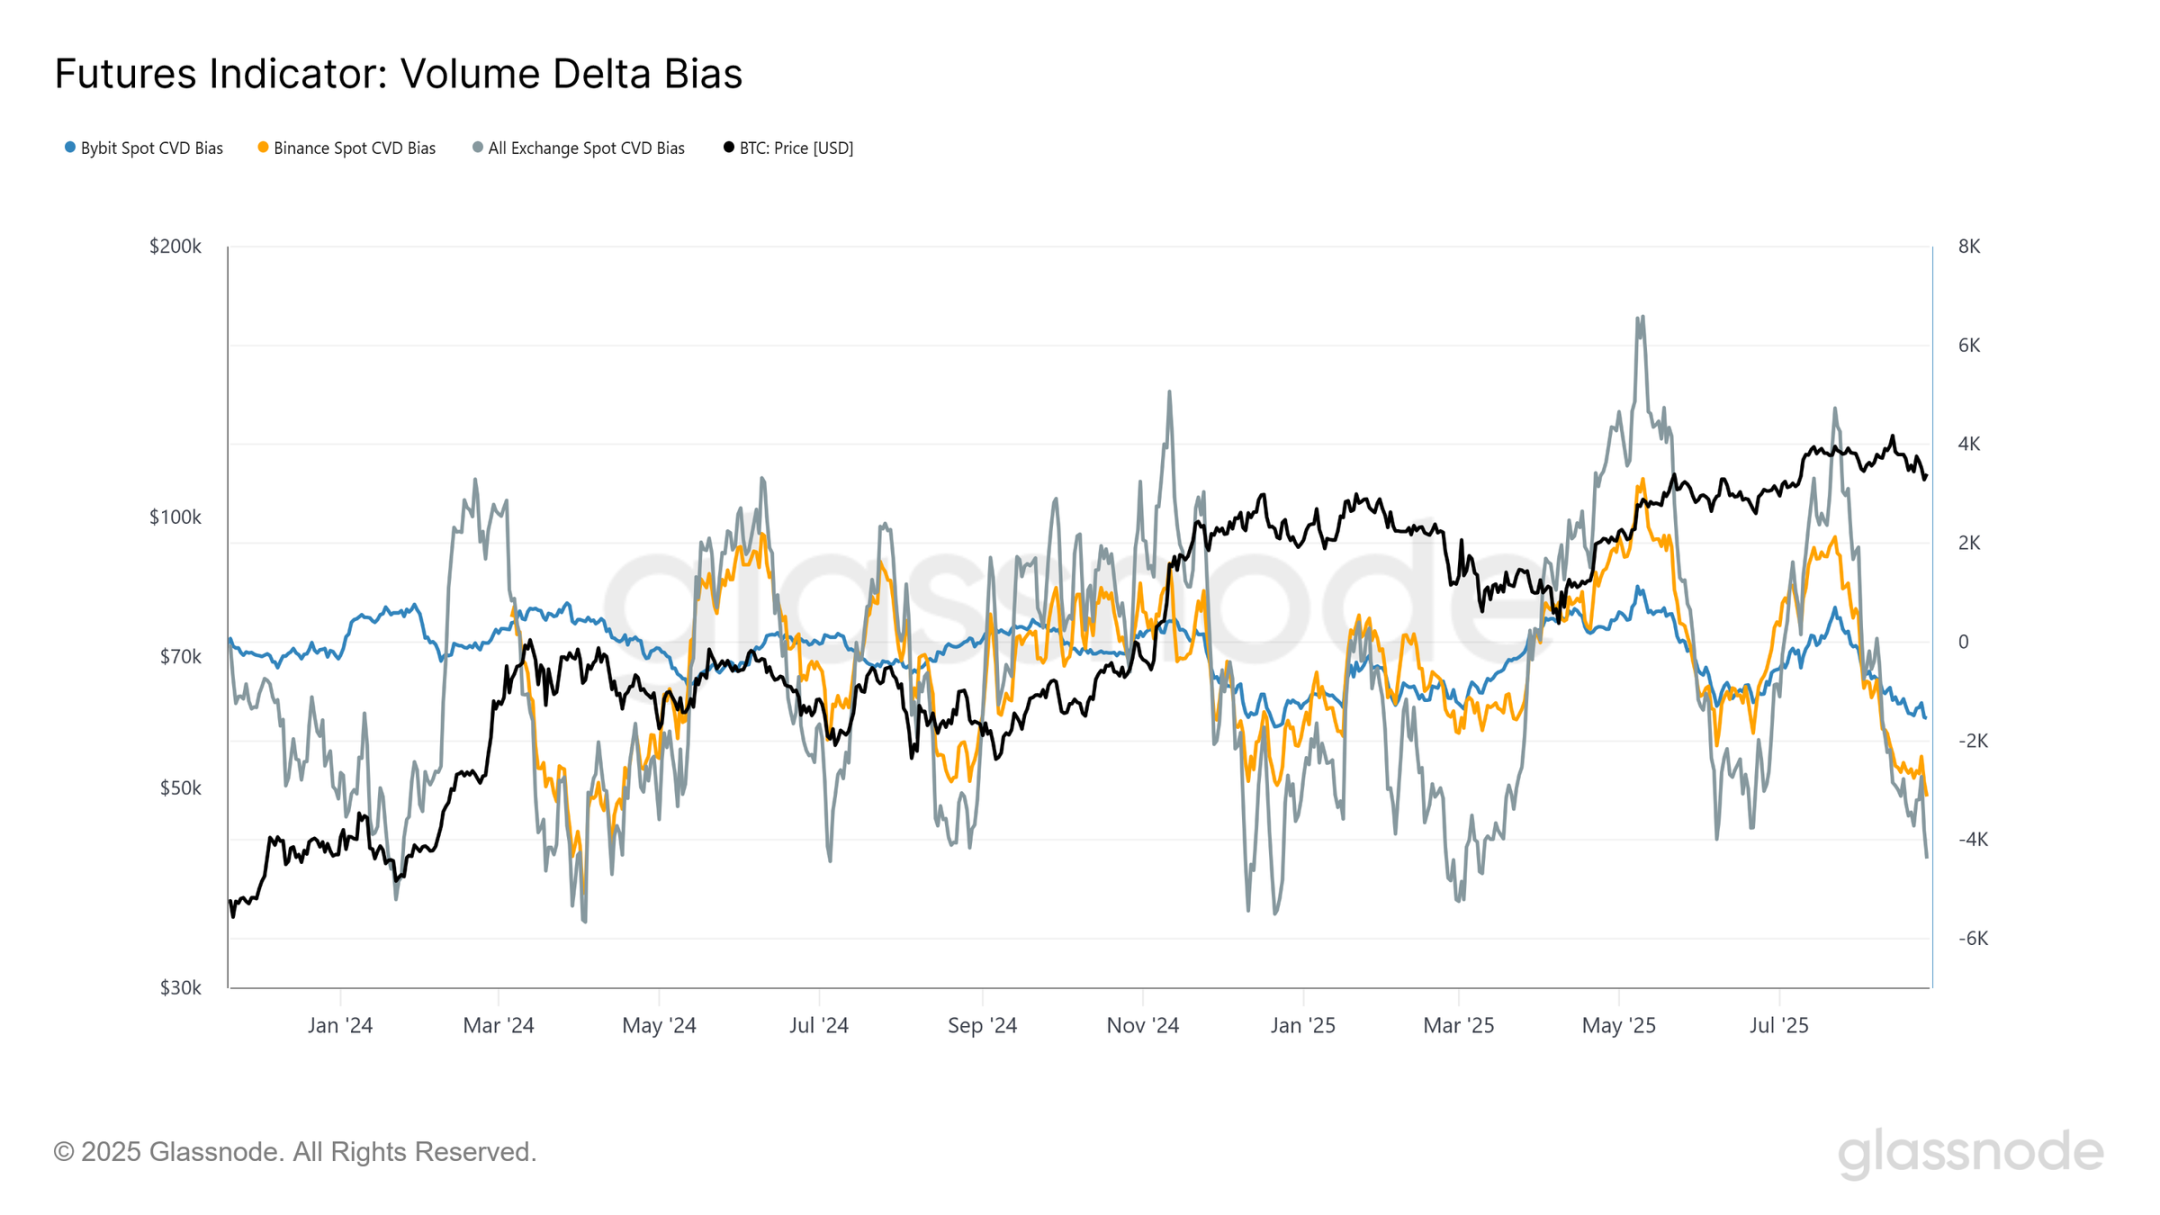
Perpetual Contracts Lean Bearish
In contrast to the neutral tone of the spot market, the situation in perpetual futures has decisively turned bearish. Since July, the CVD bias on Binance, Bybit, and aggregated exchanges has dropped into negative territory, indicating increasingly unbalanced selling pressure. This suggests that perpetual traders (often the more speculative part of the market) are inclined to short during the recent pullback.
That said, this indicator is highly volatile, frequently oscillating between extremes of buying and selling pressure in the short term. While the current bias highlights an increasing bearish trend, it should be closely monitored to confirm whether this negativity is a sustained trend or merely a transient fluctuation in perpetual contracts.
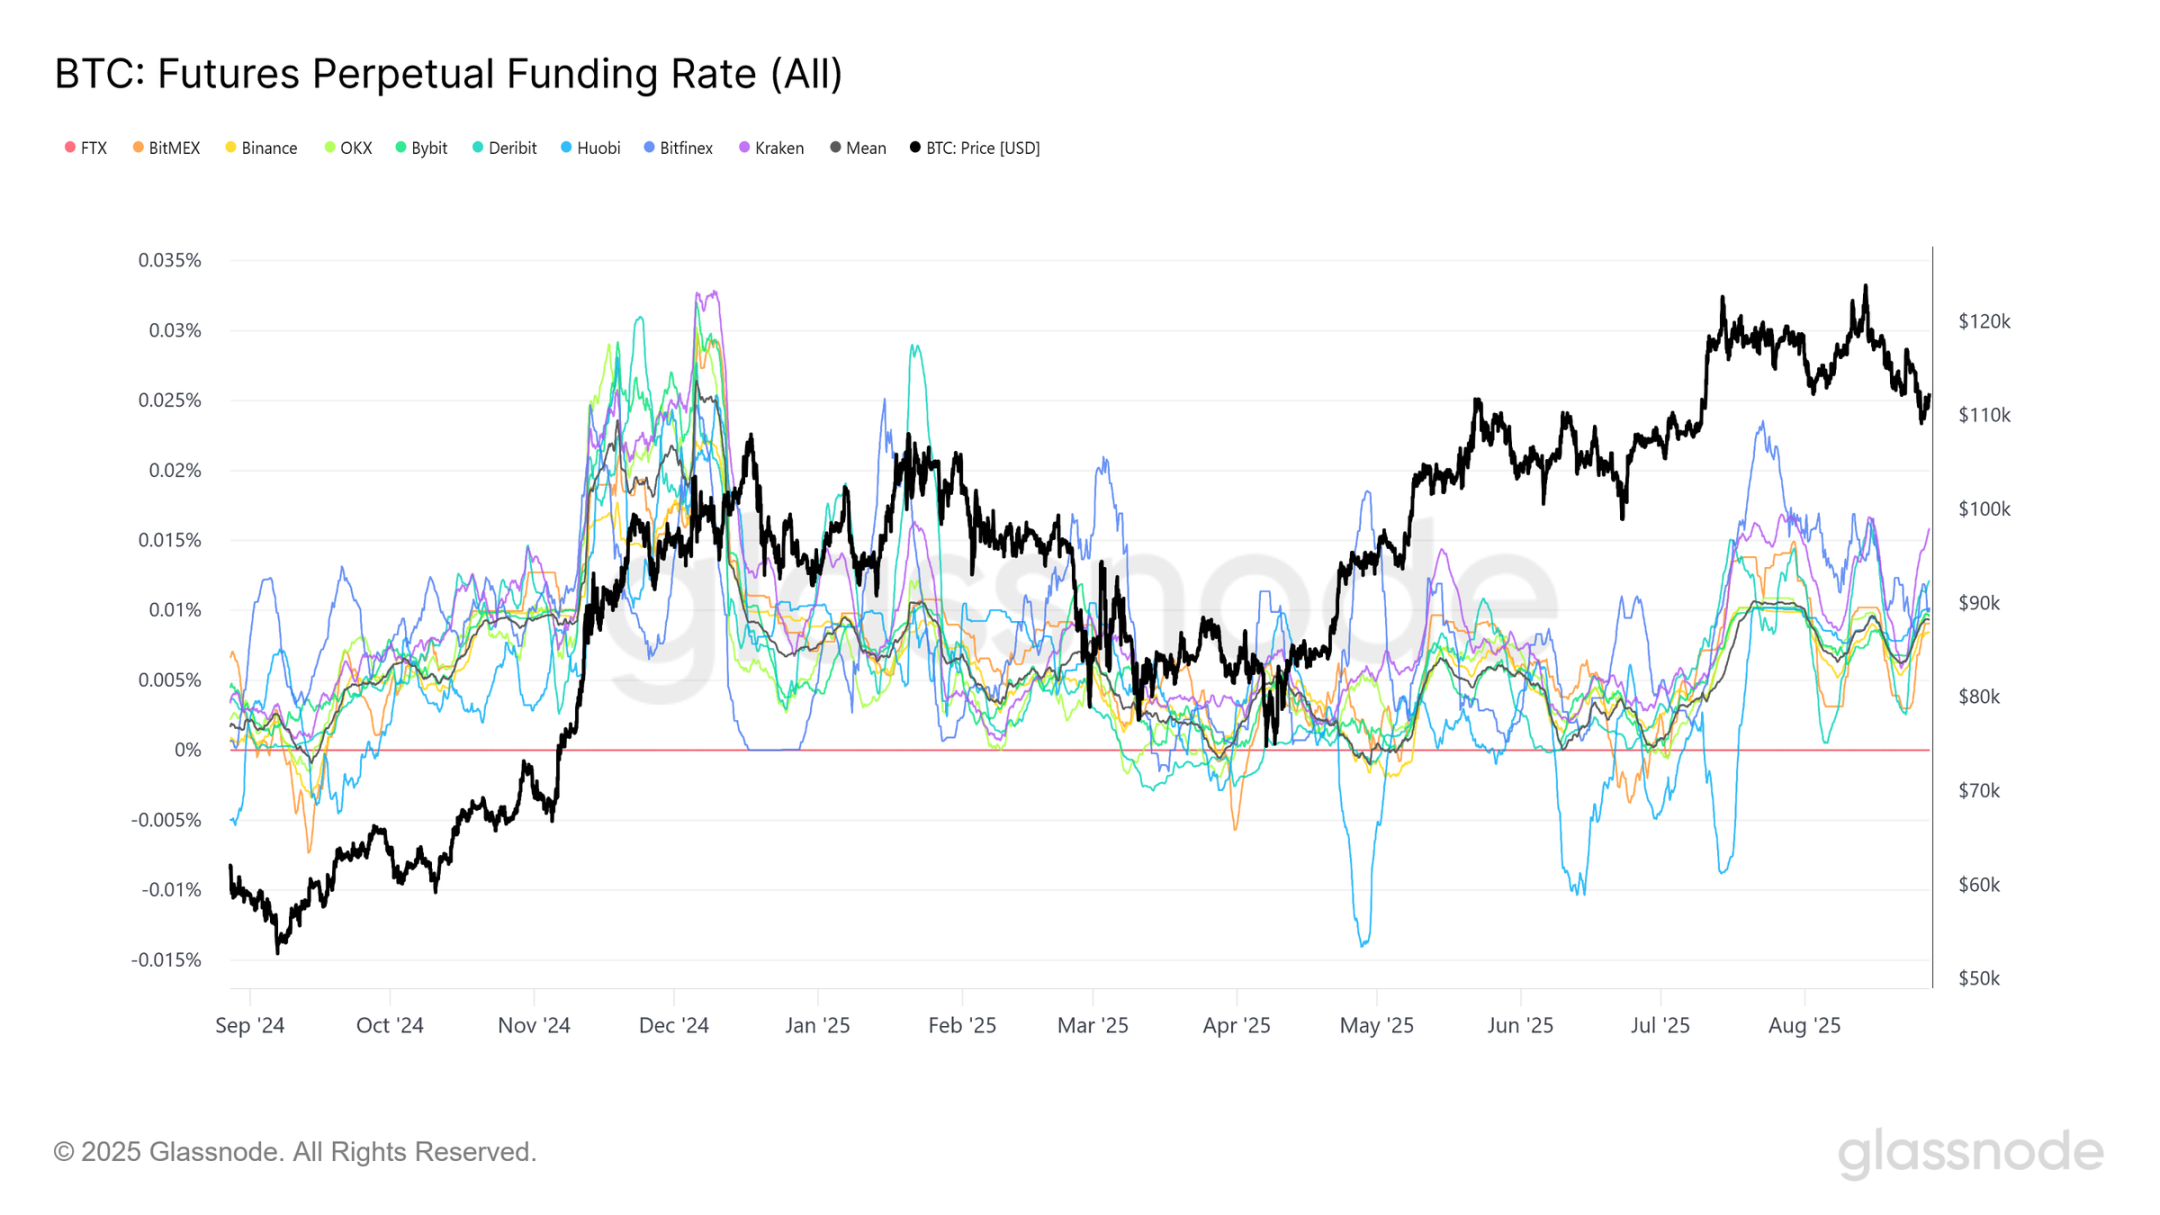
Weak Neutrality
To confirm the broader sentiment in the perpetual market, we can pair CVD analysis with funding rates, which track the cost of holding long and short positions. The 7-day moving average funding rate on major exchanges is currently around 0.01%.
This pattern suggests that while some leveraged traders are attempting to bottom-fish, their buying is insufficient to alter the overall balance. Instead, the market remains in a neutral but fragile state, where a moderate increase in selling pressure could quickly shift sentiment to bearish.
Conclusion
Bitcoin's pullback to $111,000 is testing a key range in the market. The cost basis of recent investors at $107,000–$108,900 marks critical support, and a breach would open the path to $93,000–$95,000, where a dense supply cluster may form a mid-term bottom. A rebound to $113,600 is possible but may encounter resistance as pressured short-term holders sell during strength.
Meanwhile, unrealized and realized losses remain shallow, and SOPR has not issued widespread selling signals. Off-chain, spot demand has neutralized, while perpetual futures lean bearish and fragile. Overall, compared to past cycles, the current correction is mild, but buying conviction has weakened, keeping the market balanced between resilience and further downside.
免责声明:本文章仅代表作者个人观点,不代表本平台的立场和观点。本文章仅供信息分享,不构成对任何人的任何投资建议。用户与作者之间的任何争议,与本平台无关。如网页中刊载的文章或图片涉及侵权,请提供相关的权利证明和身份证明发送邮件到support@aicoin.com,本平台相关工作人员将会进行核查。


