Solana 今天再次闪耀,在其他大部分横盘的加密市场中成为一个亮点。
Bitcoin 和 Ethereum,这两种市值最高的加密资产,均小幅上涨约 2%,帮助整体市场再次突破 3.9 万亿美元。但 Solana 在主要加密货币中领跑,过去 24 小时上涨了 8%,目前交易价格超过 209 美元。SOL 能否维持这种势头?
加密市场的反弹正值传统市场找到支撑之际,标准普尔 500 指数上涨 0.69% 至 6,481 点,科技股重的纳斯达克上涨 0.4% 至 21,544 点。投资者的风险偏好几乎在各个方向上都在增加,布伦特原油上涨 0.94% 至每桶 67.85 美元,而黄金(通常被视为风险对冲工具)略微回落,下降 0.18% 至每盎司 3,383 美元。
这种广泛的市场反弹可能表明,在经历了一段整合期后,投资者信心恢复,尽管不同资产之间的强度差异暗示可能会向特定的山寨币轮动。因此,Solana 可能是交易者关注的下一个交易对象。
市场指标是否支持这一观点?让我们深入数据。
Solana (SOL) 价格:稳步而坚定
Solana 从 195 美元的开盘价上涨至 209.33 美元的高点,可以被经验丰富的交易者视为加密市场波动中的又一天。自四月以来,该币逐渐上升,现在正在测试今天高点的强阻力位。

Solana 价格数据。图片来源:Tradingview
但即使面临挑战的目标,技术图形仍显示出一些强度。
平均方向指数(ADX)目前在 Solana 上为 28。这个读数确认了交易者在屏幕上看到的——一个强劲但缓慢的趋势环境。ADX 在 0 到 100 的范围内测量趋势强度,读数超过 25 表示趋势已建立。在 28 的情况下,Solana 的 ADX 表明这不仅仅是噪音,而是真正的方向性运动,趋势跟随交易者通常会寻找这种运动。
相对强弱指数(RSI)为 60,处于交易者认为的看涨区域,但尚未达到“过度炒作”的境地。RSI 在 0 到 100 之间测量动量,读数超过 70 通常表示市场条件超买并触发获利了结。在 60 的情况下,SOL 在算法卖出开始之前还有上涨空间,这表明在遇到阻力之前可能还有 10-15% 的上涨空间。这对依赖这些水平来把握进出时机的动量交易者至关重要。
挤压动量指标显示,交易者在推动价格突破阻力方面面临困难,未来可能会出现一些价格压缩。如果看涨指标保持有效,那么市场可能准备突破其整合阶段,通常会导致多日或多周的走势。
交易者使用指数移动平均线来评估价格支撑和阻力,EMA 计算给定资产在设定时间段内的平均价格。Solana 的 50 日指数移动平均线,即过去 50 天的平均价格,为当前价格提供了下方支撑。200 日 EMA 更低,提供进一步支撑,并指向交易者的另一个看涨情景。换句话说,当前 SOL 的价格高于其短期和长期的平均价格,如果你是 Solana 的看涨者,这是一件好事。
这两个 EMA 之间的小间隙表明,尽管 SOL 的价格在上涨,但上涨速度非常缓慢,这与其他仅仅在降温的币种不同。这种配置通常出现在强劲的上升趋势中,为买家提供了多次在回调时入场的机会,这也是许多交易者将其视为潜在强度的原因。
因此,交易者在预测市场上开始对 Solana 振作起来也就不足为奇了。在 Myriad,这是由 Decrypt 的母公司 Dastan 开发的预测市场,Solana 达到新历史高点超过 294 美元的概率今天开始上升。就在两天前,空头占据主导地位,将今年 SOL 新历史高点的概率仅定为 34%。而今天,这一概率已经飙升至略高于 50%。
Myriad 的交易者目前将其称为抛硬币,但至少在过去两天,趋势是明确的。
另一个市场要求 Myriad 用户预测哪个会先到来:Solana 涨至 250 美元,还是跌至 130 美元?在这个市场上,多头以较大优势领先。交易者目前将 SOL 在跌至 130 美元之前达到 250 美元的概率定为 71%。
关键水平:
立即支撑:200 美元(心理水平和突破点)
强支撑:180 美元(50 日 EMA 区域)
立即阻力:210 美元(今天的高点)
强阻力:220-240 美元(根据测量移动得出的技术目标)
比特币(BTC)价格:恐怖区域中的一根绿色蜡烛
在评估山寨币的潜在轨迹时,将其与市场领导者比特币进行比较是有帮助的。
比特币今天的旅程从 111,789 美元开盘,随后上涨至 112,646 美元,最后稳定在 112,173 美元, modest 0.34% 的涨幅,讲述了一个整合而非信心的故事。今天的蜡烛图形看起来有望录得涨幅并抹去昨天的损失,但技术指标表明,加密之王仍在喘息。
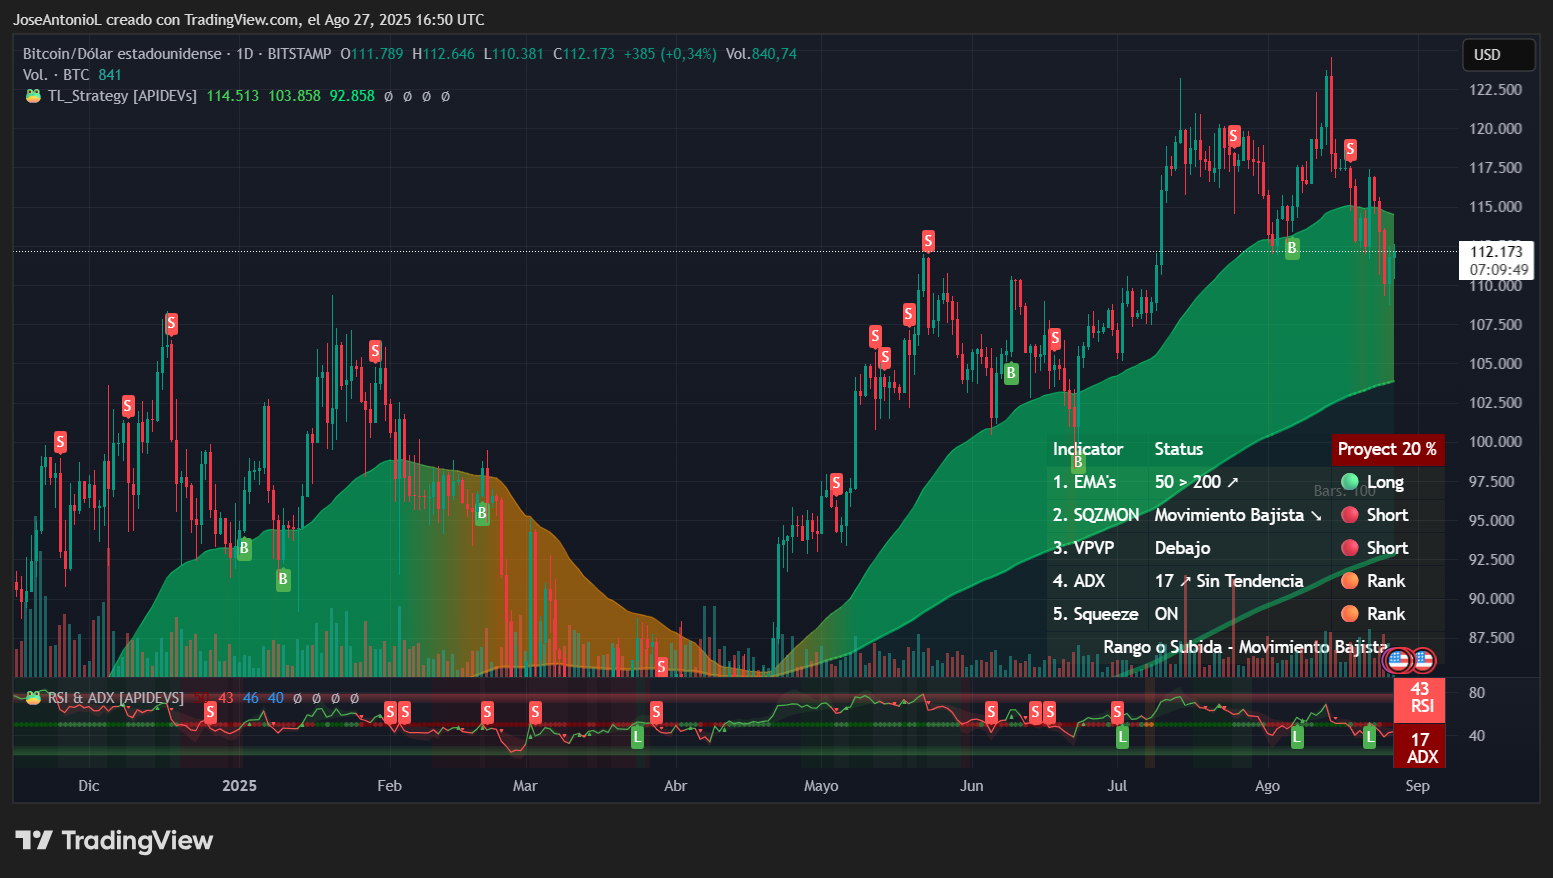
比特币价格数据。图片来源:Tradingview
比特币市场目前的表现足以翻转 Myriad 上最活跃的预测市场之一的赔率。两周前,Myriad 的“比特币的下一个高点”市场要求交易者预测 BTC 是否会涨至 125K 美元或跌至 105K 美元,月球情景的概率超过 90%。现在,这一概率已经翻转,60% 支持将 BTC 下跌至 105K 美元的情景。
换句话说,比特币多头在过去两周中逐渐失去信心。再次查看图表,不难看出原因。
比特币的 ADX 为 17,显示出市场没有明确的方向。这个指标测量趋势强度而不考虑方向,表明读数低于 20 表示没有趋势,交易波动无方向。在 17 的情况下,比特币的 ADX 告诉交易者我们处于无人区——炒作正在消退,多头和空头都没有控制权。这通常意味着区间交易,在这个过程中,买入支撑和卖出阻力形成了横盘整理,这让趋势跟随者感到沮丧,但奖励耐心的区间交易者。
RSI 在 43,描绘出略微看跌但并不严重的局面。可以将 RSI 看作是价格动量的速度计。读数低于 50 表示卖压超过买入。在 43 时,比特币就像一辆燃料不足但尚未耗尽的汽车。逆势交易者通常将这些水平视为潜在的买入机会,押注于反弹。但对于大多数交易者来说,看到如此低的数字并不是一个好信号。我们正在接近但尚未达到通常发生抛售的危险区域。
挤压动量指标与疲弱的趋势读数形成了有趣的背离。比特币的读数表明波动性正在压缩——想象一下弹簧被缠得更紧。当与低 ADX 读数结合时,这通常预示着无论哪个方向的剧烈波动,配置表明如果 50 日 EMA 作为阻力位巩固,可能会出现较长的看跌修正,而不是向上爆发。
所有这些都意味着,如果你目前押注于“比特币资金转向山寨币”(如 Solana)的理论,当前的数据似乎支持这一观点。
关键水平:
立即支撑:110,000 美元(心理水平和近期低点)
强支撑:105,000 美元(主要技术汇聚点)
立即阻力:115,000-116,000 美元(50 日 EMA 区域)
强阻力:120,000 美元(历史高点之前的更强阻力)
作者表达的观点和意见仅供信息参考,并不构成财务、投资或其他建议。
免责声明:本文章仅代表作者个人观点,不代表本平台的立场和观点。本文章仅供信息分享,不构成对任何人的任何投资建议。用户与作者之间的任何争议,与本平台无关。如网页中刊载的文章或图片涉及侵权,请提供相关的权利证明和身份证明发送邮件到support@aicoin.com,本平台相关工作人员将会进行核查。


