原文作者: @BlazingKevin_ ,the Researcher at Movemaker
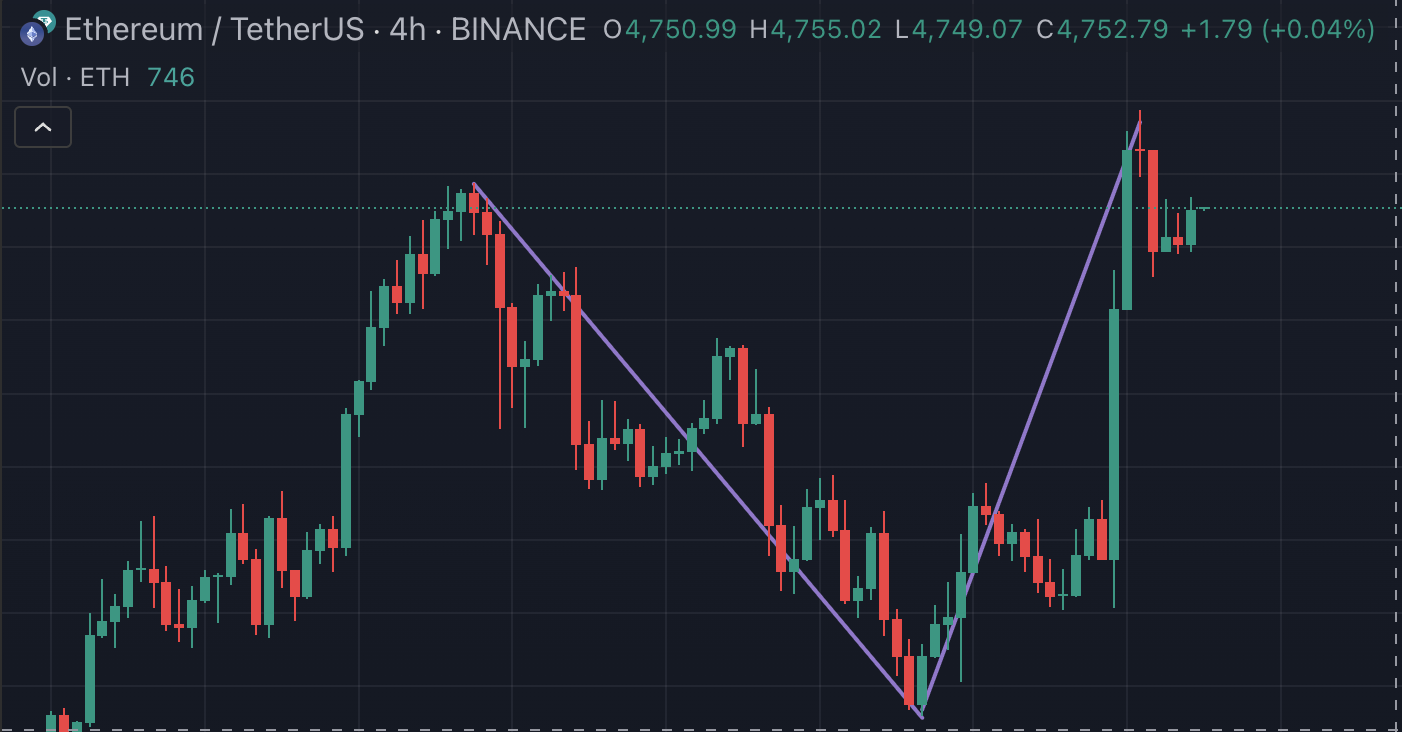
随着以太坊突破 4868,正式实现历史新高.回顾过去两周的行情走势: 以太坊经历了 4788-4060-4887 的过山车, 15%的跌幅与 20%的涨幅在 10 天内完成. 而推动本轮以太坊行情的机构们,即以太坊微策略们的股价也在经历过山车行情.
如果你的投资组合中包含以太坊及其杠杆的机构股票, 并预见以太坊会在历史新高处进行宽幅震荡时, 如何利用衍生工具来抵御账户回撤风险的重要性在不断提升. 即使你是“买入并持有”的长期持有者, 可能也不想在以太坊上再经历一次比特币去年的超长下行震荡.
期权作为一种非线性的金融衍生工具, 为管理这种价格风险提供了有效的解决方案 。通过购买看跌期权 , 你可以为其持有的 ETH 或相关币股资产设置一个价格下限, 从而在市场大幅下跌时保护其投资组合的价值 。更进一步, 通过构建更复杂的期权组合, 你甚至可以在市场盘整或小幅波动中获利。
看好飞轮进一步扩大该如何做多 mNAV?
以太坊的 DAT 旁氏飞轮还在持续
DAT(Digital Asset Treasury)策略让 Michael Saylor 的公司市值突破了千亿美元,同期涨幅甚至超越了英伟达。透过发行公司证券(如股票或债券)向公开市场募资,再将资金用于大规模增持加密资产,旨在创造一个“募资 -\u0026gt; 买币 -\u0026gt; 币价与股价齐升 -\u0026gt; 再次募资”的正向循环。
以 Sharplink Gaming (SBET) 和 BitMine (BMNR) 为代表的公司,正试图复制并升级这一模型,而以太坊的独特性质,或许能让这个飞轮转得更快、更稳。
DAT 模式的本质,是一场关于资产长期增长率与融资成本的套利博弈。其成功的前提是,底层资产(如 ETH)的长期复合年增长率(CAGR)必须显著高于公司的资本成本。然而,以太坊财库的特殊之处在于,它并非简单复制比特币的剧本,而是巧妙地利用了以太坊生态独有的三大特性,为这个飞轮模型注入了前所未有的驱动力:
1. 波动性成为融资的“催化剂”
在传统观念中,高波动性通常意味着高风险。但在 DAT 模型的融资工具——特别是可转换债券(CB)的发行中,以太坊远高于比特币的历史与引申波动率,反而成了一种独特优势。这种高波动性对以交易波动率为生的对冲基金(如进行 Gamma 交易的基金)构成了巨大吸引力。结果是,ETH 财库公司能以更优厚的条件(更高的估值)发行可转债,降低融资成本。波动性在此不再是纯粹的风险,而被转化为吸引特定机构投资者的“诱饵”,从而为飞轮的启动提供了更便宜、更充裕的燃料。
2. 原生收益提供了内生的“稳定器”
比特币财库(如 MSTR)支付债券利息或优先股股息,本质上依赖于在市场上增发股票来换取现金,这一行为高度依赖市场的流动性和股价的稳定。而以太坊的 PoS 机制赋予了 ETH 内生的生产力——即通过质押、再质押等方式可以产生稳定且可观的原生收益。这意味着 ETH 财库公司可以利用这部分收益来覆盖其融资工具的利息成本,从而极大地降低了对市场的依赖。
3. mNAV 溢价构成了飞轮的“加速器”
市值与净资产价值之比(mNAV)是衡量财库公司估值的关键指标,反映了市场对其未来增值能力的预期。由于 ETH 的原生收益机制能在不依赖额外融资的情况下,持续增加公司每股对应的 ETH 数量,市场自然愿意给予 ETH 财库公司更高的 mNAV 溢价。mNAV 越高,飞轮的增值和加速效应就越强。
忽视单股币的价格涨跌时正确做多 mNAV 的姿势
如果你当前的策略是看好 mNAV, 并且认为以太坊可能有回调的风险, 那么忽视单股币的价格涨跌的期权策略是最合适. 以 BMNR 为例, 此时你可能会想, 做多 10000 份 BMNR 加上做空 10000 份 ETHA 就可以简单实现. 但实际上, 这是错误的对冲策略.
在仅做多 mNAV 时,我们需要考虑 BMNR、SBET、ETHA 等的每股内在价值.即每一股背后实际代表了多少单位的 ETH。 这可以看作是该工具以 ETH 计价的“净资产值”.
计算方法: 每股 ETH 含量 = 总 ETH 持有量 / 总发行股数
对于 ETHA 来说,它的计算过程如下:首先,ETHA 某一日的指示性篮子以太坊数量的计算方法是:将次日的预估净资产价值(NAV)乘以每个篮子中的份额数量(40,000),再除以当日的 CF 基准指数.
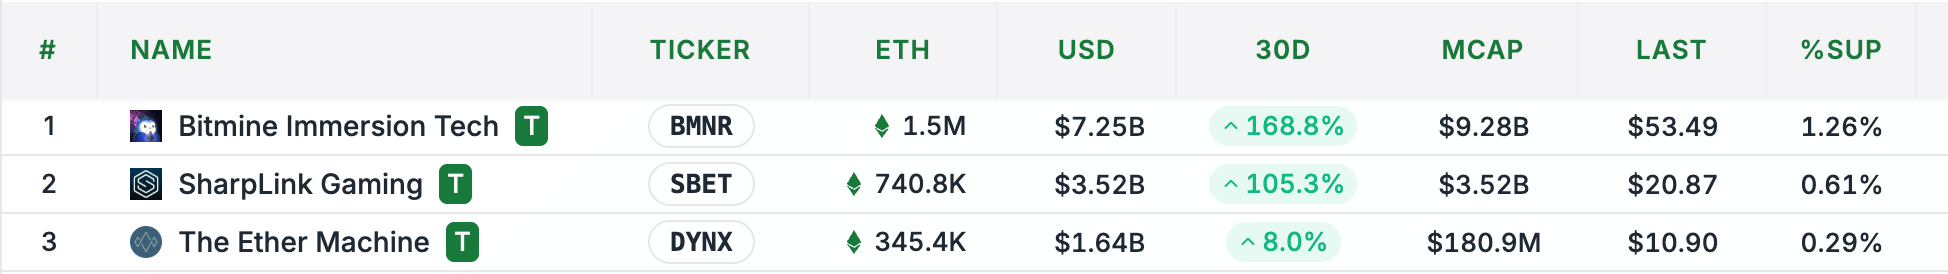
根据 https://www.ishares.com/us/products/337614/ishares-ethereum-trust-etf 的数据,40000 股对应的以太坊数量是 302.56 个.
302.57/40000=0.00756 ETH
即 1 ETHA = 0.00756 ETH
对于 BMNR 来说,它的计算过程如下:
流通股数: 173,496,950 股
持有 ETH 数量:1,570,000
即 1 BMNR = 0.00904 ETH
在确定了两种资产的“ETH 含量”后,下一步就是计算对冲比率:
BMNR:ETHA =0.00904:0.00756 = 6:5
根据收盘价: 1 ETH = 4840
1 BMNR 的内含价值为: 0.00904*4840 = 43.75
BMNR 的收盘价是 53.49
BMNR 的 mNAV = 53.49/43.75 = 1.22
按照相同的算法,计算 SBET 的 mNAV:流通股数: 168,866,724 股 740,800 ETH 得到: 1 SBET = 0.00438 ETH
根据收盘价: 1 ETH = 4840
1 SBET 的内含价值为: 0.00438*4840 = 21.19
SBET 的收盘价是 20.87
SBET 的 mNAV = 21.19/20.87 = 1.015
SBET 与 ETHA 的对冲比例为: SBET:ETHA =0.00438:0.00756 = 11:19
SBET 的 mNAV 小于 BMNR 的, 当以太坊来到历史新高附近时, 有不小的可能性面临回调或者进入宽幅震荡, 按照本节标题的操作思路. 我们依然看好 mNAV 的飞轮继续正向运行即 SBET 或者 BMNR 不会在到期日前跌破内在价值, 但是又不想承担以太坊剧烈回调导致的净值缩水. 那么应该预计当 ETH 的跌幅大于 SBET 或者 BMNR. 在 SBET 和 BMNR 之间选择 mNAV 较小的一方去做多,风险最小.
以 250905 为例:
我们应该操作配比相同的 SBET 卖出 PUT 和 ETHA 的买入 PUT: SBET 卖出 20.5 PUT*19 得到的权利金是 2,888 美元
按照 SBET 内含价值计算跌幅为: 3.2%
ETHA 经历同样跌幅的价格为: 35.39
最接近的行权价是 36, 因此 ETHA 买入 35 PUT*11 支付权利金 1,507 美元
权利金收益为: 1381 美元
如果 mNAV 上涨或不变,那么获得权利金收益. 但是 SBET 的跌幅一旦超过以太坊, 即 mNAV 下降那么则会出现亏损. 按照 SBET 当前的溢价水平来说, 这种情况意味着溢价进入水下,DAT 的飞轮可能被按下暂停键.
因此, 此策略的配置思路应该是:看好本轮以太坊的行情并未结束, 即 mNAV 应该稳中上涨, 但是认为以太坊短期内存在回调.因此以做多 mNAV 为目的, 忽略单股单币的价格变化. 当然, 这个策略也有缺点, 即 ETH 暴跌,市场可能预期“增发飞轮失效”,SBET 的股价往往会比 ETH 跌得更狠。在这种极端情况下,Put 卖方敞口会吃大亏,而 ETHA Put 对冲不够。又或者如果市场情绪转负(预期增发失败、ETH 回调周期长),溢价可能进入水下并持续下降。
当币股增发, 导致溢价下降时, 应该怎样做空 mNAV?
对于 SBET 和 BMNR 这类业务模式核心为持有并增持 ETH 的公司, 其股价表现不仅取决于 ETH 的价格, 还受到公司自身资本运作的深刻影响, 其中最核心的就是通过增发新股来融资购买更多 ETH 的循环模式。在 ETH 价格持续上涨的牛市中, 这种模式看似能够创造价值, 但其背后隐藏着对现有股东权益的持续稀释。这种稀释效应是数学上的必然, 最终将破坏其“永恒增长”的逻辑。
股权稀释的核心机制
要真正理解股权稀释的运行逻辑,可以从一个量化推演的框架出发。其基本出发点在于,增发意味着同一家公司对应的资产要被更多股份分摊,除非市场在理想化的情况下毫无反应(即愿意接受额外的供给而维持估值不变),否则老股东的相对权益必然会被削弱,新资金进入的本质就是价值在股东之间的重新分配。
初始设定:
- 公司持仓:假设公司资产为价值 2 亿美元的 AI 初创公司股权组合,无任何债务,因此净资产(NAV)即为 2 亿美元。
- 市值:市场给予其 2.5 亿美元的估值,这体现了 25%的溢价。这部分溢价可能源于市场对 AI 赛道的狂热追捧或对该公司投资眼光的极高预期。
- 股本规模:设定为 Q 股。
- 每股净资产(NAV):200/Q 美元。
- 每股价格:250/Q 美元。
市场愿意用 1.25 美元去购买公司持有的每 1 美元资产,这个 25%的溢价就是后续增发循环可以启动的“燃料”。
第一次增发:
- 融资规模:公司决定透过发行新股募集 1 亿美元,并将资金全部用于投资新的 AI 项目。为维持市价稳定,增发必须以现行股价 250/Q 美元进行。
- 新增股数(M): M=1 亿美元÷(250/Q)=0.4 Q 股。
- 新股本总量: Qnew=Q+M=Q+0.4 Q=1.4 Q 股。
- 新资产总额: Anew=2 亿美元+1 亿美元=3 亿美元。
- 新每股净资产: NAVnew=3 亿美元÷(1.4 Q)≈$214.29/Q 美元。 与原先的 200/Q 相比,每股内在价值确实提升了。
- 新市值(假设股价维持): 市值 new=(250/Q)×1.4 Q=3.5 亿美元。
- 新的溢价: 溢价 new=(3.5 亿÷3 亿)−1≈16.67%。
从账面看,每股净资产增加,股价保持不变,公司市值也显著放大。但其实质是,原有的 25%溢价被稀释到了 16.67%。
价值转移如何发生:
新融入的 1 亿美元资产,现在由所有股东(新、老)共同拥有。老股东的持股比例从 100%下降到了 Q/1.4 Q≈71.43%。
他们在 3 亿美元的新资产总额中拥有的权益约为 3 亿×71.43%≈2.14 亿美元。虽然这比他们最初拥有的 2 亿美元资产多了 1400 万美元,但他们失去的是对原有高溢价的部分索取权。新股东用 1 亿美元,不仅买到了 1 亿美元的资产,还“免费”享受了公司整体的部分市场溢价,相当于以折扣价入场。
若循环继续:
假设公司持续采用此策略,每次都募集相当于当时市值 40%的资金:
- 第 1 轮后:资产 3 亿,市值 3.5 亿,溢价 16.67%。
- 第 2 轮:再融资 1.4 亿(3.5 亿的 40%),总资产将变为 4.4 亿,而新市值(若股价不变)将达到 4.9 亿,溢价被进一步稀释至约 11.36%。
- 第 3 轮后:资产规模继续扩大,但溢价将会继续下滑。
随着轮次增加,溢价将无限逼近于 0。最终,当增发价只能等于每股净资产时:
- 每股净资产不再增加。例如,资产为 K,股本为 P。此时增发只能以 K/P 的价格进行。若增发 0.3 K 的资金,则新增股数为 0.3 P。新资产为 1.3 K,新股本为 1.3 P,每股净资产为 (1.3 K)/(1.3 P)=K/P,与增发前完全一样。
- 增发的“魔力”失效。没有了溢价空间,增发不再具有提升每股净资产的表面效果,新老股东之间变成了纯粹的零和博弈。
为什么这种效果不可避免:
- 市场不会永远配合:投资者会进行估值分析,一旦他们意识到公司的增长仅仅依赖于外部输血而非内生性盈利,市场给予的溢价就会迅速收缩,导致股价下跌,从而破坏“按市价增发”的前提。
- 稀释是算术必然:除非公司能用新资金创造出远超市场平均水平的回报率(g),且该回报率能持续跑赢股本的稀释率,否则从长期股东价值的角度看,稀释就是一个必然发生的数学结果。
最终可以看到,增发过程虽然在短期内可能被“资产规模放大”和“标的资产上涨”等光环所掩盖,但其核心是老股东的权益被逐渐让渡给新股东,后者以更低的成本分享了公司过往积累的价值和溢价。融资规模相对于市值的比例越大,这种稀释效应就越快。
看空 mNAV 的策略:预计 BMNR 因增发稀释而涨幅不及 ETHA 时
基于此你应该制定怎样的策略呢? 首先, 我们看好牛市继续,因此这是对于 BMNR 即将增发行为做一个进攻型保护策略.
我们认为其股价表现弱于以太坊本身时,并且需要一个能够对冲掉以太坊价格波动,纯粹做空其 mNAV 的策略。
简单地做空 BMNR 并做多 ETHA 是一种方向性的赌注,但不够精确。为了精准地做空 mNAV,我们需要利用期权,并严格遵循其每股内在价值(以 ETH 计价)进行对冲。
第一步:计算每股内在价值
我们需要复用之前的计算,确定两种资产以 ETH 计价的“净资产值”(NAV)。
- ETHA 的 ETH 含量:根据 iShares 官网数据,1 ETHA ≈0.00756 ETH
- BMNR 的 ETH 含量:根据其持有的 ETH 数量(1,570,000)和流通股数(173,496,950),1 BMNR ≈0.00904 ETH
第二步:确定对冲比率
为了在交易中剥离 ETH 本身价格变动的影响,我们必须根据它们的“ETH 含量”来计算对冲比率。
对冲比率:
BMNR:ETHA=0.00904:0.00756≈1.2:1≈6 : 5
这意味着,从内在价值来看,6 股 BMNR约等于5 股 ETHA所代表的以太坊价值。
第三步:构建做空 mNAV 的期权策略
我们的目标是:
- 押注 BMNR 的价格表现弱于其内在价值。
- 对冲掉 ETHA 的价格波动。
因此,正确的操作应该是买入 BMNR 的看跌期权并卖出 ETHA 的看跌期权。
- 买入 BMNR PUT: 这是我们策略的核心。如果 BMNR 股价下跌,或者涨幅不及预期,这个头寸会获利。
- 卖出 ETHA PUT: 这是对冲和资金成本的来源。我们卖出 ETHA 的 PUT,收取权利金,表达了我们“不认为 ETHA 会比 BMNR 表现更差”的观点。这个操作对冲了 ETH 市场的整体下跌风险。如果 ETH 不大跌,这个头寸将通过收取权利金而获利。
以 250905(2025 年 9 月 5 日到期)的期权为例:
假设当前价格:BMNR = $53.49, ETHA = $36.5 (基于 $4840/ETH * 0.00756)
我们应该按照6:5的比例操作:
- 买入 BMNR PUT: 选择一个接近平值的行权价,例如买入 6 手 BMNR $53 PUT。支付的权利金为每手 $5.00,总支出为 $5.00 * 100 * 6 =$3,000 美元。
- 卖出 ETHA PUT: 同样选择接近平值的行权价,例如卖出 5 手 ETHA $36 PUT。收到的权利金为每手 $4.20,总收入为 $4.20 * 100 * 5 =$2,100 美元。
净成本: 策略总成本 = 支付的权利金 - 收到的权利金 = $3,000 - $2,100 = $900 美元
这是一个净支出的策略,因此最大亏损就是支付的 900 美元。
策略的损益分析
- 盈利情景(mNAV 下降):
- BMNR 涨幅不及 ETHA: ETH 上涨 10%,ETHA 价格从 36.5 涨到 40.15。理论上 BMNR 应从 53.49 涨到 58.8。但由于增发稀释预期,BMNR 只涨到$55。此时,虽然您的 BMNR PUT 是亏损的,但其亏损幅度小于 ETHA PUT(已变为价外废纸)带来的收益,相对价值的变动使整个策略组合获利。
- BMNR 跌幅大于 ETHA: ETH 回调 5%,ETHA 价格跌至 34.6。理论上 BMNR 应跌至 50.8。但市场恐慌情绪导致 mNAV 收缩,BMNR 跌至$48。此时,您买入的 BMNR PUT 价值大增,其增值超过了卖出的 ETHA PUT 所带来的亏损,策略整体盈利。
- 亏损情景(mNAV 上升或不变):
- BMNR 涨幅超过 ETHA(mNAV 扩张): 市场情绪狂热,ETH 上涨 10%,但 BMNR 作为高 beta 资产上涨了 20%。此时 BMNR PUT 将变为深度价外,价值归零,而卖出的 ETHA PUT 也价值归零将损失全部的净成本(900 美元)。
- ETH 暴跌: 如果 ETHA 价格暴跌(例如跌破$30),卖出的 ETHA $36 PUT 会带来巨大亏损,这个亏损可能超从 BMNR PUT 中获得的收益,导致整体策略亏损。
每个策略都有对应思路, 并不存在完美的解法. 但是当你对当前市场环境有了判断之后, 对应的期权组合会在你正确判断时抵御风险或者给予额外的奖励.
关于 Movemaker
Movemaker 是由 Aptos 基金会授权,经 Ankaa 和 BlockBooster 联合发起的首个官方社区组织,专注于推动 Aptos 华语区生态的建设与发展。作为 Aptos 在华语区的官方代表,Movemaker 致力于通过连接开发者、用户、资本及众多生态合作伙伴,打造一个多元、开放、繁荣的 Aptos 生态系统。
免责声明:
本文/博客仅供参考,代表作者的个人观点,并不代表 Movemaker 的立场。本文无意提供:(i) 投资建议或投资推荐;(ii) 购买、出售或持有数字资产的要约或招揽;或 (iii) 财务、会计、法律或税务建议。持有数字资产,包括稳定币和 NFT,风险极高,价格波动较大,甚至可能变得一文不值。您应根据自身的财务状况,仔细考虑交易或持有数字资产是否适合您。如有具体情况方面的问题,请咨询您的法律、税务或投资顾问。本文中提供的信息(包括市场数据和统计信息,若有)仅供一般参考。在编写这些数据和图表时已尽合理注意,但对其中所表达的任何事实性错误或遗漏概不负责。
免责声明:本文章仅代表作者个人观点,不代表本平台的立场和观点。本文章仅供信息分享,不构成对任何人的任何投资建议。用户与作者之间的任何争议,与本平台无关。如网页中刊载的文章或图片涉及侵权,请提供相关的权利证明和身份证明发送邮件到support@aicoin.com,本平台相关工作人员将会进行核查。


