Master Discusses Hot Topics:
Tonight's CPI, I'll be straightforward. The US stock market and Bitcoin have been fluctuating slightly these past few days, just waiting for this data to drop. Some say it's a risk-averse sentiment, but I think the market knows the expectations aren't great, and if it were to crash, it wouldn't be too exaggerated.
As for the tariffs, I've analyzed this before and mentioned that the market has long been desensitized. The core issue now isn't whether the Federal Reserve will make a decision, but rather the conflict between the radical faction and the conservative faction within the Fed. As long as the data isn't outrageous, the radicals will definitely push for interest rate cuts.
The conservatives won't let go of interest rates until they see inflation truly decline, resulting in a situation where if the data is good, everyone is happy. If the data is bad, it won't lead to tears because a rate cut in September is almost a certainty. I've said before that since the rate hikes in 2022, the market has never won against the Fed, but this time it's hard to say.
Last month, the core CPI in the US was only 2.9% year-on-year, which isn't scary at all. Now, people are betting not on whether a rate cut will come, but whether it will be 50 basis points or 25 basis points in September. If it's 50, it will directly lead to a massive surge, with Bitcoin starting at no less than 10,000 points.
Back to the market, Bitcoin's recent pullback has almost been digested. The drop just before the US stock market closed actually increased the spot premium. This indicates that the selling pressure in the spot market has been temporarily released, while new short positions have emerged to provide liquidity.
In the short term, I suggest not jumping to conclusions too early, as I still lean towards a bullish consolidation until the data is finalized. The liquidity in contracts also confirms this; the new short positions below 124.8K haven't increased enough to trigger a major liquidation.
However, as time drags on, it will eventually turn into a new liquidation zone. As long as the CPI doesn't present any particularly negative surprises, Bitcoin still has a chance to break new highs this week. After all, with such a rise, the liquidity structure still leans towards the bulls.
On the daily level, there isn't a top divergence; the price hasn't made a higher high. But the MACD death cross hasn't appeared either, so if you want to force a technical indicator, it doesn't count as a divergence yet.
I prefer to look at the weekly chart; if it doesn't continue to rise and starts a large range consolidation, then the weekly chart will truly face the danger of a second top divergence. Therefore, the bulls must seize the opportunity to create a trend; otherwise, dragging it out will be too beneficial for the bears.
As for Ethereum, it's even tougher now; it's just digesting the supply from the high points of 2021. The 4-hour structure hasn't deteriorated at all, with higher lows being gradually established. You may not be optimistic about Bitcoin, but being bearish on Ethereum is just asking for trouble.
In the ASR channel, Ethereum is oscillating upwards around the 4300 pressure zone, indicating that market demand is eating away at the selling pressure near the previous highs. The past two days have seen it rise to 4330-4370, drop to 4160, and then rebound, with each pullback around 170 points, which is indeed explosive.
The reason is simple: between 4330-4100, 4160 is a strong support. 4222 can only be considered weak support; if it breaks 4200, it's normal, as the main force can directly smash through. So before breaking 4400, the low long positions should focus on entering around 4160; if it truly breaks, wait for 4068.
There isn't much risk in the short term; below 4200, don't chase shorts in a foolish manner, as you'll be done for on any rebound. Ethereum has had two consecutive days of equidistant pullbacks, which isn't friendly for those eager to open new positions.
However, 4163 has held up each time, so as long as you don't chase shorts below 4300, you should be fine. The indicators above the daily level are still quite strong, and there isn't any adjustment risk appearing for now, so I continue to look for new highs!
Master Looks at Trends:
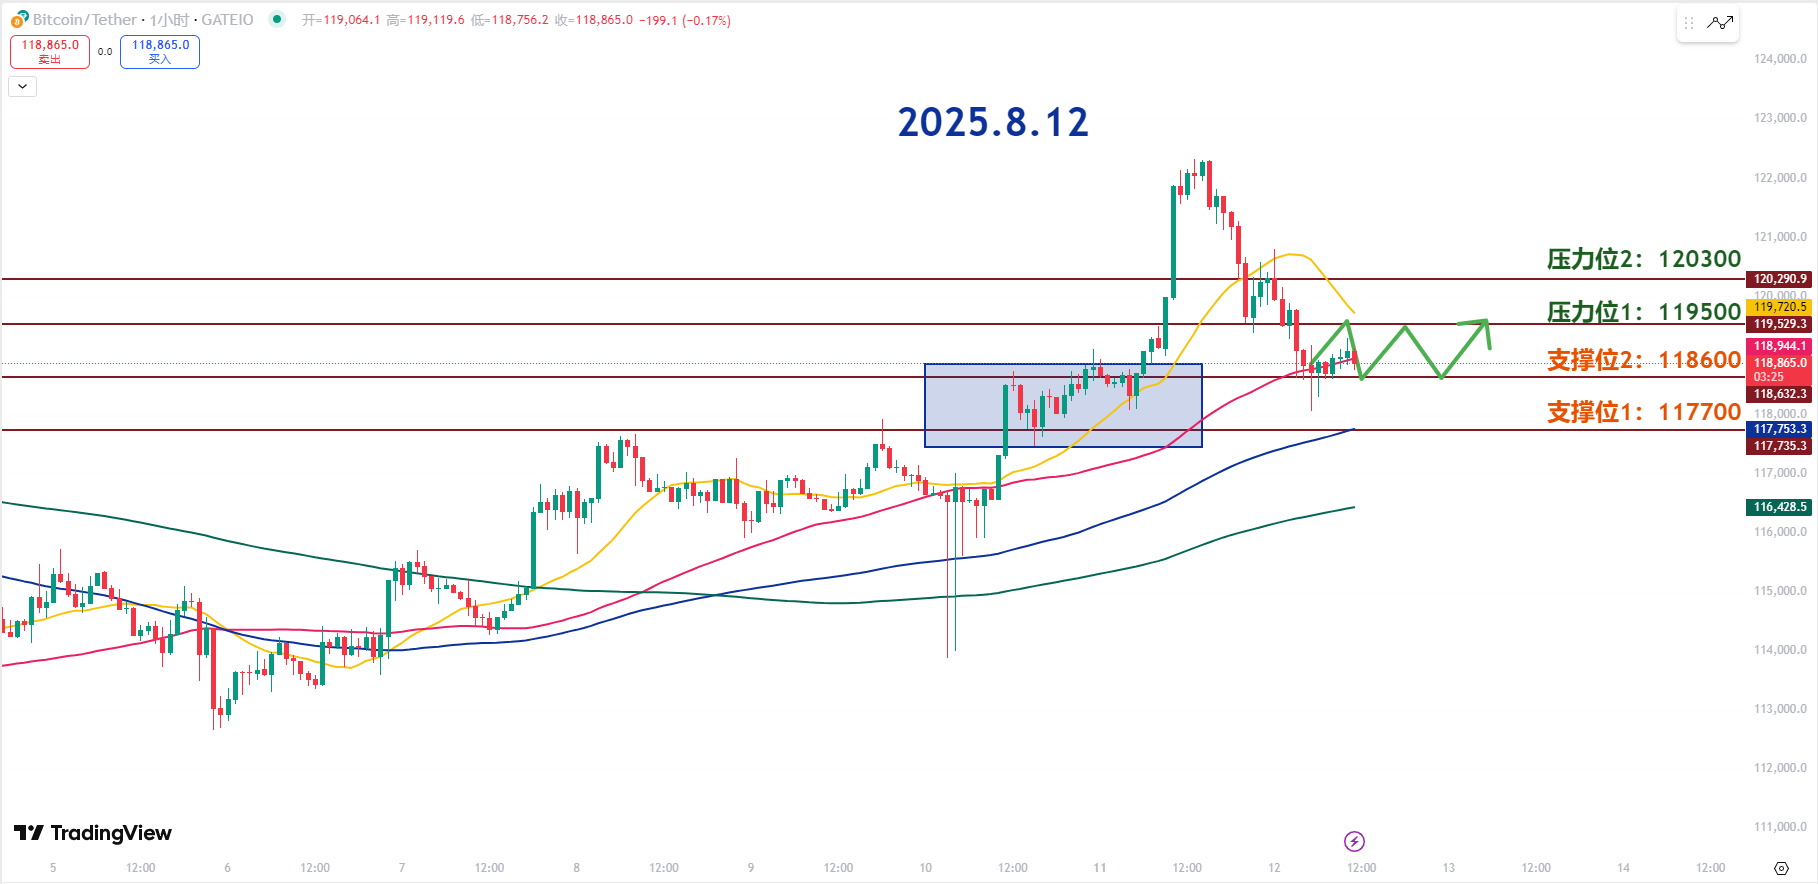
Resistance Level Reference:
Second Resistance Level: 120300
First Resistance Level: 119500
Support Level Reference:
Second Support Level: 118600
First Support Level: 117700
Since 118.6K is the breakout point of the previous consolidation range, it must hold here in the short term to increase the probability of further upward movement. Currently, the goal is to break back above 120K, but the trading volume is low, so the likelihood of sideways consolidation is high.
However, we cannot completely rule out the risk of a decline. Before the price re-establishes above 119.5K, it's advisable to switch between long and short flexibly. Aggressive short-term traders can consider entering around 118.6K, while conservative traders can look at the 117.7K to 118K range as an entry opportunity.
Additionally, attention should be paid to whether CoinEx can re-establish above 119K to challenge the first resistance at 119.5K. If it reaches 119.5K without a significant increase in trading volume, a pullback may occur.
The psychological barrier of 120K that was broken yesterday has been re-fallen, turning from support into resistance. Therefore, in the short term, I do not recommend making breakout trades directly near 120K, but rather wait for the price to re-establish above 120.2K to 120.3K and then wait for a pullback to confirm support before going long.
The first support at 118.6K is the upper edge of the range and also an important short-term support. As long as it doesn't break, the rebound expectation can be maintained. However, once it fails, further declines will occur.
The second support at 117.7K is a strong support at the lower edge of the range and also where the 120MA is located. Technical indicators are expected to show a rebound, and it can also be seen as a short-term low point.
After yesterday's pullback, the K-line left a long lower shadow. A supplementary rise has occurred, so 118.6K can be set as the boundary line for short-term long and short operations.
8.12 Master’s Wave Strategy:
Long Entry Reference: Accumulate in the 117700-118600 range, Target: 119500-120300
Short Entry Reference: Not currently applicable
If you truly want to learn something from a blogger, you need to keep following them, rather than making rash conclusions after just a few market observations. This market is filled with performers; today they screenshot long positions, tomorrow they summarize short positions, making it seem like they "catch every top and bottom," but in reality, it's all hindsight. A truly worthy blogger will have a trading logic that is consistent, coherent, and withstands scrutiny, rather than jumping in only when the market moves. Don't be blinded by flashy data and out-of-context screenshots; long-term observation and deep understanding are necessary to discern who is a thinker and who is a dreamer!
This article is exclusively planned and published by Master Chen (WeChat: Coin Master Chen). For more real-time investment strategies, solutions, spot trading, short, medium, and long-term contract trading techniques, operational skills, and knowledge about K-lines, you can join Master Chen for learning and communication. A free experience group for fans has been opened, along with community live broadcasts and other quality experience projects!

Warm reminder: This article is only written by Master Chen on the official account (as shown above), and any other advertisements at the end of the article and in the comments section are unrelated to the author!! Please be cautious in distinguishing between true and false, thank you for reading.
免责声明:本文章仅代表作者个人观点,不代表本平台的立场和观点。本文章仅供信息分享,不构成对任何人的任何投资建议。用户与作者之间的任何争议,与本平台无关。如网页中刊载的文章或图片涉及侵权,请提供相关的权利证明和身份证明发送邮件到support@aicoin.com,本平台相关工作人员将会进行核查。