The fluctuations in the cryptocurrency market are like the waves in a turbulent sea, making people feel anxious. However, its charm lies in the fact that it never looks at your past report card. Stop saying "I'll enter the market when it stabilizes"; opportunities in the crypto world never lie in "stability." The real dividends always belong to those who dare to position themselves amid uncertainty. Market volatility is not a risk; failing to understand the trend is the biggest risk.
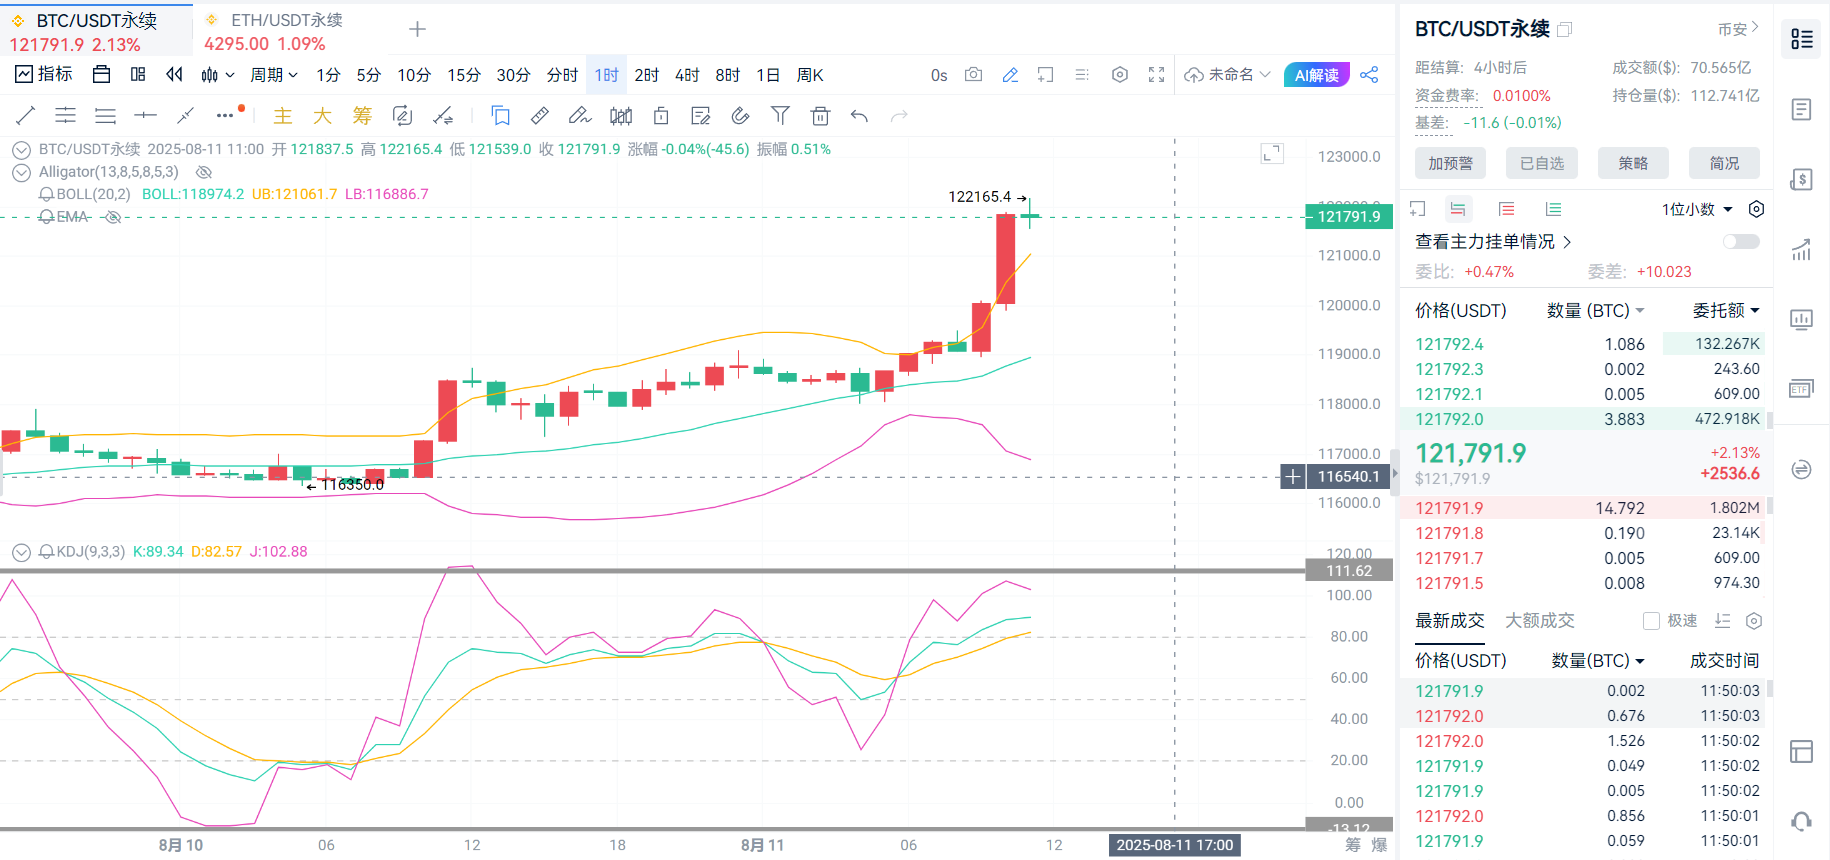
The current price of Bitcoin has surpassed the $122,000 mark, maintaining a fluctuating upward staircase structure on the daily chart. The middle band of the Bollinger Bands is providing effective support, and a MACD golden cross is beginning to appear, indicating enhanced bullish momentum.
From a technical perspective, the daily candlestick chart has reached the upper band of the Bollinger Bands, and the MACD golden cross is emerging, suggesting there is still room above. On the hourly chart, the candlestick has crossed above the upper band of the Bollinger Bands, but the KDJ is in an oversold state, showing a slight bearish downward trend, so caution is needed for potential pullback risks. Currently, the first resistance level above is at $122,500, the second resistance level is at $123,300 (historical high), the first support level below is at $119,000 (middle band of the hourly Bollinger Bands), and the second support level is at $117,300.
Long position operation range suggestion: If the price pulls back to the $118,500-$119,300 range, a light long position can be attempted, with an upper target of $123,000 and a stop loss at $118,000.
Short position operation range suggestion: If the price fails to form an effective breakthrough in the $122,000-$122,500 range, a light short position can be attempted, with a lower target of $119,000 and a stop loss at $123,000.
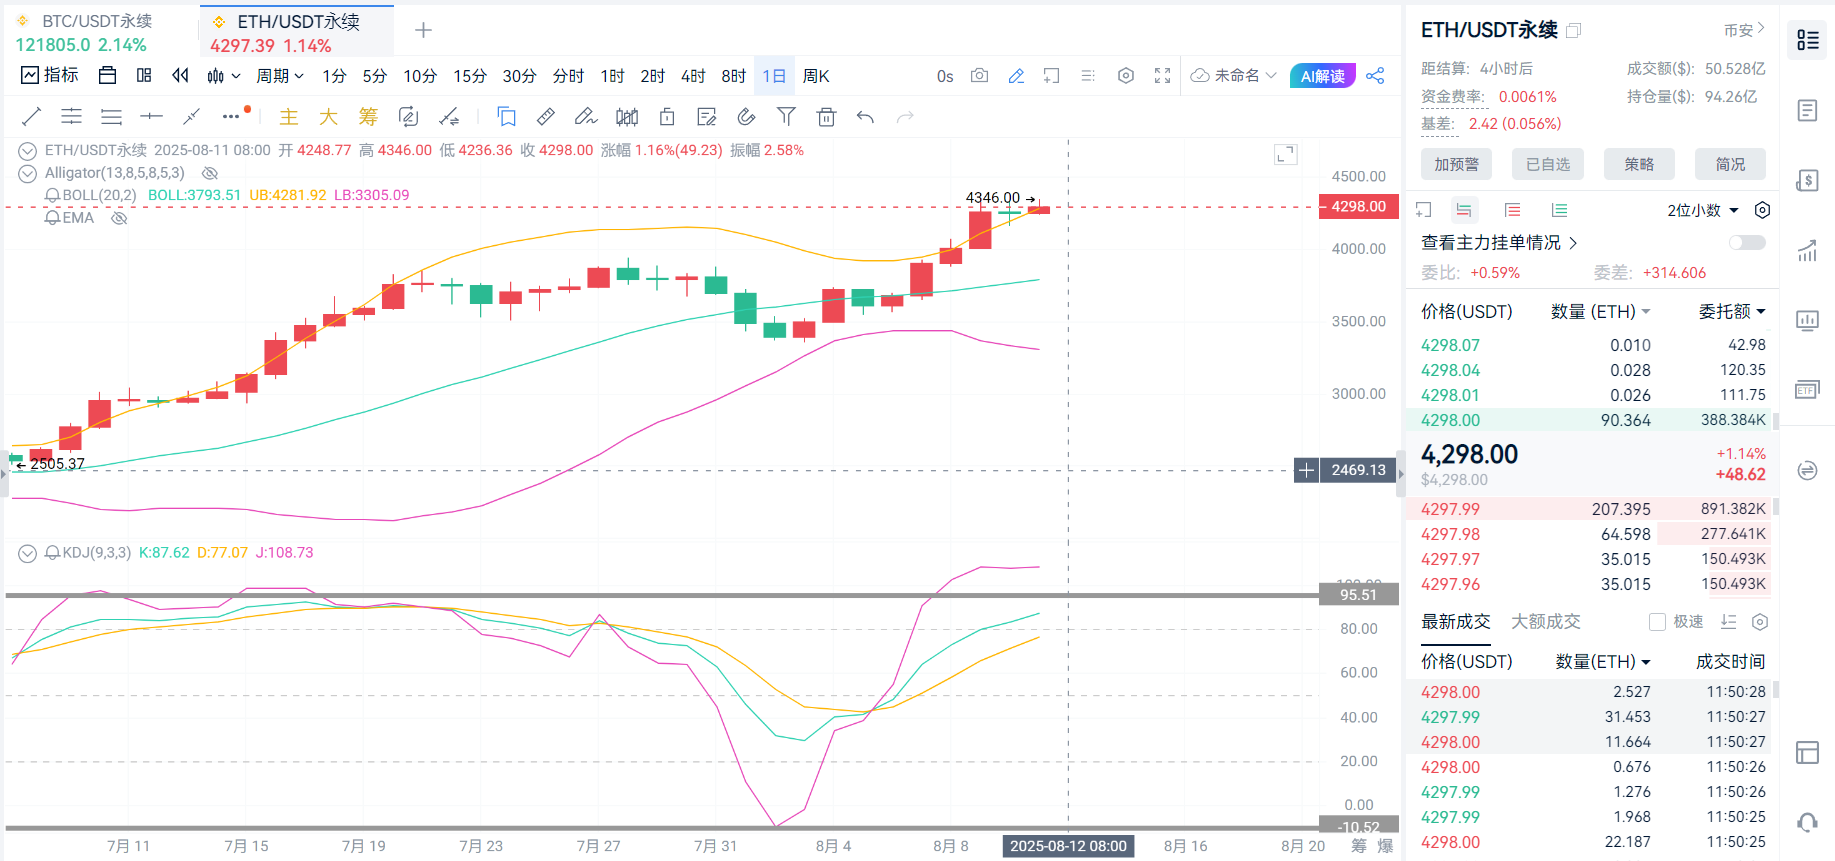
Ethereum is performing significantly stronger than Bitcoin, breaking through $4,300 during trading on August 11 to create a new high for the year, and then retreating to around $4,230 for consolidation. On the daily chart, aside from a small bearish candle yesterday, there have been consecutive large bullish candles, and the RSI indicator is continuously operating in the overbought range (above 75), indicating that bulls dominate the market. However, the divergence between price and volume (price reaching new highs while trading volume decreases) suggests increased short-term pullback pressure. The upper resistance levels to watch are $4,330-$4,350 and $4,400; breaking through these may open up upward space. The lower support levels are at $4,160 and $4,230.
Long position operation range suggestion: If the price pulls back to the $4,200-$4,250 range, a light long position can be attempted, with an upper target of $4,330-$4,350 and a stop loss at $4,180.
Short position operation range suggestion: If the price fails to form an effective breakthrough in the $4,330-$4,350 range, a light short position can be attempted, with a lower target of $4,280-$4,260 and a stop loss at $4,380.
The competition between long and short positions in Ethereum is intense, with $4,330 being a key watershed. Before breaking through, focus on high shorts, and consider buying near the support levels of $4,160-$4,230.
Due to the time-sensitive nature of price points, there may be delays in post reviews; specific operations should still be based on real-time market conditions. The above operational range analysis is for reference only. The cryptocurrency market is highly risky, so please manage your risk well and make cautious decisions when investing. If you are interested in specific indicator analysis or the impact of new market dynamics on prices, feel free to scan the QR code for the public account in the article below. You are welcome to visit.

Warm reminder: The content of the above article is original by the author. The advertisements at the end of the article and in the comments section are unrelated to the author, so please be cautious!
免责声明:本文章仅代表作者个人观点,不代表本平台的立场和观点。本文章仅供信息分享,不构成对任何人的任何投资建议。用户与作者之间的任何争议,与本平台无关。如网页中刊载的文章或图片涉及侵权,请提供相关的权利证明和身份证明发送邮件到support@aicoin.com,本平台相关工作人员将会进行核查。


