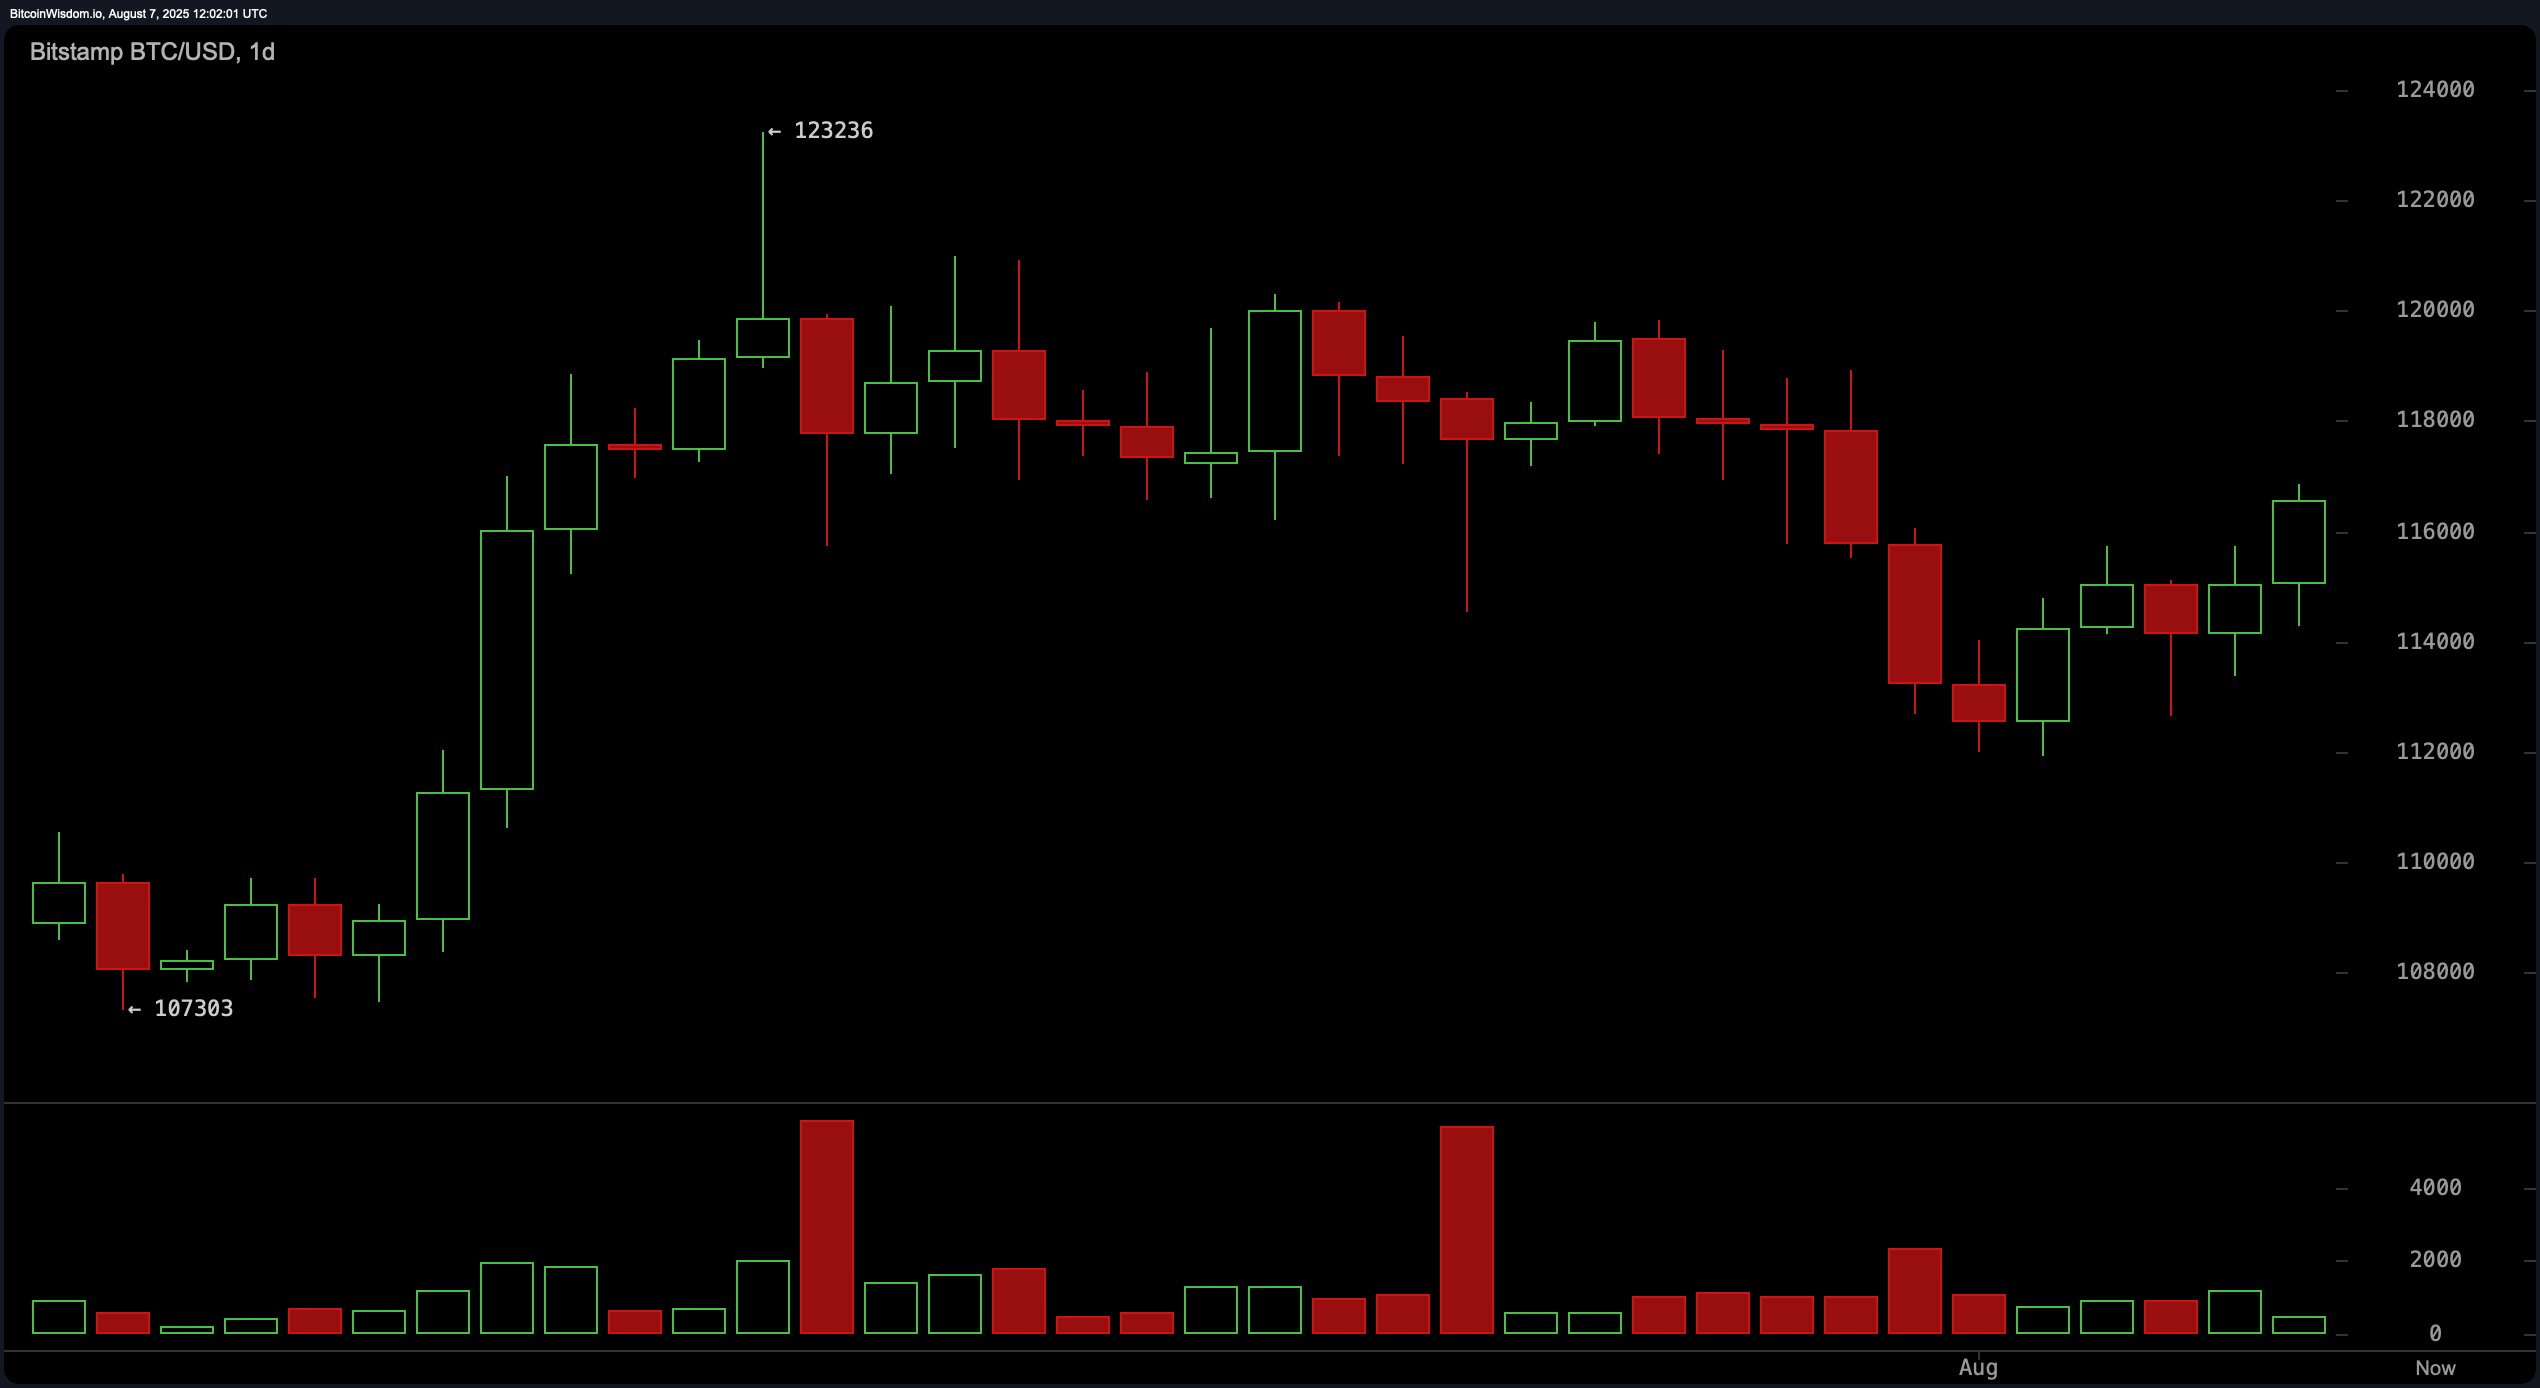
On the daily chart, bitcoin has begun to show signs of recovering from a previous downtrend, as higher lows establish a constructive technical base. Notably, increasing volume on green candlesticks suggests buyers are regaining control, particularly near the $112,000 support zone. A recent series of strong daily candles indicates that the trend may be shifting upward, supported by positive sentiment. However, until bitcoin closes above $117,000 with conviction, the trend remains cautiously optimistic.

BTC/USD 1-day chart via Bitstamp on Aug. 7, 2025.
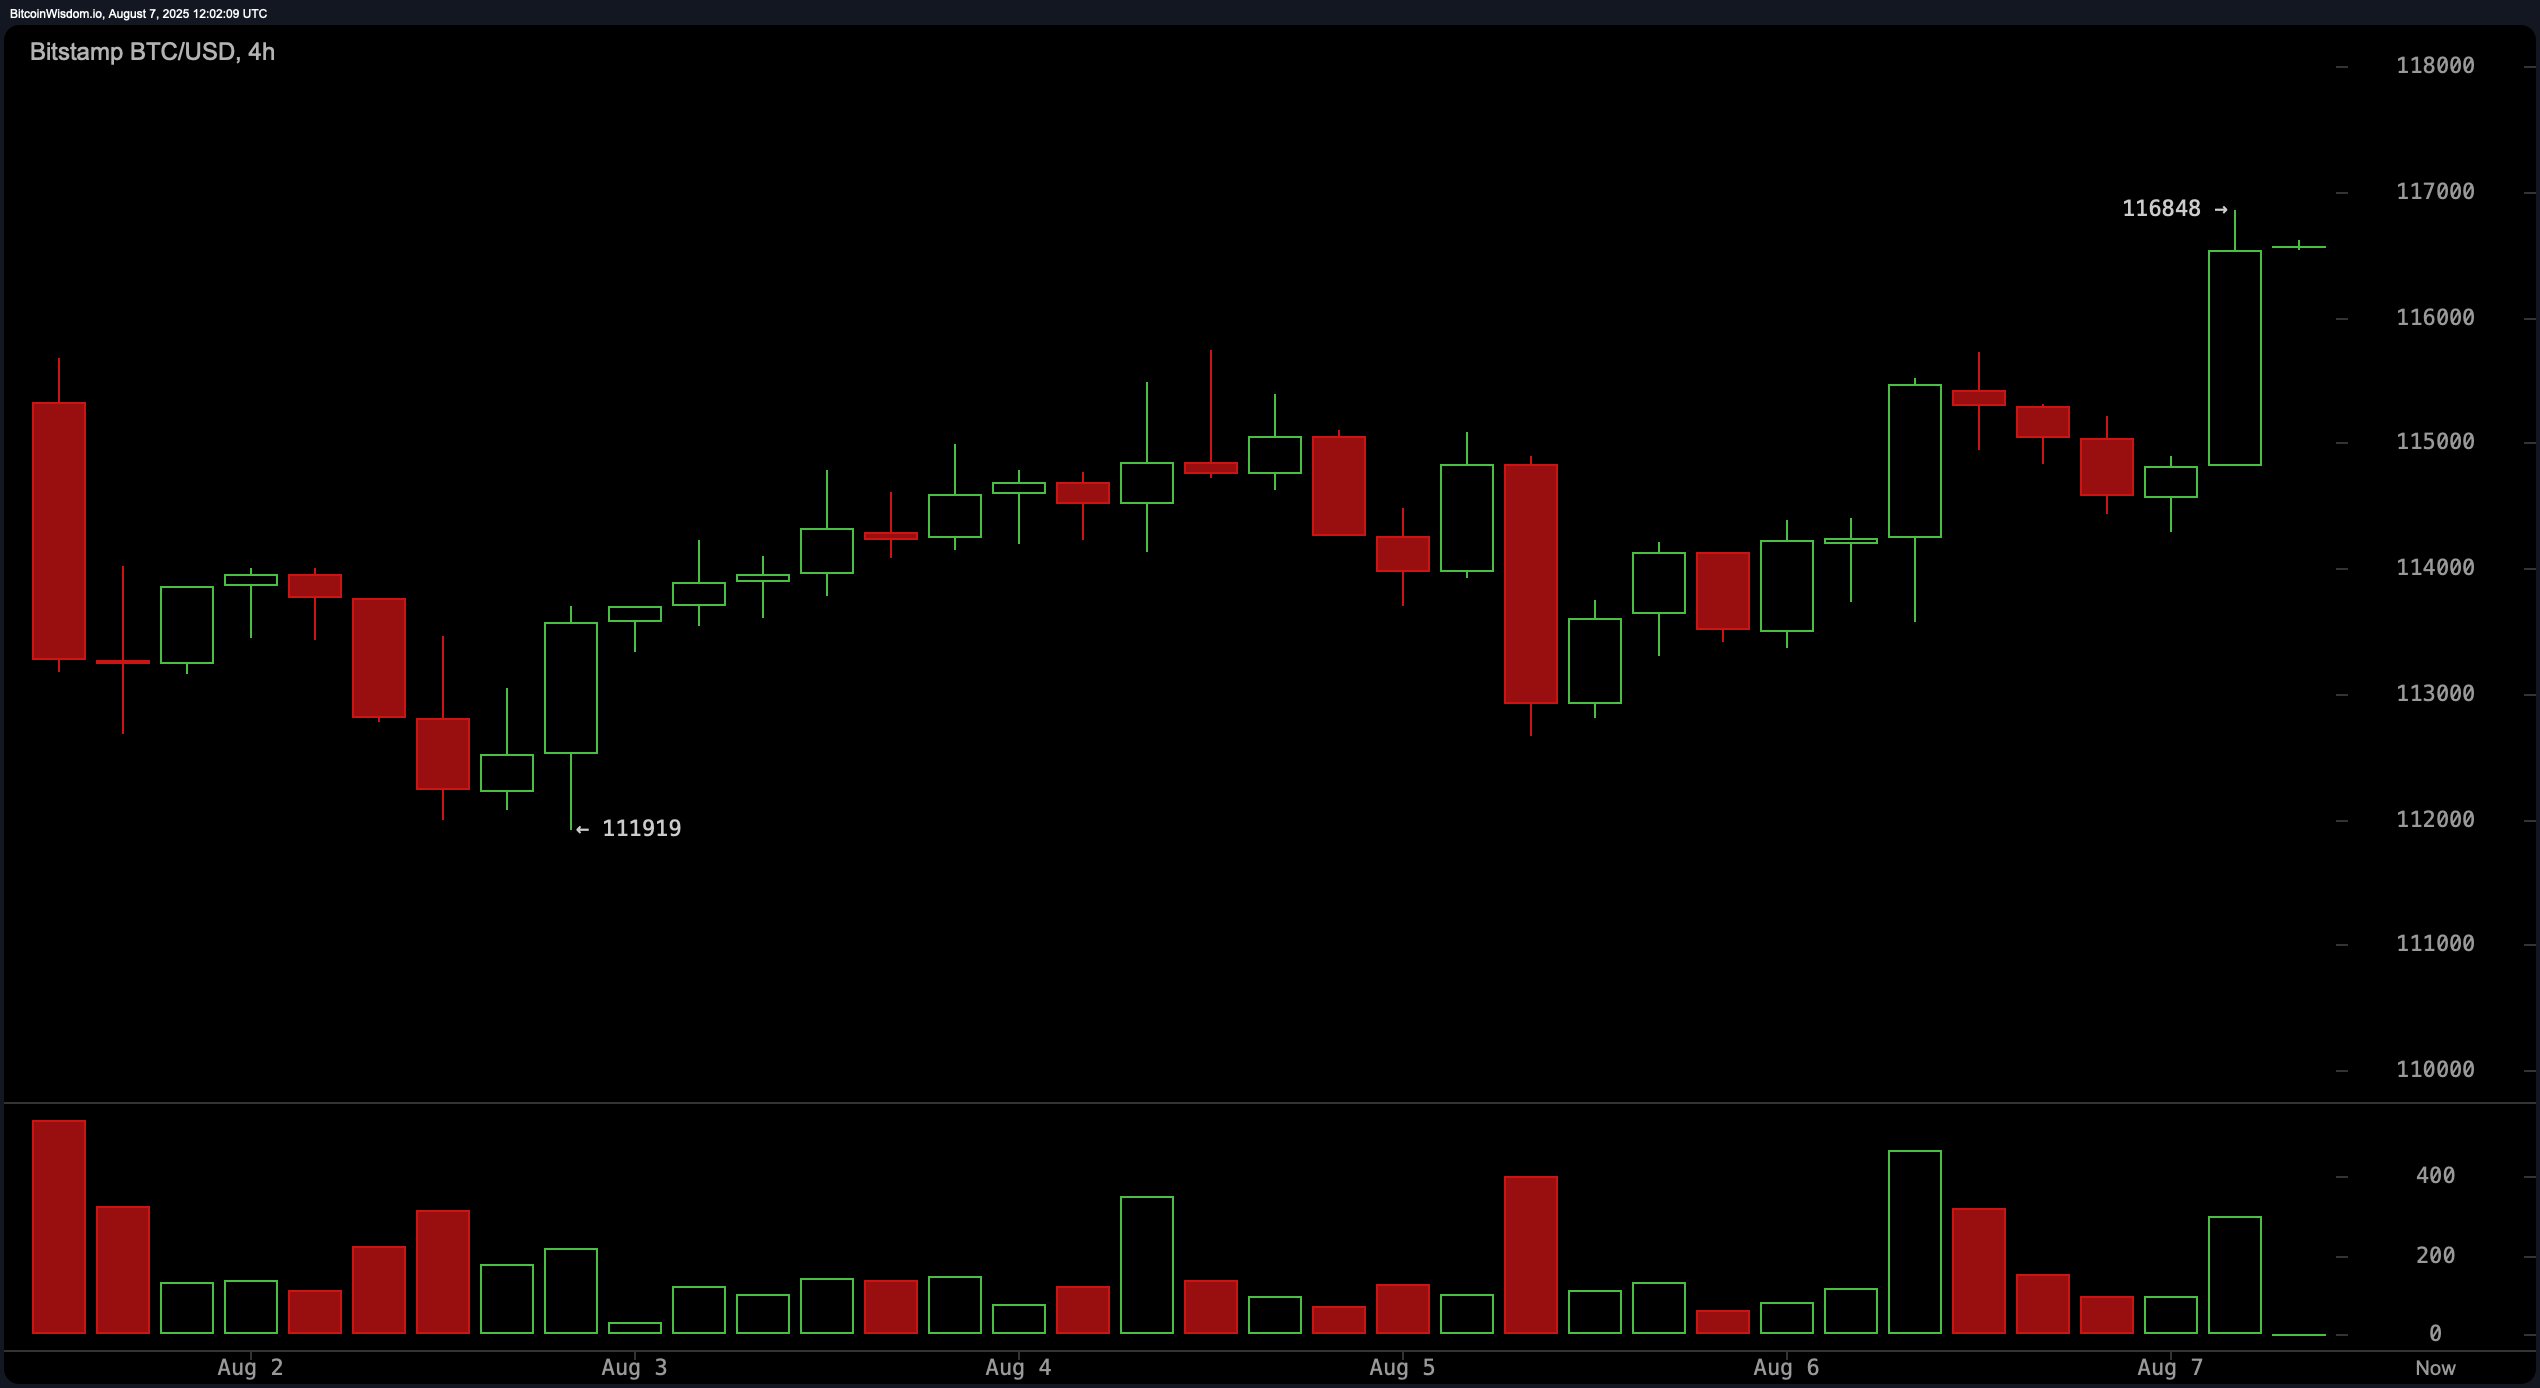
The 4-hour bitcoin chart reveals an established short-term uptrend, marked by a clear move from approximately $112,000 to the current trading range. Volume has surged on bullish moves, confirming the strength of the breakout. Resistance at $116,800 has been tested multiple times, and a sustained move above this level would likely target the $118,500 to $120,000 zone. A failure to breach that resistance could, however, invite short-term selling pressure, especially if volume declines.

BTC/USD 4-hour chart via Bitstamp on Aug. 7, 2025.
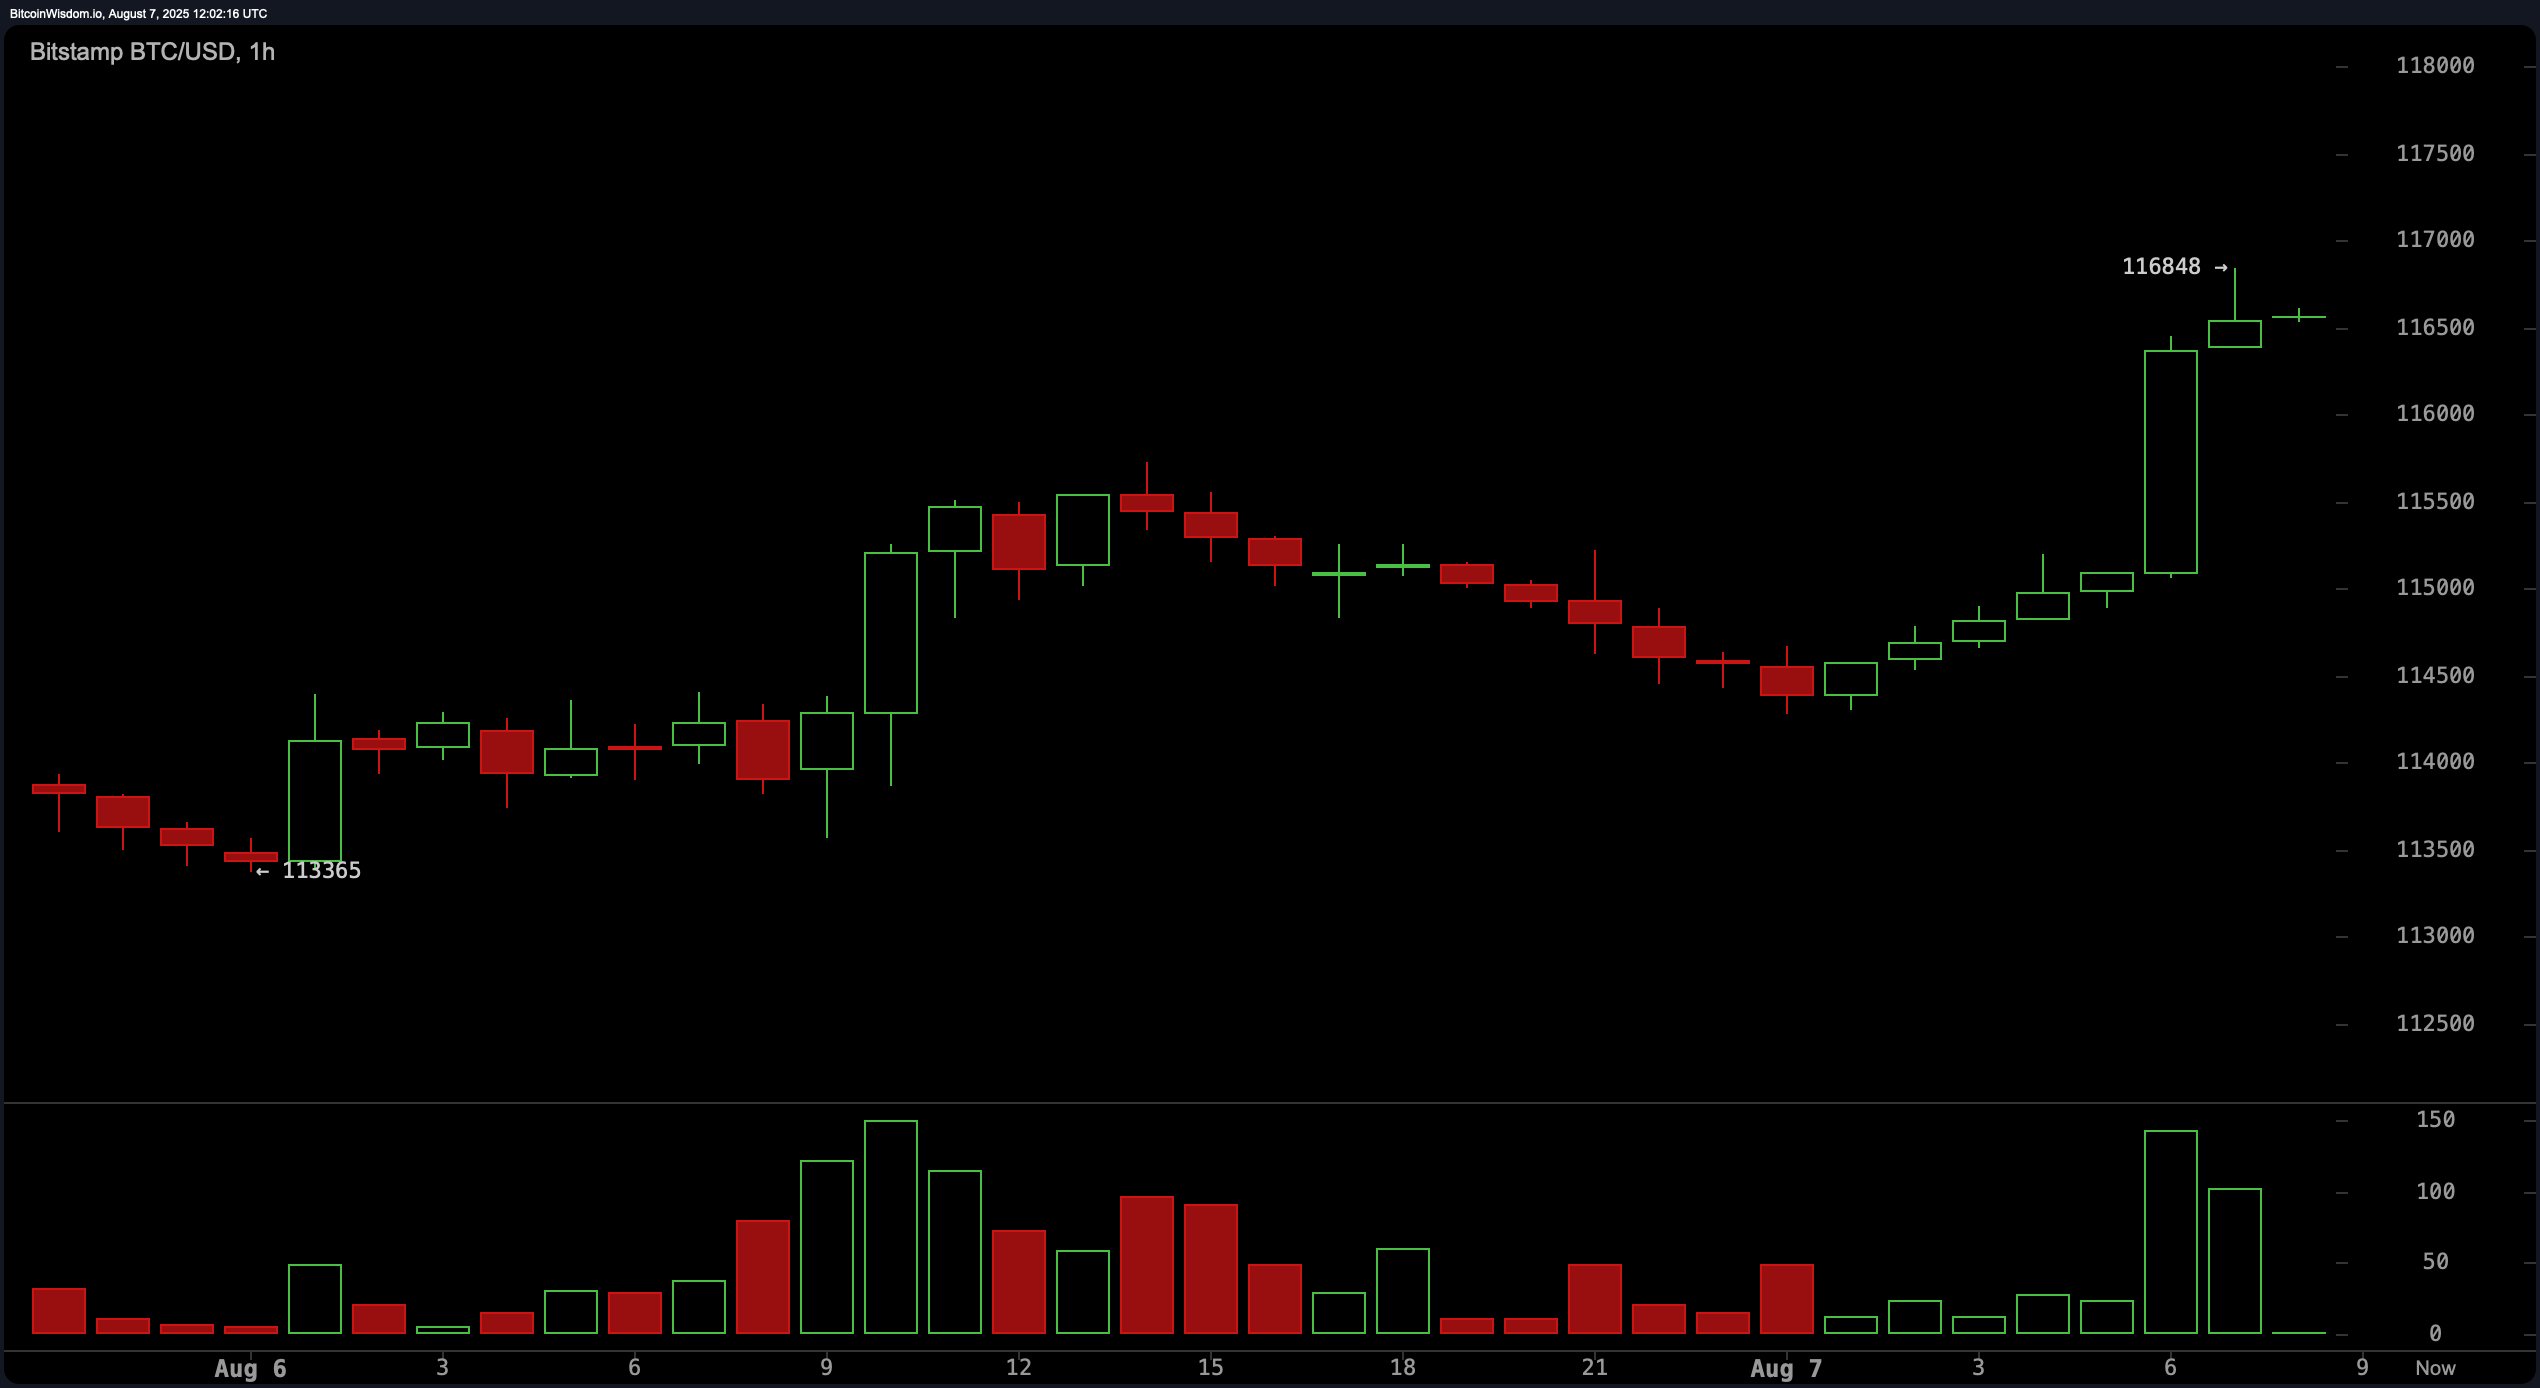
On the 1-hour chart, bitcoin recently printed a bullish engulfing candle, coupled with a significant spike in buying volume—an indication of strong near-term demand. This breakout from consolidation suggests bullish control in the immediate term, though traders should monitor for potential false breakouts, particularly near the $117,000 level. If price sustains above this zone, it would reinforce confidence in the bullish setup forming on the higher timeframes.

BTC/USD 1-hour chart via Bitstamp on Aug. 7, 2025.
Oscillator indicators remain largely neutral, suggesting the market is in a wait-and-see mode. The relative strength index (RSI) at 54, stochastic at 42, commodity channel index (CCI) at −31, and average directional index (ADX) at 18 all point to a balanced market without extreme momentum. The Awesome oscillator reads −1,419, also neutral, while momentum at −1,475 surprisingly signals a bullish trend. In contrast, the moving average convergence divergence (MACD) level at 200 indicates a bearish trend, highlighting the mixed nature of momentum indicators currently.
Moving averages (MAs) are showing increasing divergence, favoring the bullish side overall. The 10-period exponential moving average (EMA) and simple moving average (SMA) are both flashing bullish signals, joined by the 20-period EMA and 30-period EMA. However, the 20- and 30-period SMAs are in a bearish territory, indicating some near-term resistance. Longer-term moving averages, including the 50-, 100-, and 200-period EMAs and SMAs, all remain firmly bullish, showcasing a broader upward trend that supports continued appreciation if current resistance levels are cleared.
Bull Verdict:
If bitcoin sustains a close above $117,000 on strong volume, it will likely confirm a bullish continuation, with price targets extending toward $118,500 and potentially $120,000. Higher lows, improving volume profiles, and favorable long-term moving averages support the case for upward momentum.
Bear Verdict:
Should bitcoin face rejection at the $117,000 resistance and close below $114,500, a retracement to $112,000 or even $110,000 is likely. Volume inconsistencies and the possibility of a lower high formation on the daily chart suggest the rally could be a bull trap in disguise.
免责声明:本文章仅代表作者个人观点,不代表本平台的立场和观点。本文章仅供信息分享,不构成对任何人的任何投资建议。用户与作者之间的任何争议,与本平台无关。如网页中刊载的文章或图片涉及侵权,请提供相关的权利证明和身份证明发送邮件到support@aicoin.com,本平台相关工作人员将会进行核查。


