Trading Philosophy: Look for trends in the long term, find entry points in the short term;
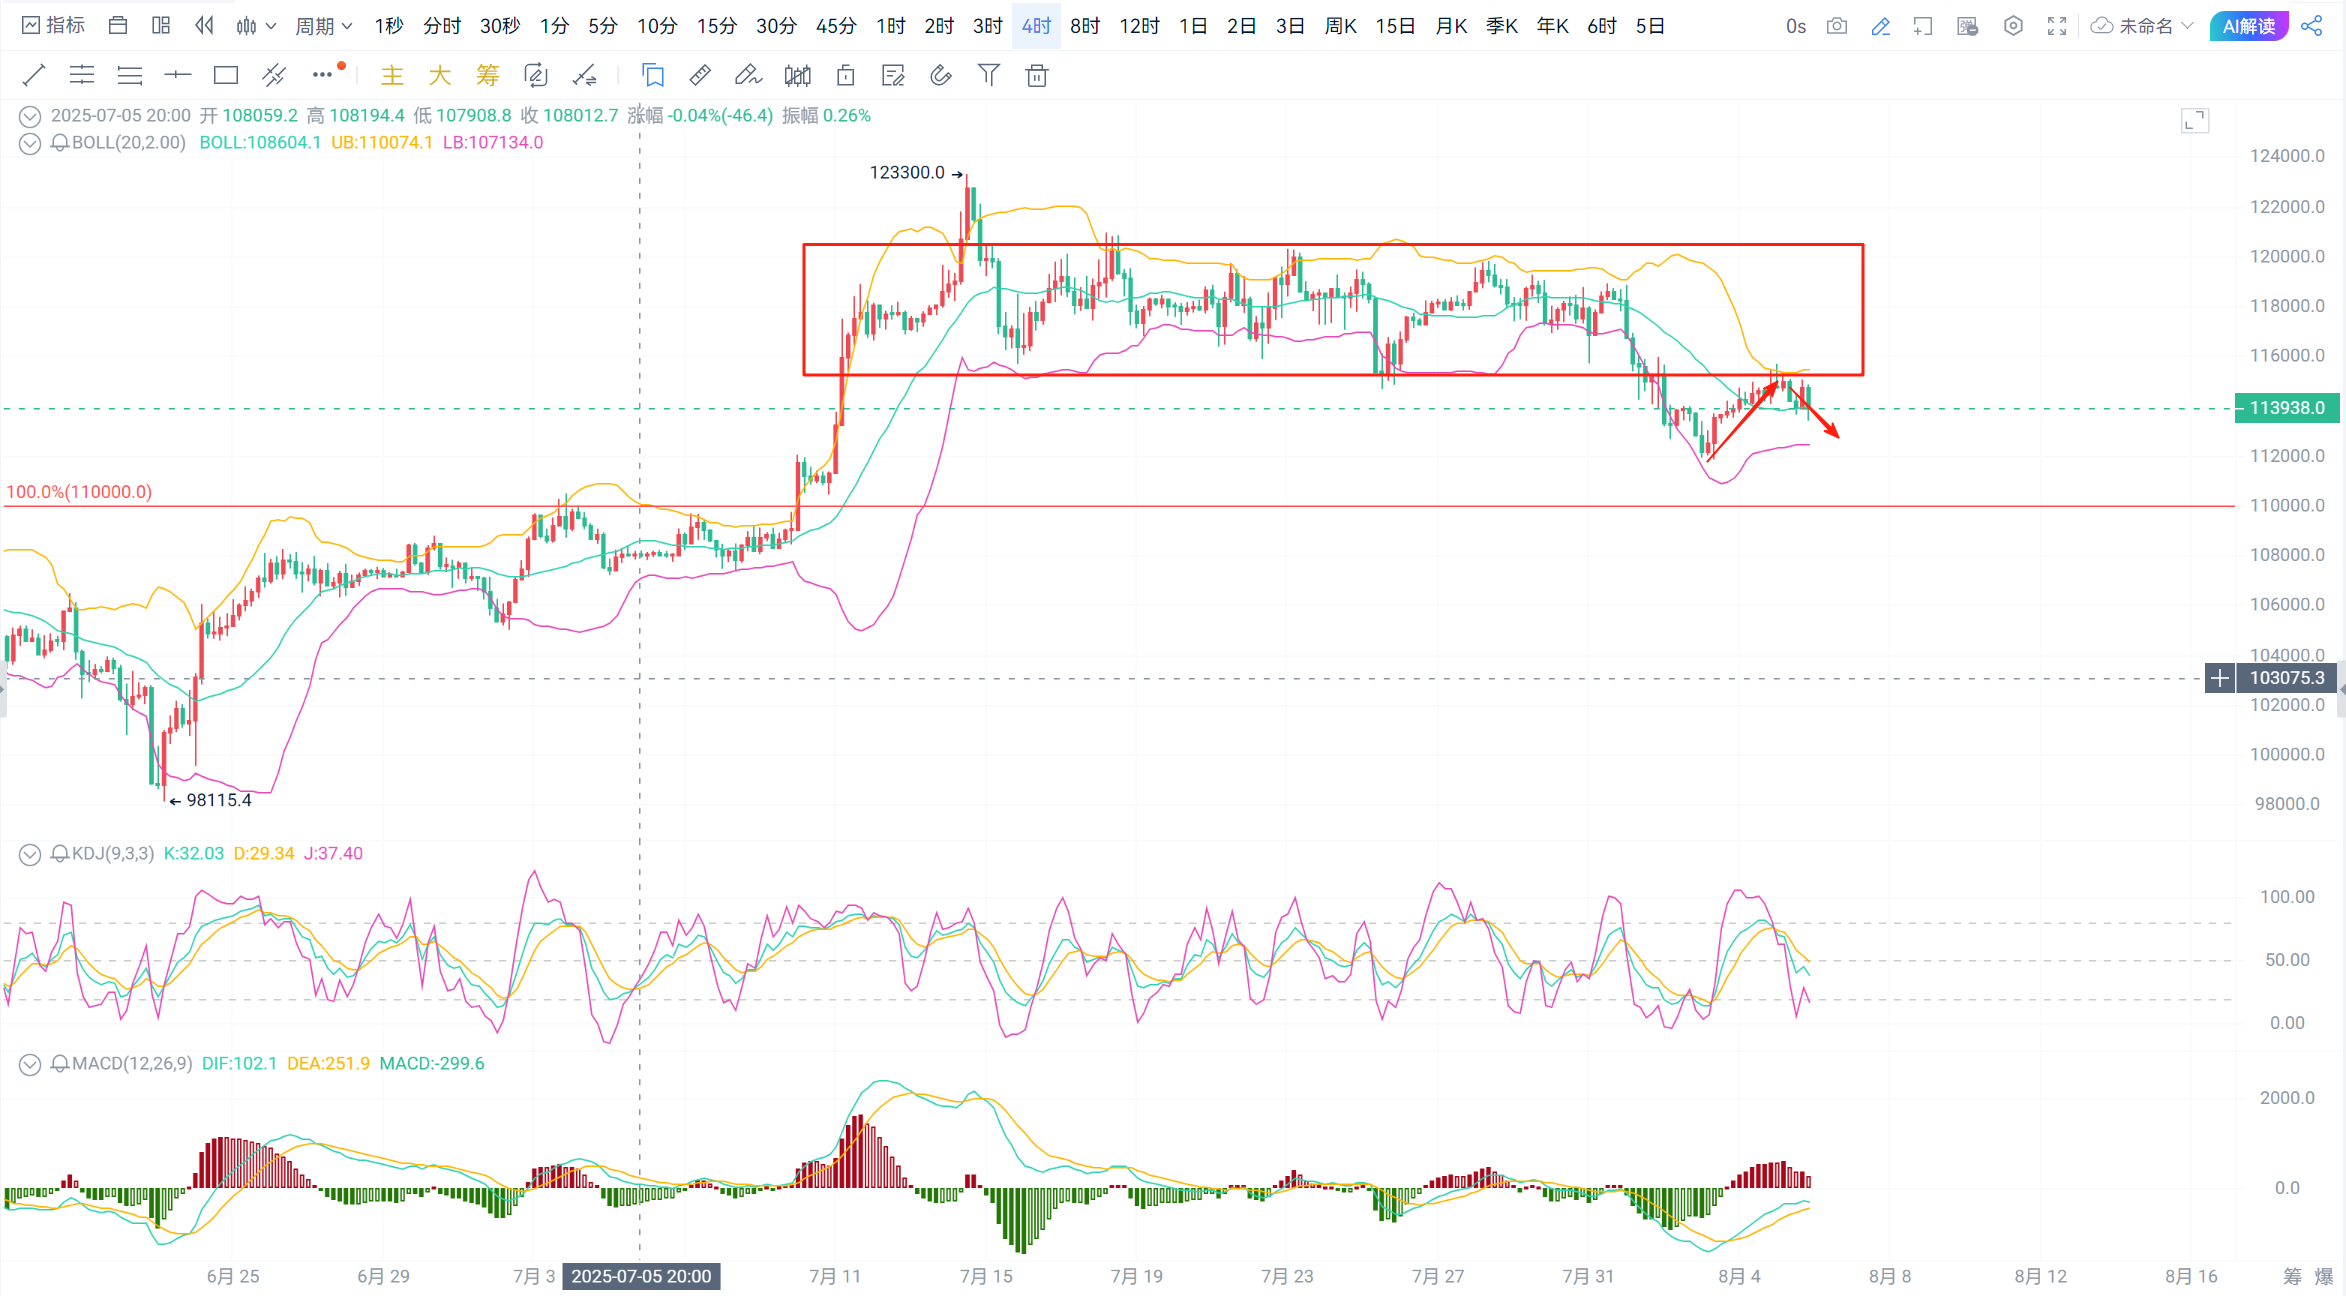
Technical Analysis: For Bitcoin, the daily chart continues to close with a bullish candle around 115,000. The Bollinger Bands continue to open downwards, and the MACD moving averages continue to trend downwards. Bearish volume is starting to decrease, and the KDJ is gently trending downwards. On the 4-hour chart, the Bollinger Bands are starting to flatten, the MACD moving averages continue to trend upwards, bullish volume is starting to decrease, and the KDJ is trending downwards;
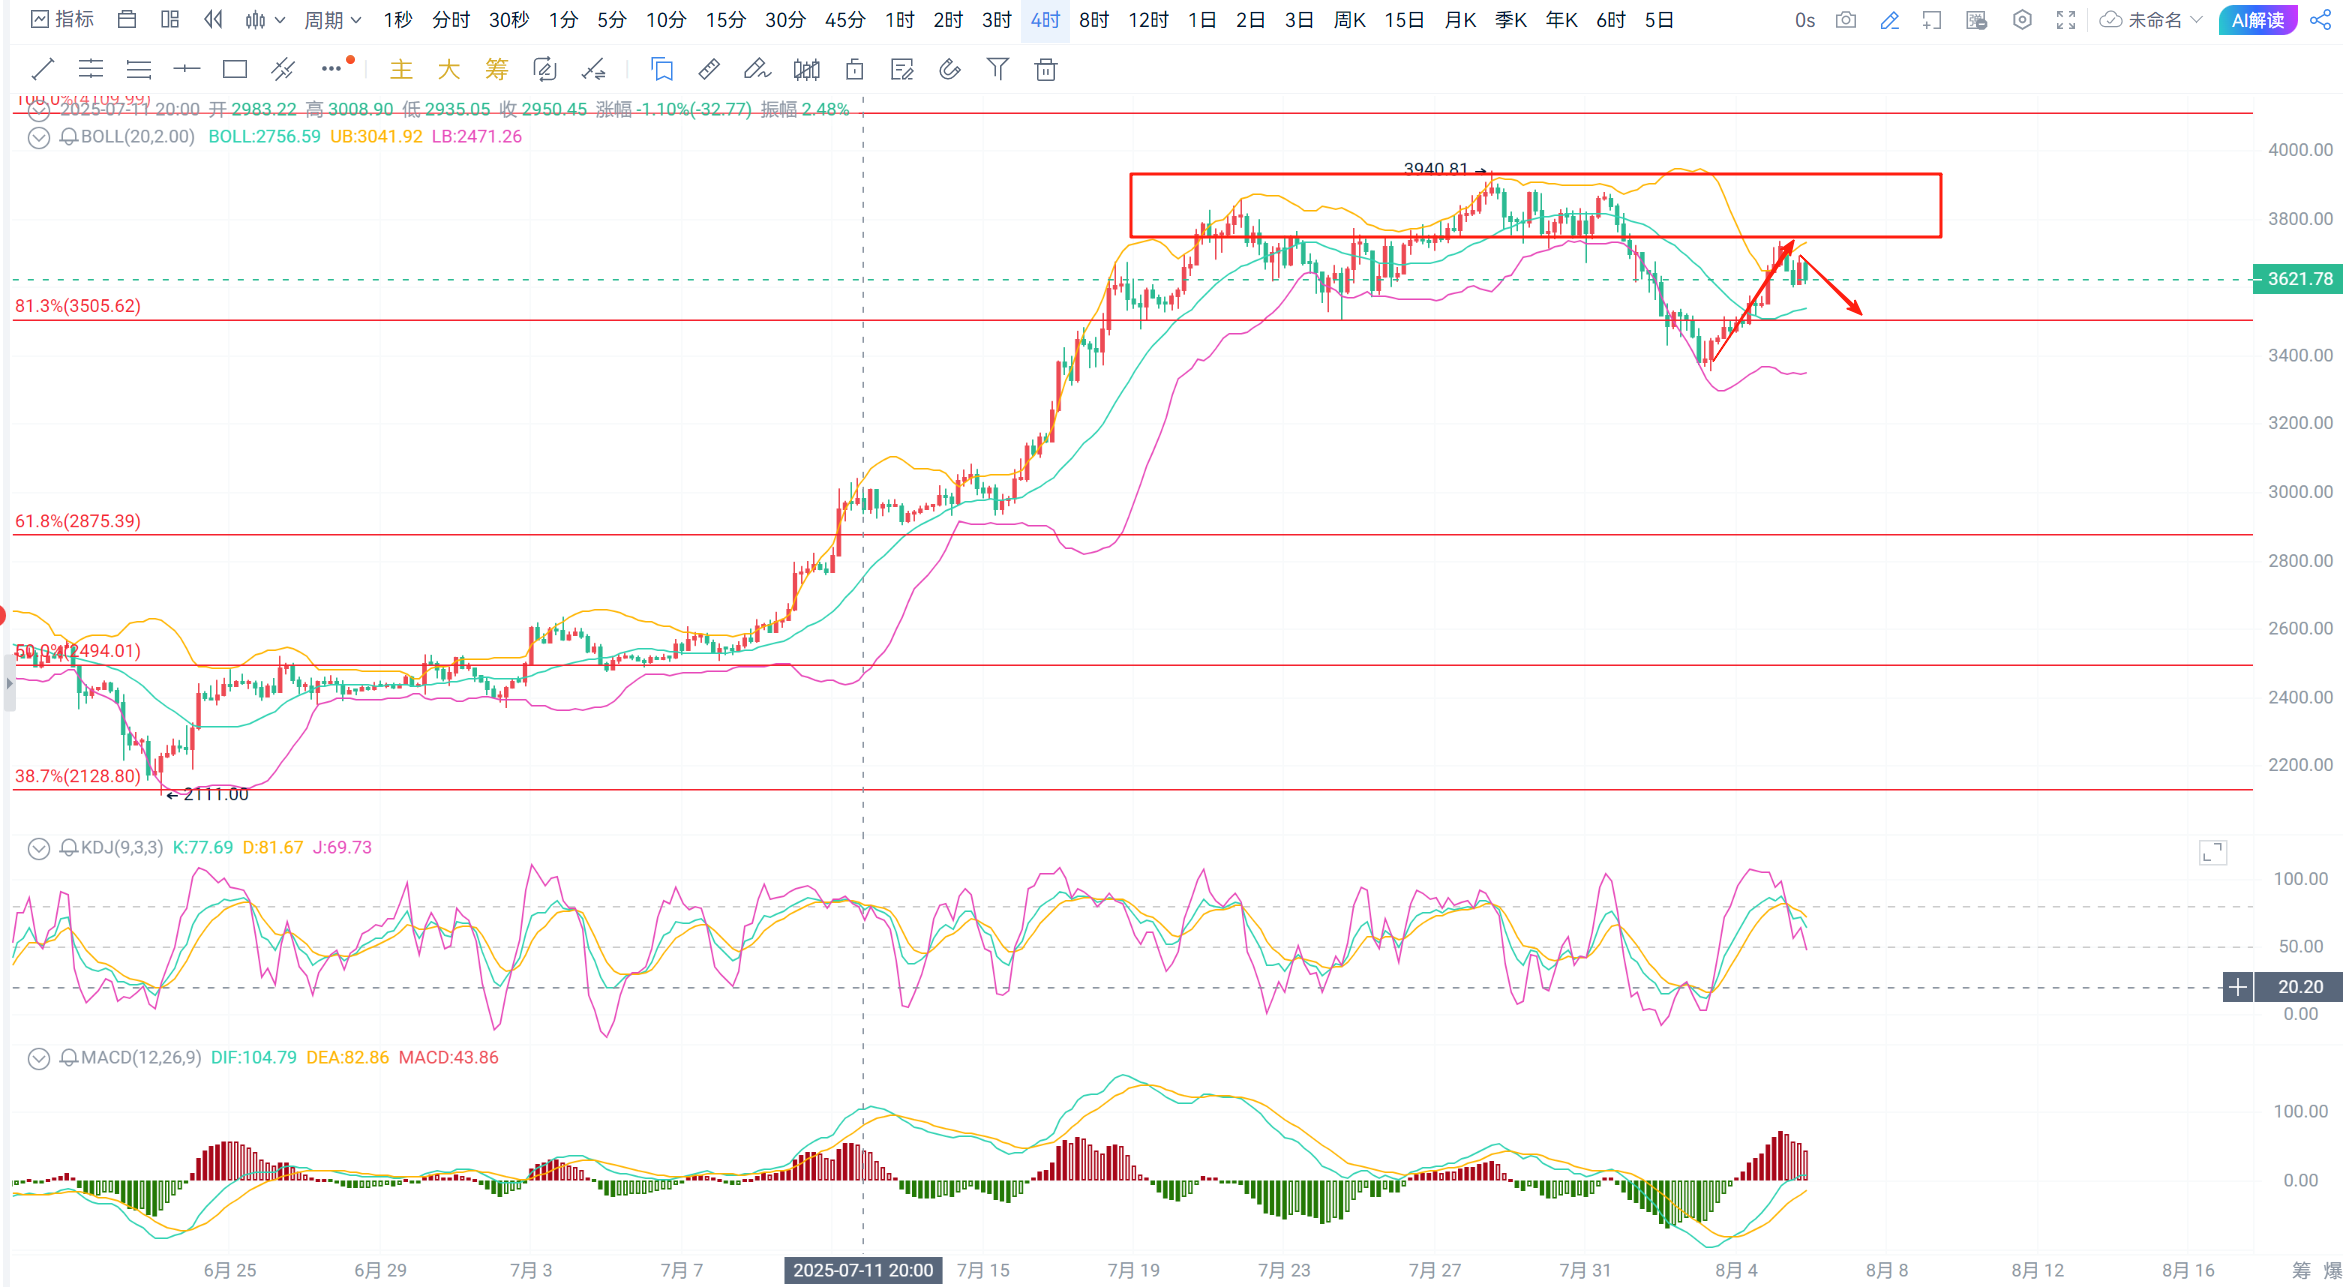
For Ethereum, the daily chart continues to close with a bullish candle around 3,720. The Bollinger Bands continue to close upwards, the MACD moving averages continue to trend downwards, bearish volume is starting to decrease, and the KDJ is starting to trend upwards. On the 4-hour chart, the Bollinger Bands are starting to open upwards, the MACD moving averages continue to trend upwards, bullish volume is starting to decrease, and the KDJ is trending downwards;
Currently, after a pullback, the rebound has encountered resistance. The short position established yesterday for Bitcoin has taken profit, while the Ethereum position has stopped out due to different price movements. It is recommended to continue shorting at high levels!
Operational Advice: Short at high levels!
Short Bitcoin at 114,500-115,000, target 113,000-112,000, stop loss at 116,000;
Short Ethereum at 3,670-3,700, target 3,550-3,500, stop loss at 3,740;
The strategy is time-sensitive; please refer to private real-time guidance for specifics!
Scan the QR code below to follow our WeChat public account for more real-time market updates!

免责声明:本文章仅代表作者个人观点,不代表本平台的立场和观点。本文章仅供信息分享,不构成对任何人的任何投资建议。用户与作者之间的任何争议,与本平台无关。如网页中刊载的文章或图片涉及侵权,请提供相关的权利证明和身份证明发送邮件到support@aicoin.com,本平台相关工作人员将会进行核查。


