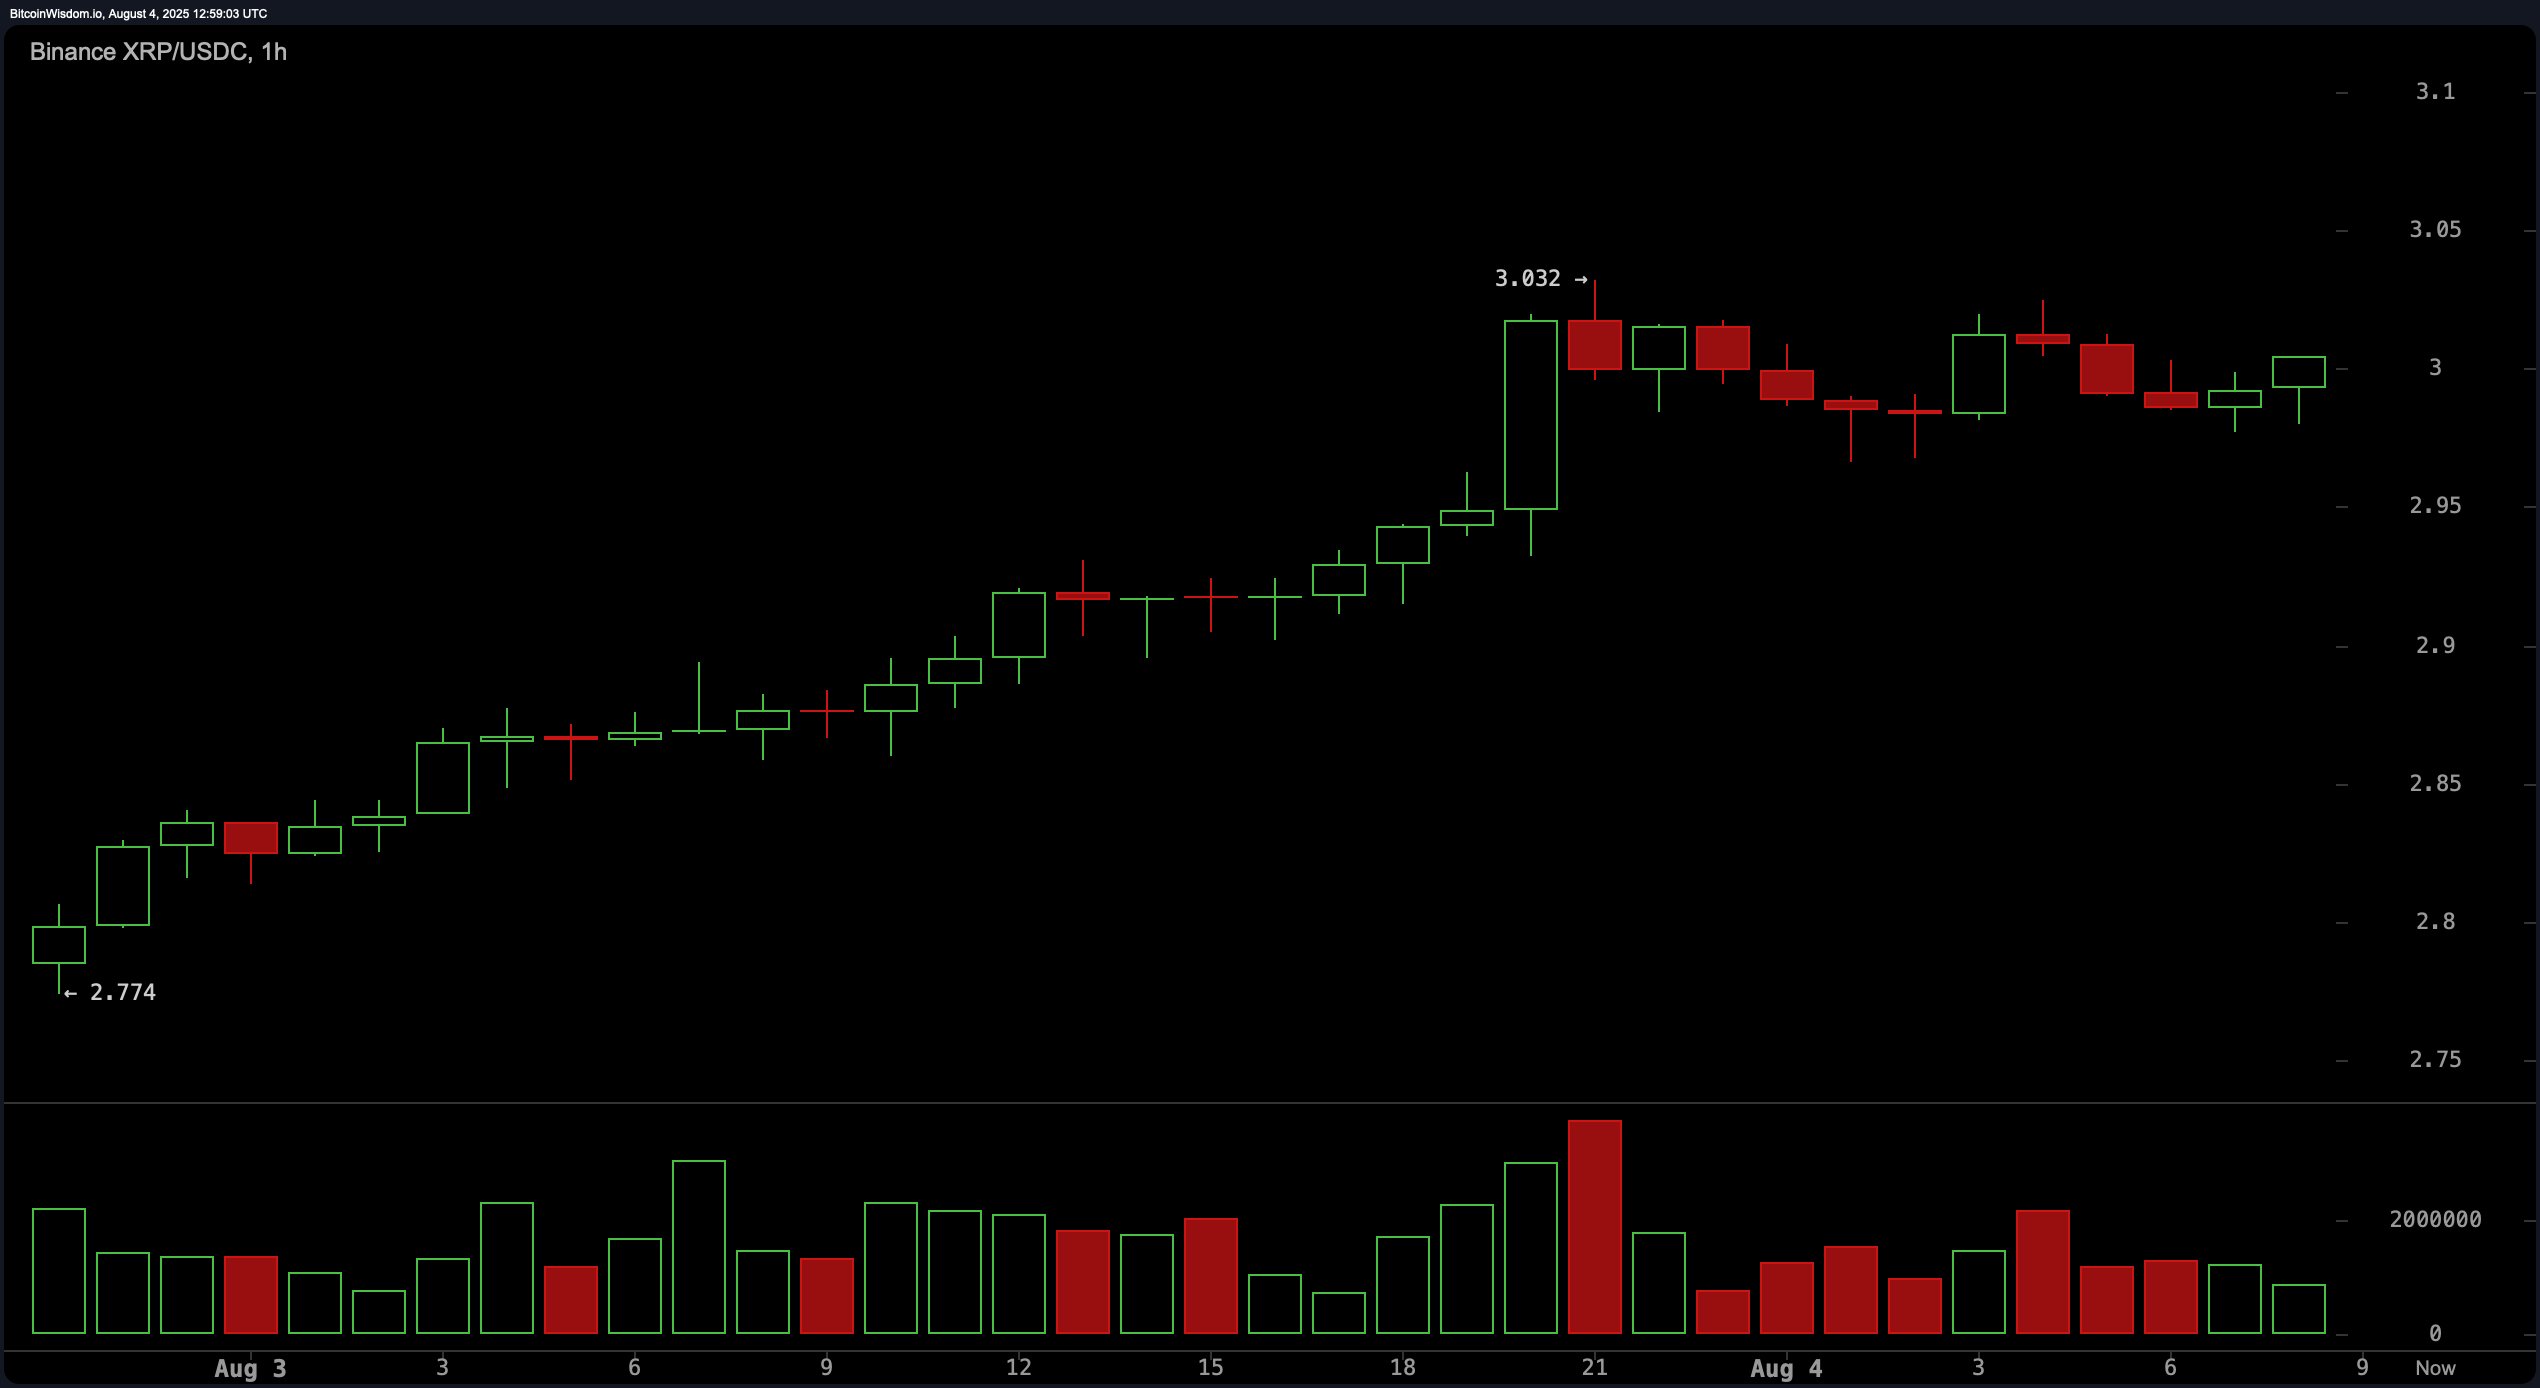
On the 1-hour chart, XRP has been on a steady climb from $2.77 to $3.03, currently consolidating just below the $3.05 resistance level. A volume spike at $3.03 led to rejection, confirming this area as a key short-term hurdle. Immediate support is noted at $2.98, making it a critical level for bulls to defend. A breakout above $3.05 with sufficient volume could open the door for a push toward $3.10–$3.15, while a breakdown under $2.98 could shift momentum toward $2.93–$2.90.

XRP/USDC via Binance 1-hour chart on Aug. 4, 2025.
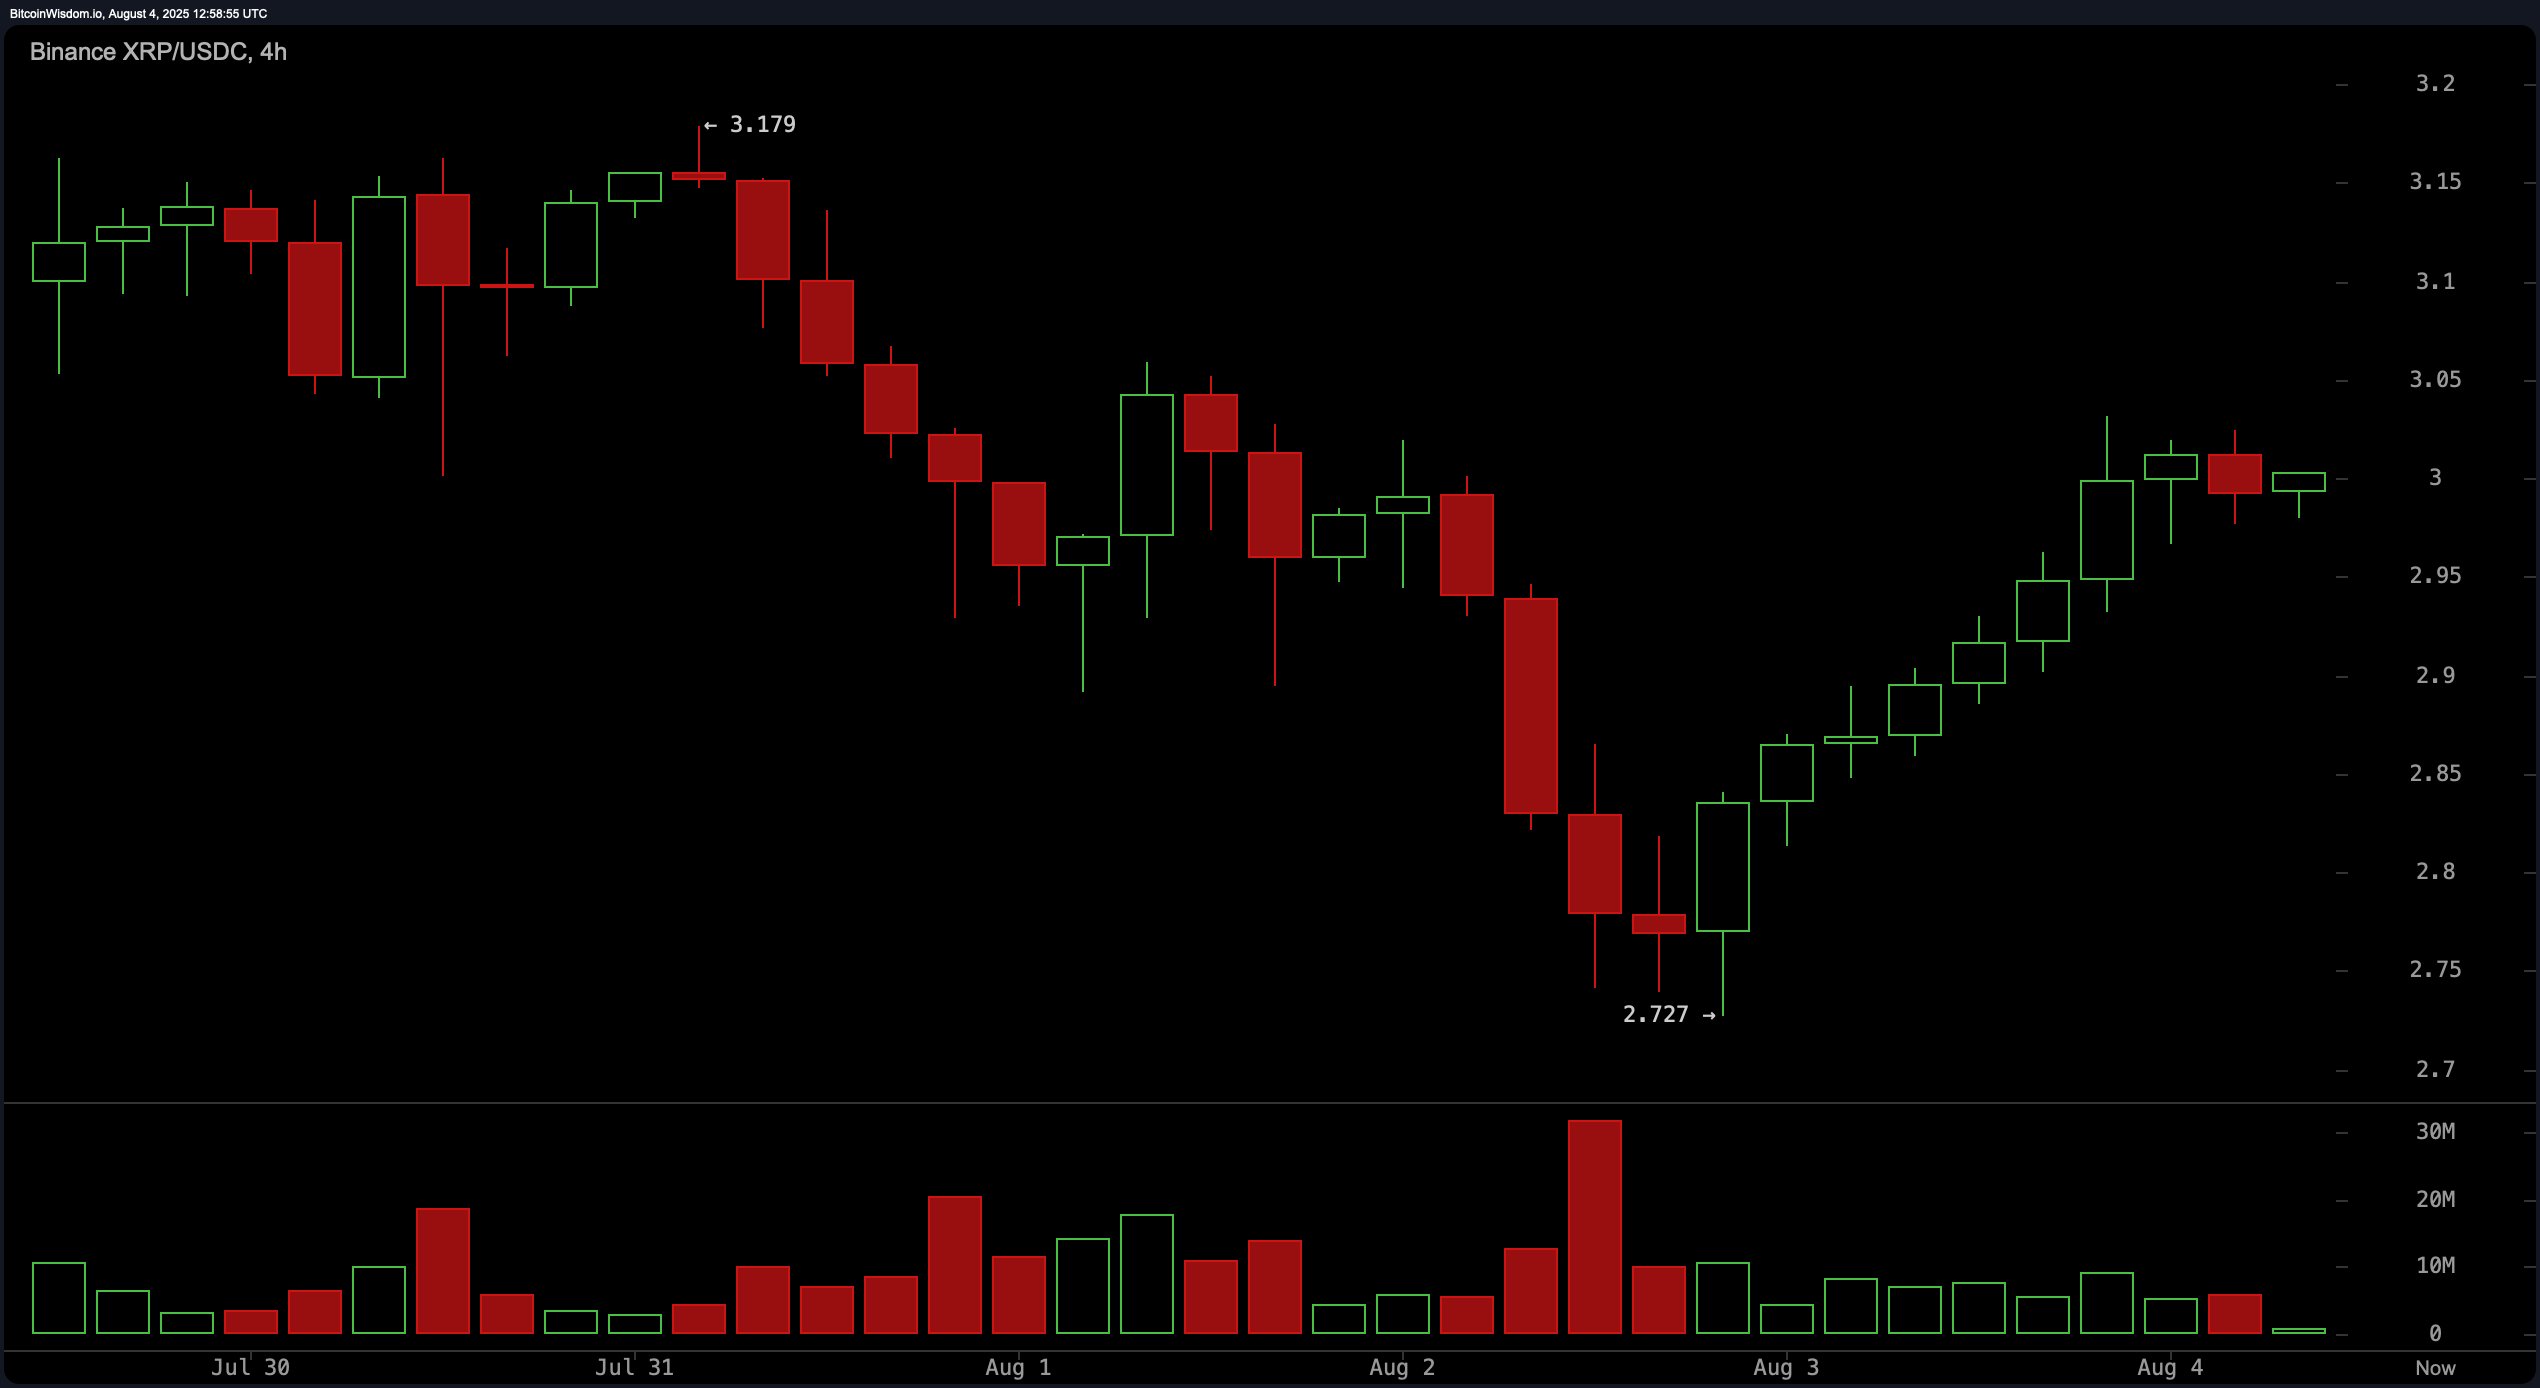
The 4-hour chart depicts a recovery from the $2.72 low back to the $3.00 region after a preceding downtrend from $3.17. The pattern now shows higher highs and higher lows, reflecting a tentative bullish structure. Short-term resistance lies at $3.05, while support at $2.90 is essential for maintaining upward momentum. Buying volume during the recovery is noticeable but remains weaker than the selling surge observed on August 2, signaling caution for traders.

XRP/USDC via Binance 4-hour chart on Aug. 4, 2025.
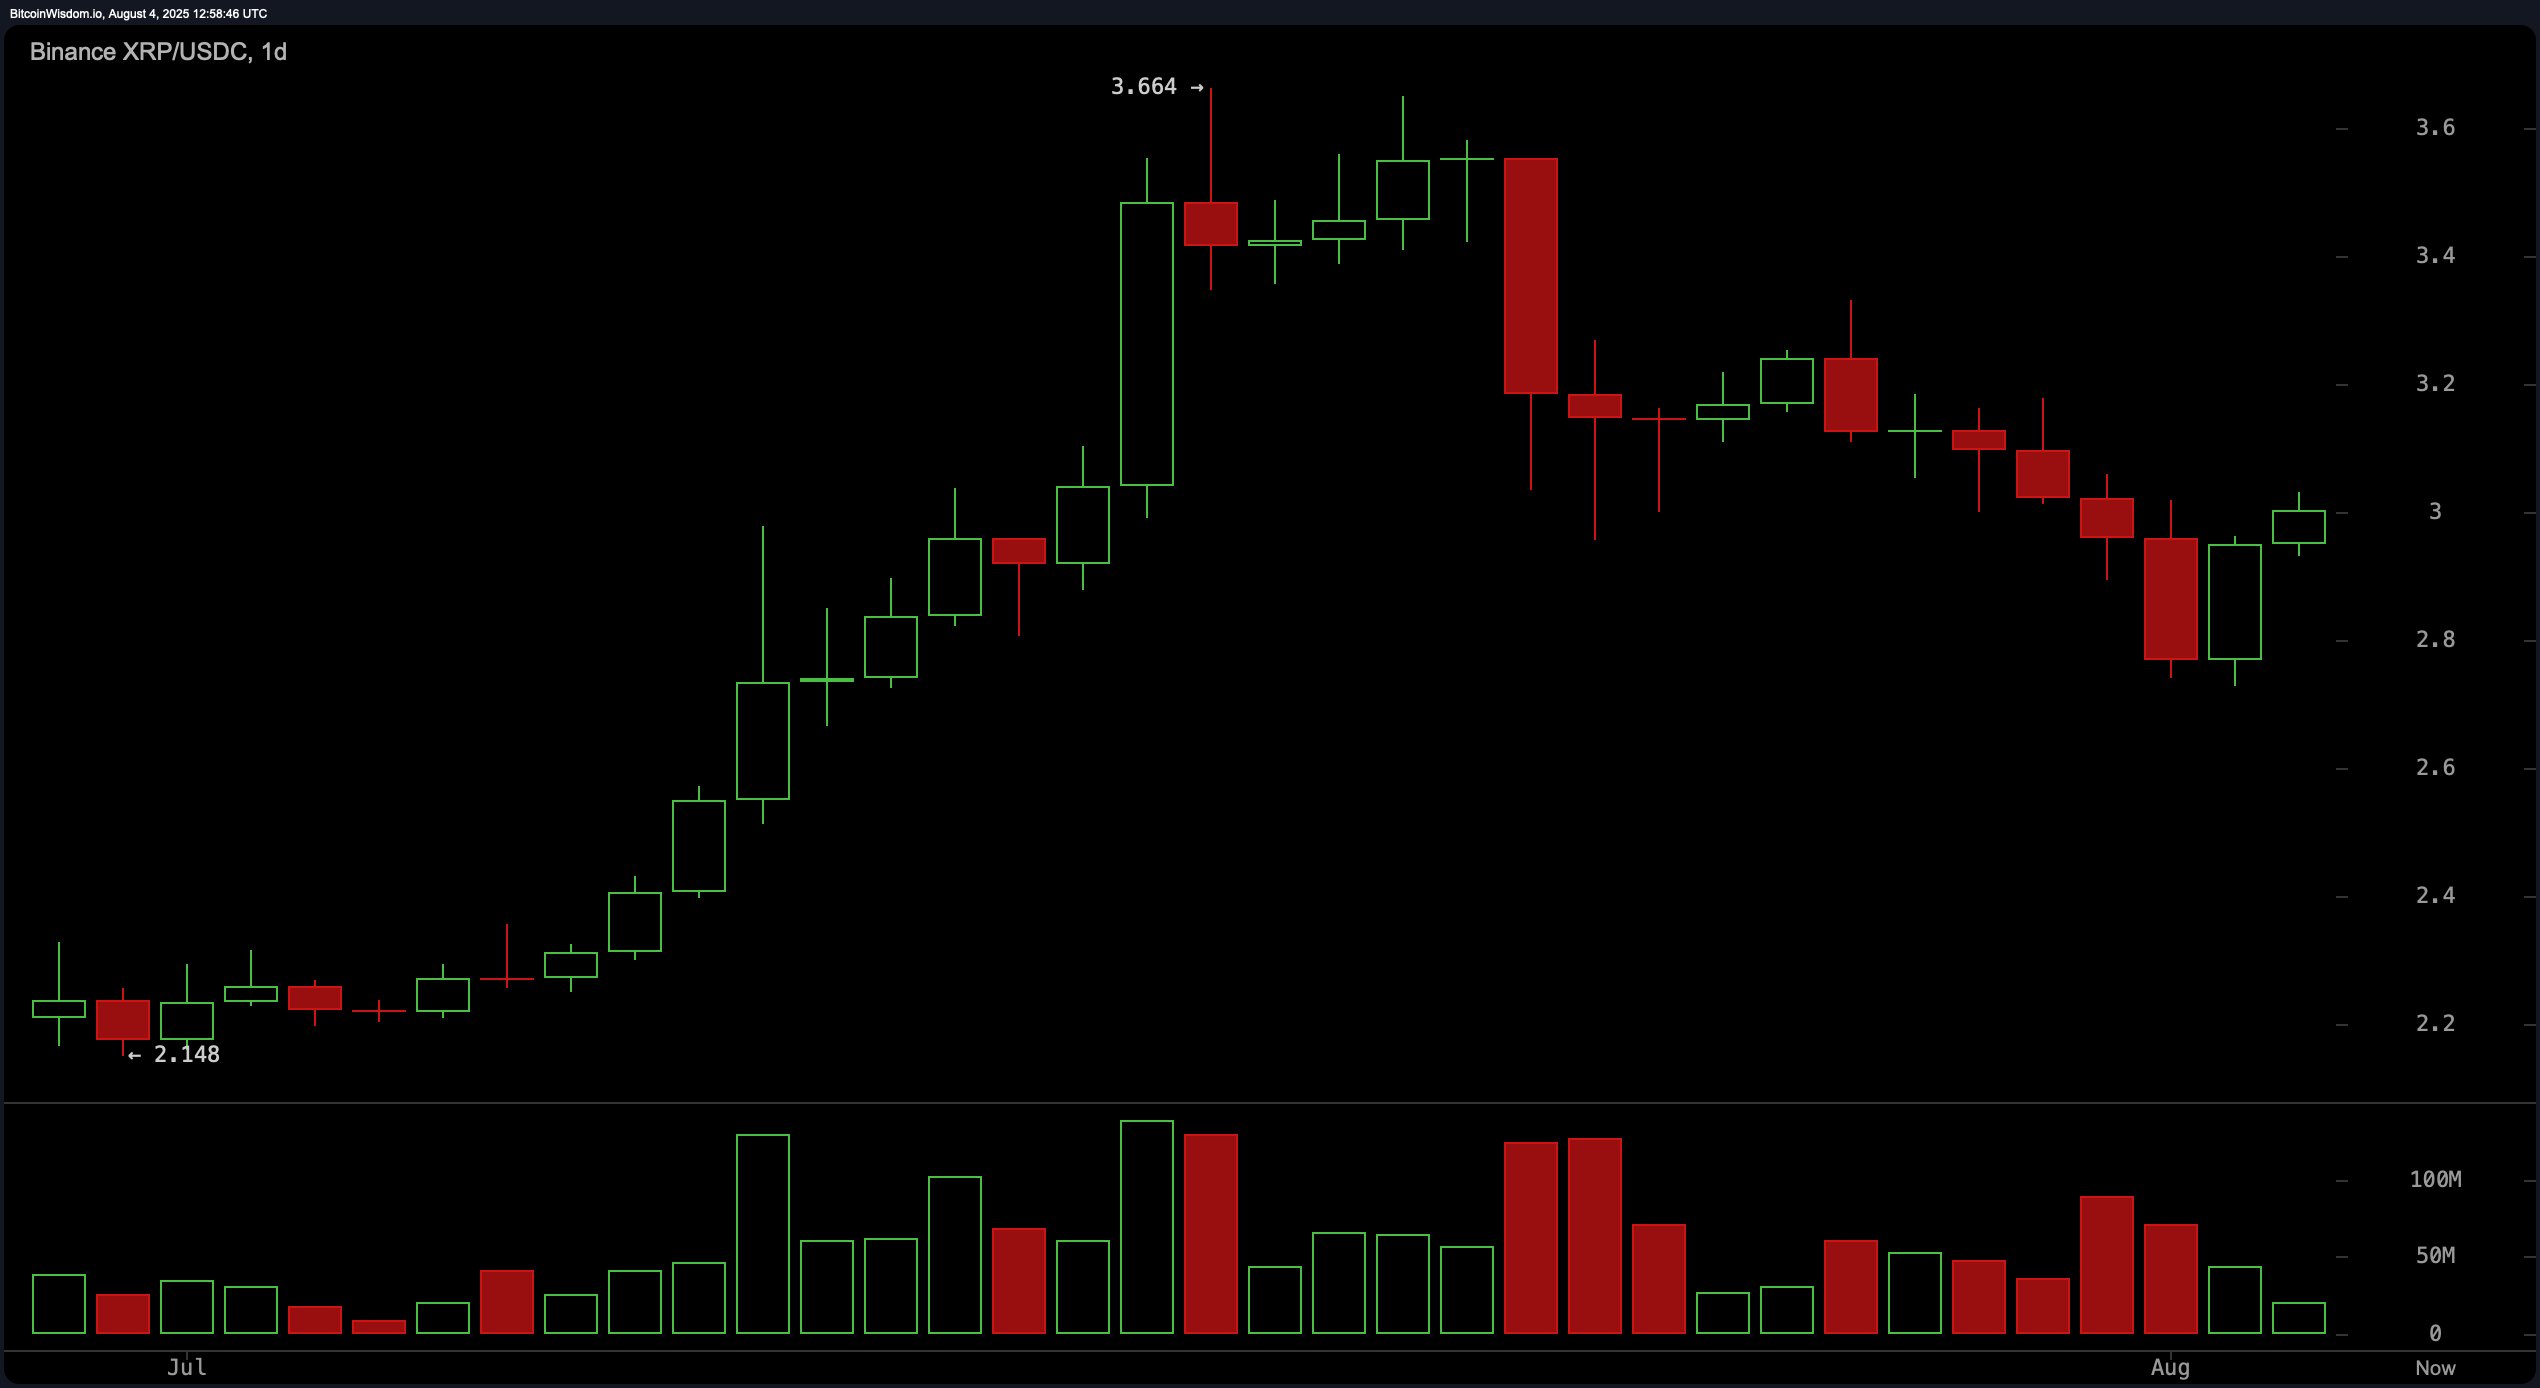
From the daily chart perspective, XRP remains in a macro uptrend that began with a surge from $2.15 to $3.66 before entering a corrective phase. The price is currently consolidating between $2.80 and $3.05 after a pullback from recent highs. Strong selling volume accompanied the drop from $3.66, while support at $2.80 continues to hold. A breakout above $3.20 with strong volume could reignite the uptrend toward $3.40–$3.66, but a fall below $2.80 could trigger declines toward $2.60.

XRP/USDC via Binance 1-day chart on Aug. 4, 2025.
Oscillator readings indicate a largely neutral market stance. The relative strength index (RSI) at 51.37 is neutral, as are the Stochastic oscillator at 19.53, the commodity channel index (CCI) at −77.91, the average directional index (ADX) at 34.20, and the Awesome oscillator (AO) at 0.05791. Momentum at −0.14546 suggests a positive signal on the daily chart, while the moving average convergence divergence (MACD) level at 0.05962 points to bearish sentiment. This mixed oscillator profile implies a market in equilibrium, awaiting a catalyst for directional clarity.
Moving averages (MAs) show a blend of bearish short-term signals and bullish longer-term trends. The exponential moving average (EMA) and simple moving average (SMA) over 10 and 20 periods both indicate negative trend signals, with EMA (10) at $3.02302 and SMA (10) at $3.04472. However, the EMA (30) at $2.94150 and SMA (30) at $2.99480 suggest buying pressure, as do the EMA (50) at $2.79232, SMA (50) at $2.66601, EMA (100) at $2.58549, SMA (100) at $2.47274, EMA (200) at $2.34144, and SMA (200) at $2.45413. This divergence points to short-term resistance, but further highlights solid support from medium to long-term holders.
Bull Verdict:
If XRP can maintain support above $2.98 on the 1-hour chart and break decisively above $3.05 with strong volume, the path toward $3.10–$3.15 in the short term becomes viable. A follow-through move could set the stage for a test of $3.20, and if that level is breached on the daily chart, bulls could aim for $3.40–$3.66 in the coming weeks.
Bear Verdict:
Failure to hold $2.98 on the 1-hour chart could invite selling pressure toward $2.93–$2.90, with a deeper drop possible toward $2.85. A breakdown below the daily chart support at $2.80 would signal renewed bearish momentum, opening the door for a decline toward $2.60 and invalidating the recent bullish recovery pattern.
免责声明:本文章仅代表作者个人观点,不代表本平台的立场和观点。本文章仅供信息分享,不构成对任何人的任何投资建议。用户与作者之间的任何争议,与本平台无关。如网页中刊载的文章或图片涉及侵权,请提供相关的权利证明和身份证明发送邮件到support@aicoin.com,本平台相关工作人员将会进行核查。


