作者:0xWeilan
六月报告中,我们指出:因洗盘充分,且较多筹码进入机构手中,下一次的拉升可能在短期内迅速完成。我们原本预计这一突破在8或9月完成,但如果降息预期推动,资金前瞻性买入,或结构配置加速,不排除拉升提前至7月的可能。
市场如期上涨,我们看到这一预期在7月迅速兑现。BTC全月上涨8.01%,并最高试探了12万美元的历史新高。
这背后是亢奋的企业购买、持续的ETF和稳定币通道资金流入所形成的物质支撑,然而降息预期、关税战实际落地情况发生了明显变化,压制了价格的快速上冲,也暂时打断了Altseason的展开。9月能否降息仍存在诸多不确定性。
2023年以来,美国个人投资者和企业界逐步加大对BTC为代表的加密资产的配置,及至2024年11月特朗普获选47届美国总统后,确立BTC为国家战略储备,并推动一揽子加密友好政策次第落地,标志着加密资产及区块链产业彻底告别蛮荒年代。
然而,加密市场的深度参与者却面临着冰火两重天的局面。一方面,BTC被新进资金长线增持,价格逐步上新台阶;一方面,Altseason似乎永远不再来,被视作区块链产业基石的Ethereum竟然在4月份被打至1300美元,跌破本轮牛市初期价格,令场内人士痛呼“信仰破灭”。然而,ETH在7月迅速反弹48.80%。
EMC Labs认为,加密产业正处于历史转折点,其结构变化之复杂,趋势之隐秘场内人士前所未见,也因此挑战巨大。决定资产价格的因素发生了巨变,正经历从此前供需周期递减和投机热潮驱动,向全类型资产棋局中的新兴资产配置逻辑转变。
我们正处于产业巨变的洪流中。
宏观金融:通胀反弹 Vs. 非农就业爆冷
7月,美国资本市场主要受控于“美联储何时重启降息+关税战如何落幕+经济及通胀数据表现”三大变量的博弈,略显狂热的前瞻交易主导市场,呈现大部分时间积极做多,月底消息落定超出预期后进行回调的态势。
美联储重启降息方面全月充满戏剧性。一方面特朗普持续在社交媒体极限施压,甚至直接造访美联储以维修工程超标震慑美联储主席鲍威尔;一方面美联储秉承“通胀+就业”的双重使命,坚持数据导向,在FOMC会议后做“鹰派”表态。美联储内部出现分裂,理事沃勒、鲍曼转向明确支持尽快降息,理事库格勒意外辞职。
7月31日FOMC会议后,FedWatch 9月降息概率定价一度跌至41%的低位,然而在8月1日7月超乎预期的非农数据发布后,这一概率定价迅速攀升至80%以上。
大部分时间里主导S&P 500走势的是9月降息及企业盈利强劲的预期,7月28日之后伴随9月降息概率下降,市场在连续3月大涨之后启动调整。BTC也随之跌破115000美元,以ETH为代表的Altcoin则跌幅更大。
美联储主席在FOMC会议后的讲话中强调,关税对通胀数据的影响在未来2月可能会进一步提升。
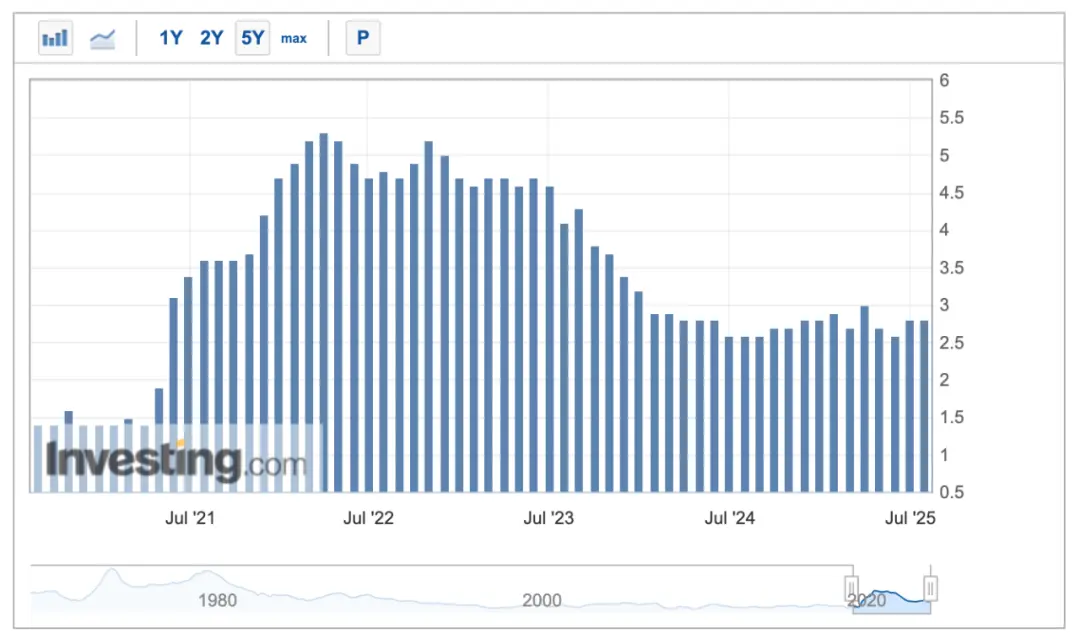
美国 PCE 数据
7月,特朗普宣布更多国家的关税税率的确超乎了市场预期。沉寂两个月之后,处于落幕过程中的关税战再次成为影响市场定价的主要因素。
当前“对等关税”体系呈“10%基准+15–41%国别梯度 + 欧盟特殊公式+40%转运惩罚”四层结构。最高档41%主要针对地缘安全高风险地域;中档25–35%则锁定顺差大、壁垒高且谈判进展有限的伙伴;10%基准则被广泛适用,并作为对华暂缓方案。
其中主要贸易国/地区中,欧盟15%,加拿大35%,日本15%、韩国15%,墨西哥10%(一般商品)/25%(汽车等)/ 50%(钢铝铜)(仍在谈判),中国30%(暂缓90天待定)。这一结果超出市场预期,加大了市场对于通胀上升的担忧,市场在8月1日前后向下定价再平衡。
在经济及就业数据方面,美国经济整体呈现“相对韧性+增长相对强劲”的态势。7月30日发布的美国Q2 GDP年率为3%,扭转Q1的负增长趋势,超出预期。在7月大型科技公司发布的财报中,也可以看到AI浪潮驱动大型企业在加大企业投入,同时AI投入已经开始驱动利润增长。
当然数据背后亦有隐忧,消费复苏依然疲弱,企业整体投资依然不振。
而8月1日发布的7月非农数据则对市场形成重创,导致美股出现大幅下跌。数据显示,7月非农就业新增仅7.3万人,大幅低于预期的11万。此外,5月非农数据由14.4万下修12.5万至1.9万,6月由14.7万下修13.3万至1.4万,两月合计下修25.8万。这些数据大幅超过市场预期,令市场对“软着陆”再生恐慌,向下定价完成再平衡。
全月,市场在降息和经济不着陆预期下亢奋上涨,月底发布的关税税率和非农就业“重创”市场向下定价。
全月,纳斯达克、S&P 500和道琼斯指数分别上涨3.7%、2.17%和0.08%。BTC上涨8.01%,ETH上涨48.8%。
8月美股仍然存在向下再平衡的风险,非农数据爆冷之后9月降息概率重返80%,然而通胀反弹忧虑仍然困扰降息预期,此外就业数据虽未能对美国经济全年增长形成根本性打击但仍然形成困扰。
9月能否如期降息,未来一月将发布的通胀和非农就业数据备受瞩目。
加密资产:BTC上升中继,Altseason或将打开
7月,BTC 开于107173.21美元,收于115761.13美元,最低105119.70美元,月内创历史新高123231.07美元,月涨幅8.01%,振幅16.9%,成交量较6月明显放大。
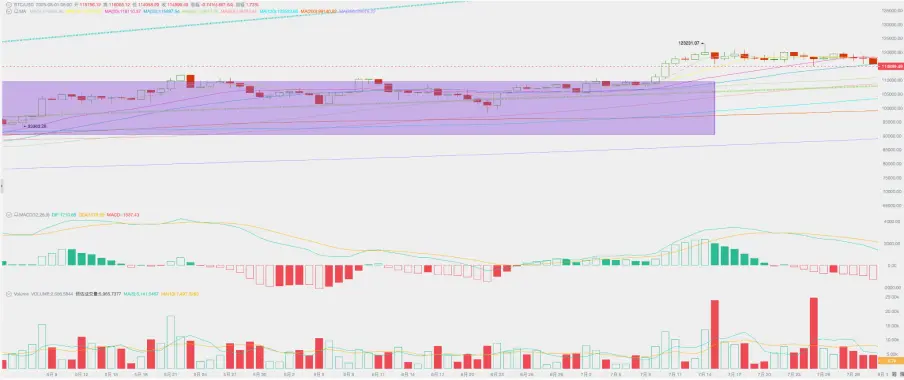
BTC价格日线
在6月报告中,我们指出BTC在“特朗普底”(上图紫色区域)震荡长达8个月,换手充分,Q3已具备启动第四波行情条件。市场如期在7月份突破这一区域并在数个交易日内持续上冲,中旬起随着长手尤其远古巨鲸抛售,叠加宏观金融环境动荡,BTC价格未能持续攀升,转而再次震荡整理。
以技术指标来看,BTC仍运行于60日均线和牛市第一上升趋势线(上图绿色点线)之上,月度成交量放大,正处于新一轮上涨中继。
以月度周期来看,MACD快慢线仍在扩张阶段,显示市场仍然处于强劲的上升动能之中。
合约方面,持仓规模月初至下旬持续上涨显示市场做多热情旺盛,但下旬开始持仓规模和资金费率均出现明显下行,在不确定增强背景下一定规模的杠杆资金选择离场避险。
7月份另外一个重要事件是加密市场内部Altseason似有再次启动迹象,在企业购买的强力推动下,ETH单月上涨48.8%,ETH/BTC交易对突破技术指标压制。我们认为,伴随降息邻近风险偏好提升,Altseason再次打开系大概率事件。
筹码结构:周期长手启动第三轮抛售
伴随7月买力袭来,长手群体启动本轮牛市第三波抛售。
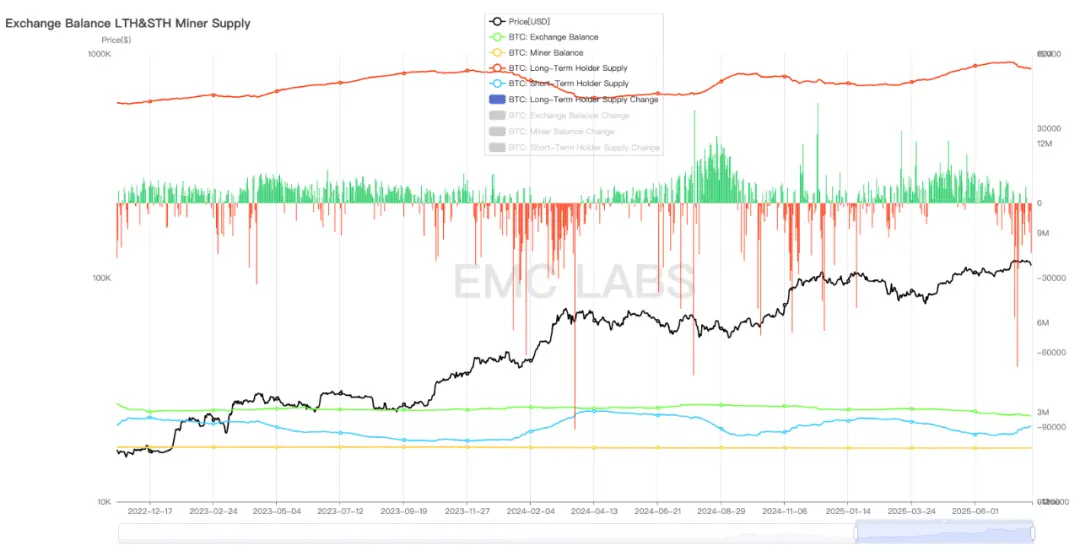
长短手持仓及变化
据eMerge Engine数据,长手7月总计减持了近20万枚BTC,其中包括一个中本聪时代诞生的钱包中的8万枚。与之对应,短手持仓也迅速上涨。
BTC由长手流入短手手中,增加了市场的短期流动性对价格形成压制,然而可以看到远古巨鲸的短时抛售对市场价格影响相较过去要小很多,显示随着市场参与结构的变化,市场深度明显增加。
中心化交易所BTC继续处于流出状态(超过4万枚),预示着机构采购仍在延续。机构配置是本轮牛市BTC价格上行的直接动力。
截止7月底,上市公司直接持有BTC规模已经超过总供应量的4.5%。
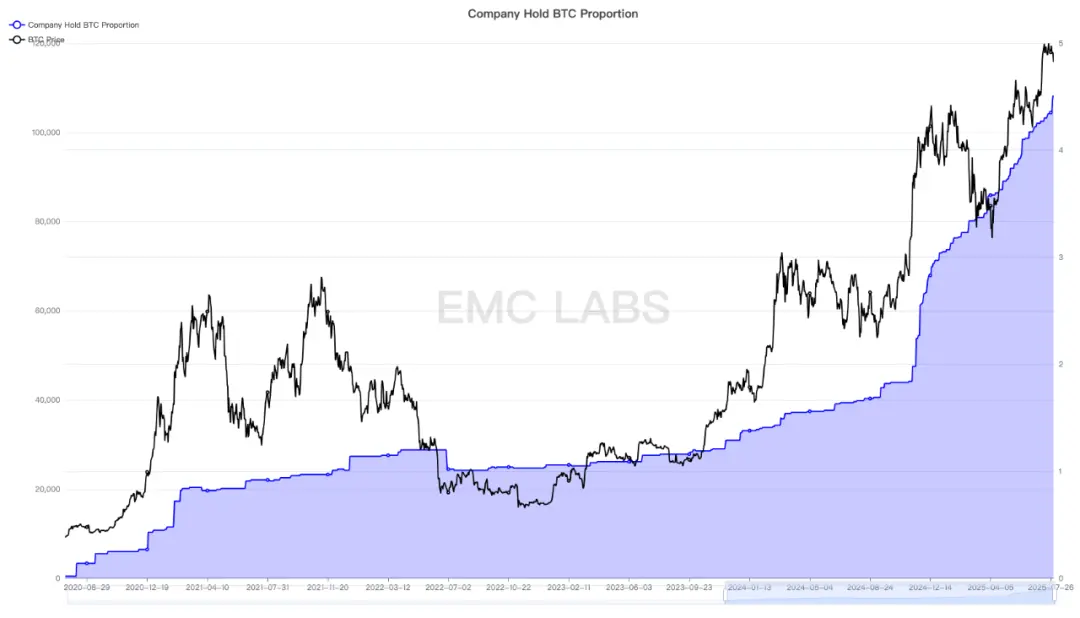
公司持有BTC规模统计
今年以来,上市公司等机构直接购买BTC纳入财库的规模已经超过BTC Spot ETF通道,正式成为BTC市场的第一大买家。
资金流向:超295亿美元流入为,成史上第二大月份
本月总计超过295亿美元流入加密市场,其中稳定币120亿,BTC+ETH Spot ETF 113亿,企业采购62亿。企业采购为可统计的BTC市场单一最大买力来源。
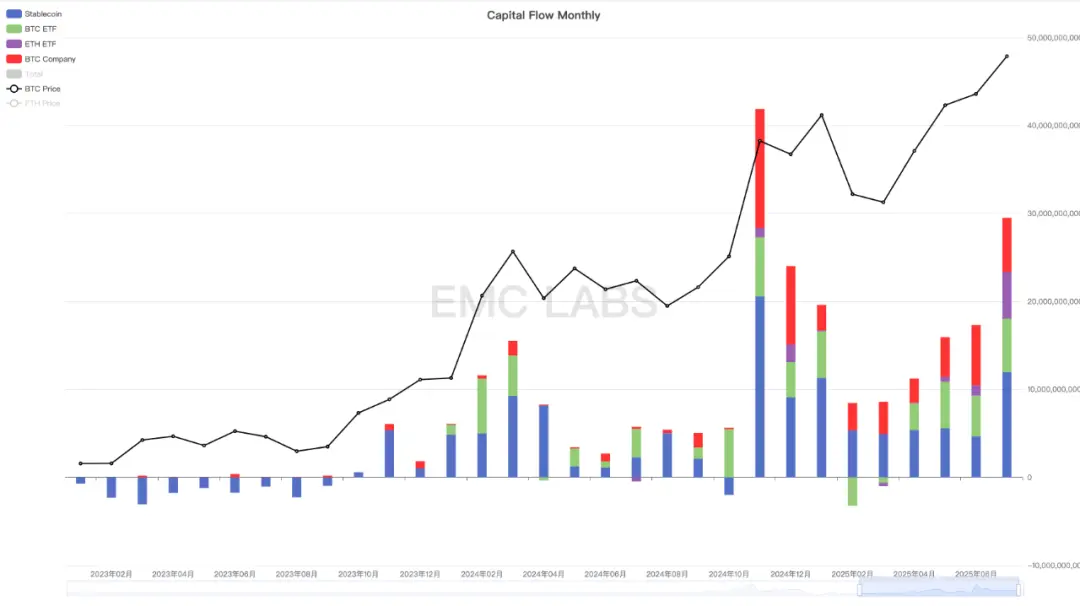
加密市场资金流向月度统计
总计295亿美元流入使得7月成有史以来第二大流入月,是BTC得以突破长达8个月的盘整区域,吸收巨额抛压推动价格再创历史新高的物质支撑。
值得注意的是,总资本流入已经连续5个月增长,推动BTC从4月创下的半年低点持续攀升并创出历史新高。
美国企业对于BTC的配置仍在持续加速,加入企业也越来越多,预计未来一段时间仍是推动价格上涨的最重要因素。
此外,本月ETH Spot ETF流入资金达到52.98亿美元成历史最高月份,逼近BTC Spot ETF通道的60.61亿美元。背后是伴随降息邻近,及加密资产在美国的进一步拓展,越来越多的资本开始流转至ETH。同时,配置ETH的公司也越来越多,及至月底这些公司配置ETH已经占到总流通量的2.6%,虽然仍低于BTC的4.6%,但增速很快,ETH的定价权亦正在从场内转移至场外。
结语
eMerge Engine显示,BTC Metric 为0.75,BTC处于牛市上升期。
多维度分析来看,BTC仍然处于本轮牛市第四波上涨的中继期,8月震荡之后大概率将继续向上。
ETH领衔,随着降息邻近,全市场风险偏好提升,Altseason大概率将打开。
关税战冲突、美国通胀及就业数据成最大尾部风险。
免责声明:本文章仅代表作者个人观点,不代表本平台的立场和观点。本文章仅供信息分享,不构成对任何人的任何投资建议。用户与作者之间的任何争议,与本平台无关。如网页中刊载的文章或图片涉及侵权,请提供相关的权利证明和身份证明发送邮件到support@aicoin.com,本平台相关工作人员将会进行核查。


