The fluctuations in the cryptocurrency market are like the waves in a turbulent sea, making people feel anxious. However, its charm lies in the fact that it never looks at your past report card. Stop saying "I'll enter the market when it stabilizes"; opportunities in the crypto world never lie in "stability." The real dividends always belong to those who dare to position themselves amid uncertainty. Market volatility is not a risk; failing to understand trends is the biggest risk.
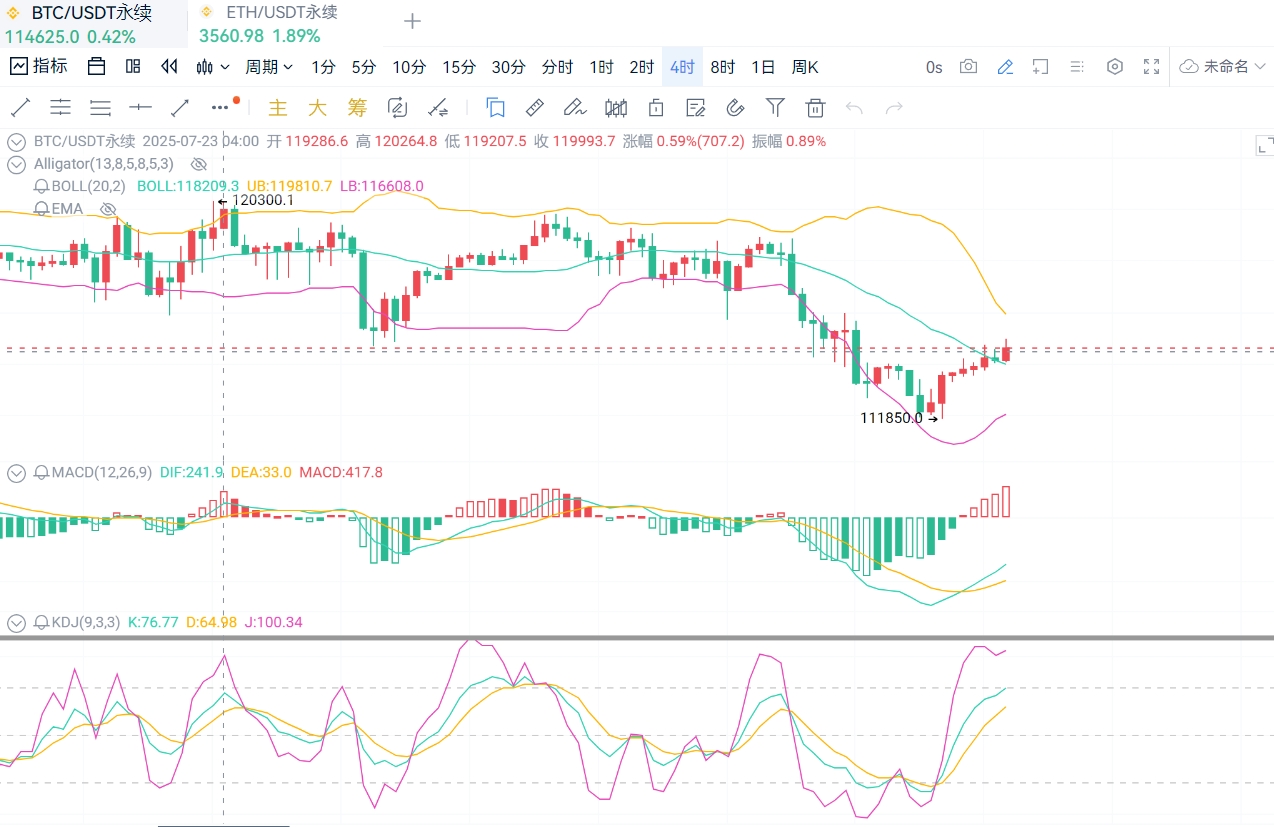
On August 3, Bitcoin rebounded from a low of $112,248 to $114,234, stabilizing at the key support level of $114,000, but failed to break through the resistance zone of $115,000. The price has been oscillating around the support level of $114,000 and the resistance level of $115,000, down about 6.6% from the July high of $123,128.
From a technical perspective, the daily MACD shows a bottom divergence signal, indicating enhanced short-term rebound momentum. However, the 4-hour Bollinger Bands are opening downwards, and the overall market is still in a phase of oscillation and repair.
The first support level is at $113,200, the second support level is at $112,000, and the third support level is at $111,000.
The first resistance level is at $115,000, the second resistance level is at $116,500, and the third resistance level is at $118,000.
In terms of sentiment and funds, Bitcoin's fear and greed index has dropped to 53 (neutral zone), with ETF funds continuously flowing out (a net outflow of 949 BTC on August 1), but the proportion of long-term holders on-chain remains high. On the macro front, weak U.S. non-farm data has raised expectations for interest rate cuts, but tariff policies are putting pressure on risk assets.
For long positions, it is recommended to enter lightly if it stabilizes around $113,500, with a stop loss at $112,500 and a target of $115,000.
For short positions, if it rebounds to $115,000 and faces pressure, it can be shorted to $113,000, with a stop loss at $115,500.
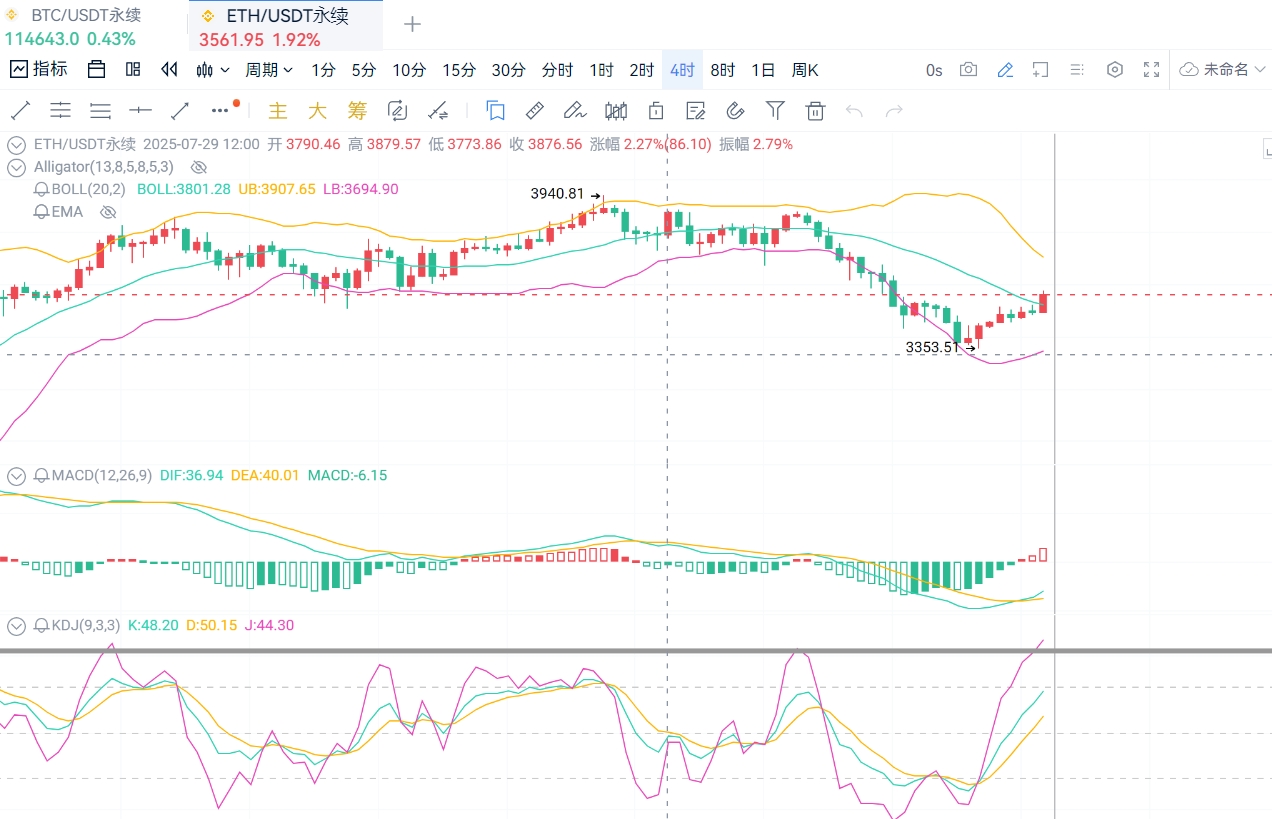
Ethereum has rebounded to around $3,550 after hitting a low of around $3,350 yesterday, having stabilized above the $3,500 mark. In terms of market drivers, the Pectra upgrade has expanded the Layer 2 ecosystem, but short-term fee income decline is suppressing prices. Ethereum ETFs have seen continuous net inflows (a net inflow of 8,183 ETH on August 1), with institutional preferences shifting towards ETH.
From a technical perspective, the 4-hour MACD is still below the zero axis, with bears in control, but a golden cross is still forming below, and the K-line has broken through the middle track of the Bollinger Bands, indicating the possibility of further pullbacks. On-chain data shows that ETH staking volume has reached a new high, and DeFi activity is warming up, but it faces resistance at $3,550-$3,600 in the short term.
The first support level is at $3,400, the second support level is at $3,350, and the third support level is at $3,250.
The first resistance level is at $3,600, the second resistance level is at $3,700, and the third resistance level is at $3,850.
For long positions, it is recommended to build a heavy position if it stabilizes around $3,500, with a stop loss at $3,450 and a target of $3,600.
For short positions, if it rebounds to $3,600 and faces pressure without forming an effective breakthrough, it can be shorted to $3,520, with a stop loss at $3,630.
Currently, both Bitcoin and Ethereum are in a phase of oscillation and repair. Bitcoin's short-term focus is on the battle for $115,000, while Ethereum needs to break through $3,550 to confirm the continuation of the rebound. It is recommended to primarily focus on shorting high and longing low, with strict stop losses, and to prioritize the relatively strong opportunities in Ethereum. In the long term, both are still in a bull market cycle, but one should be wary of short-term liquidity risks and policy disturbances.
Due to the timeliness of price points, there may be delays in post reviews; specific operations should still be based on real-time market conditions. The above operational range analysis is for reference only. The cryptocurrency market is highly risky, so please manage your risk well and make cautious decisions when investing. If you are interested in specific indicator analysis or the impact of new market dynamics on prices, feel free to scan the QR code for the public account at the end of the article. You are welcome to visit.

Warm reminder: The content of the above article is original by the author. The advertisements at the end of the article and in the comments section are unrelated to the author, so please be cautious!
免责声明:本文章仅代表作者个人观点,不代表本平台的立场和观点。本文章仅供信息分享,不构成对任何人的任何投资建议。用户与作者之间的任何争议,与本平台无关。如网页中刊载的文章或图片涉及侵权,请提供相关的权利证明和身份证明发送邮件到support@aicoin.com,本平台相关工作人员将会进行核查。


