As DeFi matures and segments into specialized infrastructure layers, Ethena's development trajectory may no longer be an anomaly, but rather a preview of how sustainable, institution-focused protocols operate.
Author: A1 Research
Compiled by: Deep Tide TechFlow
This data-driven report delves into @ethena_labs' recent growth performance while successfully retaining over 70% of its capital.
Due to Ethena's rapid growth over the past week, some of the report's data may not be up to date. Here are the changes since this article was written:
TVL: Increased from $5.88 billion to $7.55 billion (+28.4%)
Market Position: Improved from 17th to 15th among all DeFi
Track Dominance: Market share increased from 68.1% to 70.6%
The Paradox of DeFi Loyalty
In a field known for fleeting hype, rapid turnover, and profit-driven capital, one protocol breaks the mold. While most DeFi platforms lose users at the first sign of volatility, Ethena has quietly built a fortress: retaining 76% of its total locked value (TVL), commanding 68.1% of the entire track, and being the least volatile among all mainstream DeFi protocols.
This article reveals the science of capital retention—exploring how Ethena has transformed from an experimental stablecoin protocol into the first true infrastructure-level financial primitive in DeFi, with resilience, dominance, and sustainability that reflect TradFi systems more than yield farming.
Introducing Ethena: Infrastructure-Level Digital Currency
Ethena is a synthetic dollar protocol built on Ethereum, utilizing an innovative "delta-neutral" basis trading strategy that combines long positions in BTC/ETH spot markets with short positions in BTC/ETH perpetual contracts, creating a dollar stablecoin solution that requires no centralized collateral, providing users with "internet money" in the form of $USDe.
Revenue Mechanism:
Achieving 15% annualized basis arbitrage through shorting perpetual futures (majority of revenue)
Long collateral yield based on ETH at 3%
Stablecoins deployed to liquidity pools can earn a fixed return of 4%
As of July 2025, Ethena's asset allocation is distributed among derivative base trading, staked ETH assets, and liquid stable assets, with specific allocations varying based on market conditions and governance decisions.
Key Points
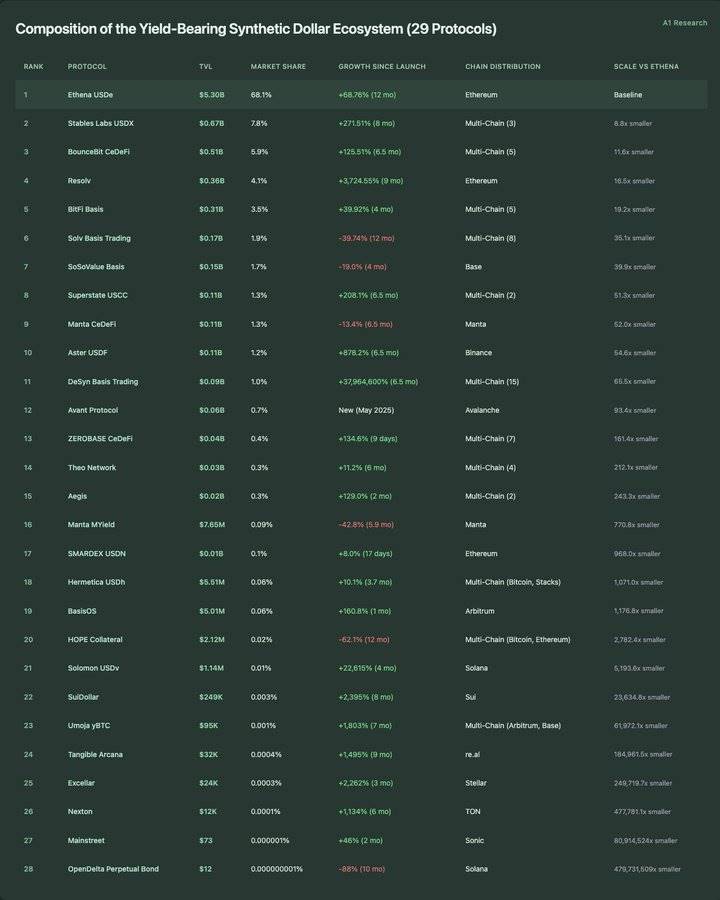
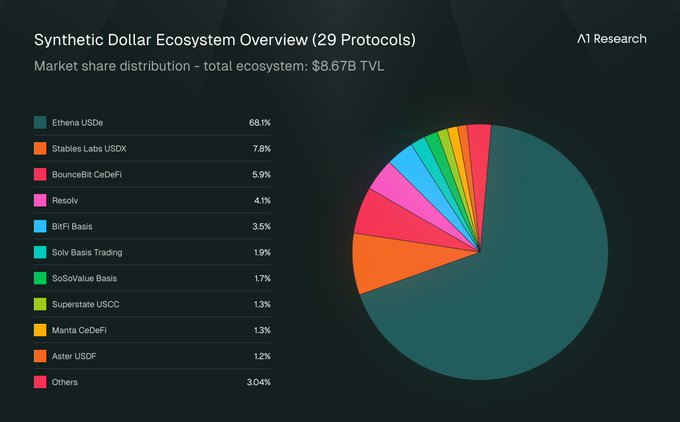
As the infrastructure layer supporting yield-generating synthetic dollars, Ethena occupies 68.1% of the market share within an ecosystem spanning 12 chains and covering 29 protocols. Its total locked value (TVL) reaches $8.71 billion, demonstrating strong capital stickiness and high trust, making it a core pillar in the field.
Ethena exhibits exceptional operational maturity, with a volatility score (based on 90-day daily TVL percentage changes) of only 8.23, significantly lower than the typical range of 15-25 for DeFi protocols. At the same time, the protocol maintains continuous growth, significantly outperforming peer benchmarks, becoming a model of stable growth in the industry.
A1's Core Argument: Ethena embodies the successful ability to create categories, demonstrating resilience under pressure and exceptional operational maturity. It proves how infrastructure protocols can achieve sustainable market leadership through focused financial innovation and excellent risk management.
Pioneering a New Track: Ethena and the Architecture of Synthetic Digital Dollars
Ethena has not only entered a market but defined one. Most DeFi tracks mature slowly, with market share divided among 3-5 existing players.
Ethena's dominance indicates that it has sparked trends in the track rather than merely participating, becoming the standard to which others now refer.
Components of the Yield-Generating Synthetic Dollar Ecosystem (29 Protocols):
Blueprint for DeFi Category Innovation
Ethena Sparks a New Ecosystem
The launch of Ethena has triggered a series of protocol innovations around synthetic, yield-generating dollars, creating a stable value system ecosystem worth $8.67 billion, encompassing 29 protocols across 12 public chains. Data from the past 12 months shows that this is not a gradual market evolution but a result of innovations in infrastructure-level performance.
Maintaining Infrastructure-Level Performance Throughout Market Cycles
Ethena's annual growth rate reaches 68.85%, continuously holding a 68.1% market dominance, reflecting a rare infrastructure-level performance in the DeFi space. The protocol has undergone five different phases, validating its status as a defining infrastructure in DeFi.
Outstanding Recovery: Since the low point in October 2024, Ethena's +132.7% rebound showcases a typical institutional confidence pattern for infrastructure protocols. While most DeFi protocols struggle to maintain momentum during bear markets, Ethena's V-shaped recovery mirrors that of traditional infrastructure assets.
Volatility Management: A volatility score of 8.23 places Ethena within the range of infrastructure-level stability, significantly lower than typical DeFi protocols. While achieving an annual growth rate of 68.85%, it maintains such high stability, indicating that the protocol has achieved a perfect blend of growth and reliability characteristic of infrastructure leaders.
Practical Application of Power Laws
The ecosystem distribution exhibits an extreme power law: 1 protocol valued over $5 billion (Ethena), 1 protocol valued between $500 million and $1 billion, 3 protocols valued between $300 million and $500 million, and 24 protocols valued below $300 million. More striking is the micro-concentration: 13 protocols have a total locked value (TVL) below $10 million, and 6 protocols, despite operating for months, remain valued below $1 million.
Scale Gap: The largest competitor (USDX, market cap $670 million) is 8.8 times smaller than Ethena, while the smallest tracked protocol (OpenDelta, market cap $12) is 479,731,509 times smaller than Ethena. This unprecedented scale distribution indicates that the track has rapidly matured, forming an infrastructure-dominated architecture rather than competitive fragmentation.
Multi-Chain Paradox: Liquidity Depth > Chain Ecosystem Breadth
Among the 28 tracked synthetic dollar protocols, 15 operate cross-chain across 12 blockchain ecosystems, indicating strong demand for multi-network solutions. However, Ethena maintains a model deployed solely on Ethereum, capturing the majority of the track's TVL.
Multi-Chain Efficiency Paradox: @DesynLab Basis Trading operates on 15 blockchains but has a total locked value of only $89 million (65.5 times smaller than Ethena). USDX operates on 3 blockchains with a total locked value of $670 million (8.8 times smaller than Ethena). This challenges the common assumption that "multi-chain expansion drives scale expansion."
Protocol Resilience Practice: Ethena's Performance Under Pressure
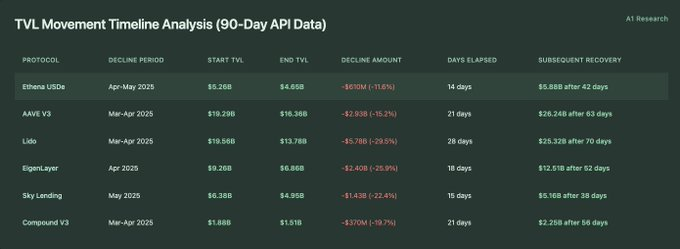
When the tide goes out, the strength of infrastructure is revealed. During two significant pullbacks in 2025 (March and April to May), most DeFi protocols faced severe capital outflows. However, Ethena demonstrated rare resilience: not only successfully retaining funds but also achieving recovery and growth. In contrast, lending markets (like @aave), staking giants (like @LidoFinance), and re-staking leaders (like @eigenlayer) saw significant declines in TVL, making Ethena's performance particularly outstanding.
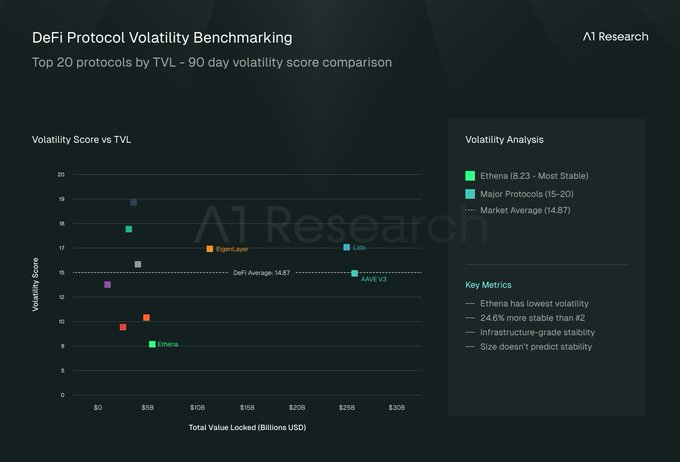
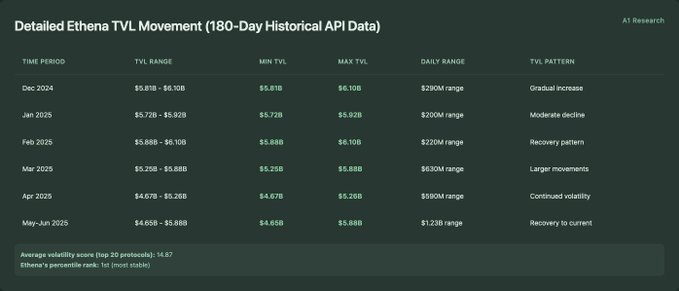
Average Volatility Score (Top 20 Protocols): 14.87
Ethena's Percentile Ranking: 1st (Most Stable)
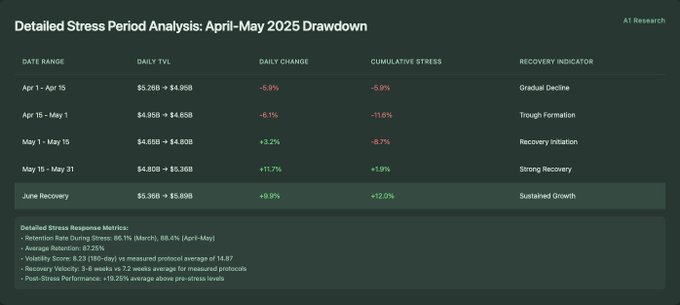
Detailed Stress Response Metrics
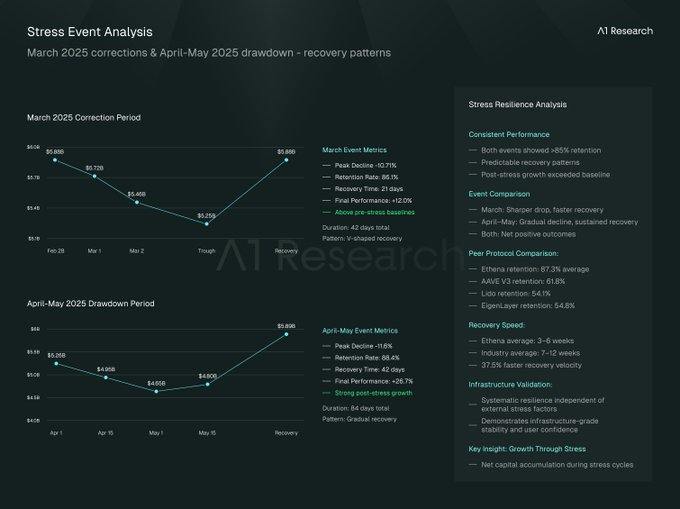
Retention Rate During Stress Periods: 86.1% (March), 88.4% (April-May)
Average Retention Rate: 87.25%
Volatility Score: 8.23 (180 days), while the average of measured protocols is 14.87
Recovery Speed: 3-6 weeks, while the average recovery speed of measured protocols is 7.2 weeks
Post-Stress Performance: On average, 19.25% higher than pre-stress levels
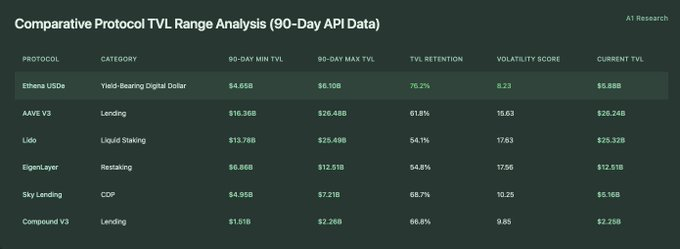
Comparative Protocol TVL Range Analysis (90-Day API Data):
TVL Change Timeline Analysis (90-Day API Data):
Ethena TVL Dynamic Details (180-Day Historical API Data):
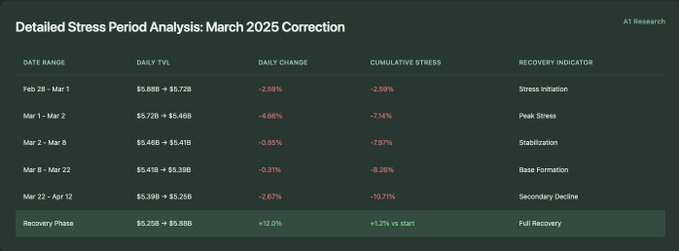
Detailed Stress Period Analysis (Daily TVL Changes):
March 2025 Market Pullback Period:
April to May 2025 Market Withdrawal Period:
How Ethena Surpasses the DeFi Space in Crisis
When market turbulence occurs, most protocols react. A few protocols demonstrate their design. Ethena's performance during recent market stress events has been particularly strong, with data showing its relative retention rate and resilience are superior to other protocols.
Cross-Protocol Performance: Capital Stays Where It's Most Trusted
Ethena's 76.2% TVL retention rate surpasses all measured mainstream DeFi protocols, including AAVE V3 (61.8%), Lido (54.1%), EigenLayer (54.8%), and Sky Lending (68.7%). This gives Ethena a retention rate during stress tests that is 14-22 percentage points higher than its peer sample.
Volatility: The Most Robust Helmsman in the Market
With a volatility score of 8.23, Ethena is the most stable protocol among all 20 tested DeFi protocols. The measured range goes from 8.23 (Ethena) to 19.67 (SparkLend), with Ethena's stability being 24.6% higher than the second-ranked Sky Lending (10.25).
Recovery Speed: Ethena's Strong Rebound
Comparative recovery timeline analysis shows that Ethena's average recovery time during measured events is 3-6 weeks, while other comparison protocols have recovery times of 7-12 weeks (AAVE V3: 8-9 weeks, Lido: 10-12 weeks, EigenLayer: 7-8 weeks). This means that Ethena's recovery speed is significantly improved by 37.5% within the tested protocol sample.
Interpreting Ethena's Stress Response: A Dual Performance of Stability and Growth
In addition to outperforming its peers, Ethena has shown significant internal consistency during two major stress events:
Sustained Resilience: Despite different stress characteristics, Ethena maintained over 85% retention rates during both stress periods (March: 86.1%, April to May: 88.4%), indicating systemic protocol resilience rather than market conditions specific to particular events.
Predictable Recovery: Regardless of the severity of the initial decline, both recovery periods followed a similar 3-6 week timeline, indicating a predictable recovery mechanism unaffected by external pressure factors.
Growth Under Stress: Both recovery periods resulted in TVL levels significantly exceeding pre-stress baselines (March event +12.0%, April to May event +26.7%), indicating net capital accumulation during stress cycles.
Derivatives Market Integration: Examining Ethena's Future Potential
Ethena's role has long transcended the stablecoin category, with its unique model making it an ideal foundational collateral asset for decentralized derivatives platforms. The daily trading volume in this field has now exceeded $13.6 billion, with traders urgently needing low-volatility, yield-generating collateral to meet margin and liquidity pool demands, and Ethena's design perfectly fits this scenario.
Derivatives Market Trading Volume Analysis (Top 20 Protocols):
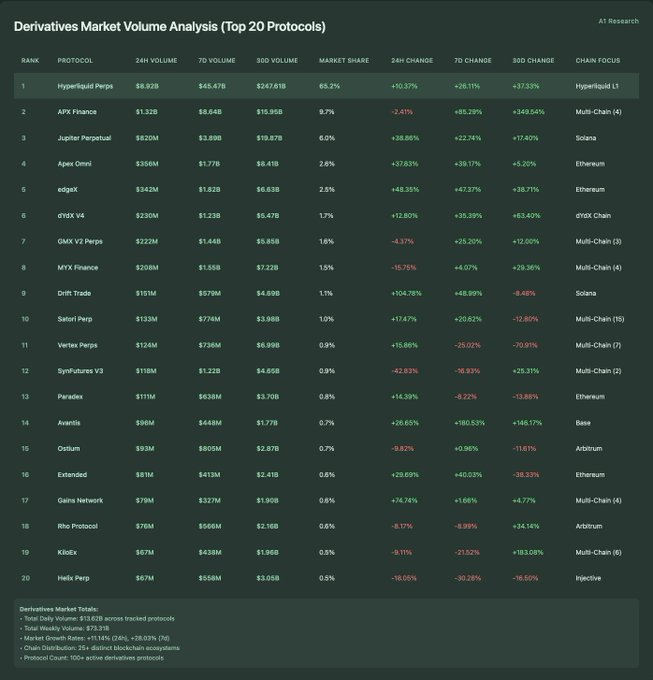
Total Derivatives Market:
Daily Total Trading Volume: $13.62 billion across tracked protocols
Weekly Total Trading Volume: $73.31 billion
Market Growth Rate: +11.14% (24 hours), +28.03% (7 days)
Chain Ecosystem Distribution: 25+ different blockchain ecosystems
Number of Protocols: 100+ active derivatives protocols
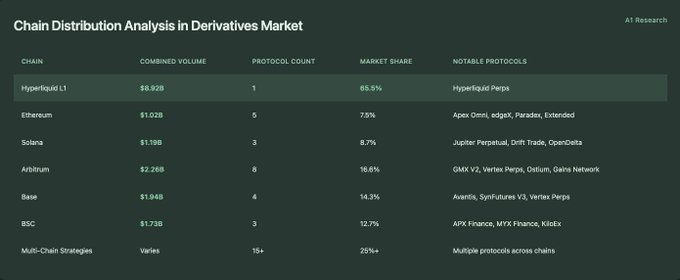
Analysis of Chain Ecosystem Distribution in the Derivatives Market
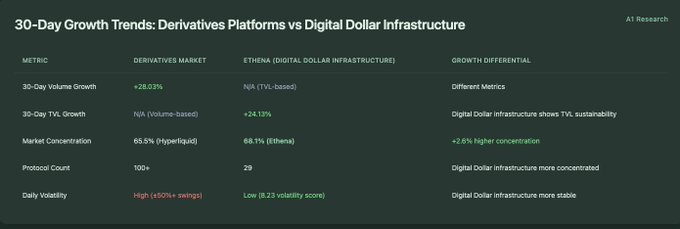
30-Day Growth Trend: Derivatives Platforms vs. Digital Dollar Infrastructure
The Subtle Fit Between Derivatives and DeFi Collateral Infrastructure
The cryptocurrency derivatives market is large, rapidly developing, and expanding quickly. However, beneath its volatility lies a quieter, more stable foundation, increasingly defined by protocols like Ethena. The two dimensions of speed and stability are beginning to reveal a deep structural interdependence.
Scale Determines Success: Rapid Growth Requires Quality Collateral
The decentralized derivatives market has a daily trading volume of $13.62 billion, while Ethena's total locked value (TVL) is $5.88 billion, giving a ratio of 2.3 times. The mathematical relationship indicates that even a 5% increase in derivatives trading volume (approximately $681 million) would mean an 11.6% growth in Ethena's current position. In short, a small amount of quick money requires a large amount of stable collateral.
Analysis of the Centralization Trend in Parallel Markets
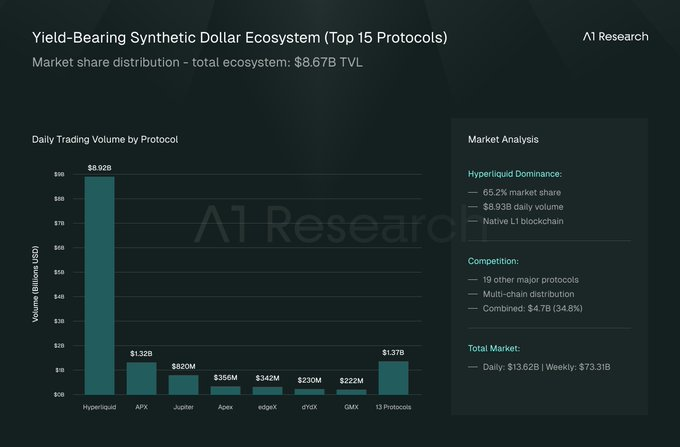
Hyperliquid accounts for 65.5% of decentralized derivatives trading volume, while Ethena holds 68.1% of the TVL in the yield-generating digital dollar ecosystem. The concentration of these two markets is similar (ranging from 65% to 68%), indicating that the market structure patterns of the DeFi track based on trading volume and TVL are alike.
Different Speeds, Different Roles
The weekly growth rate of the derivatives market is 28.03%, while Ethena's monthly growth rate is 24.13%. When standardized by frequency, the growth rate of the derivatives industry is four times that of Ethena, highlighting its faster market circulation speed, while the TVL growth pattern of the synthetic dollar protocol is more stable.
Derivatives protocols exhibit high trading volume turnover and significant daily changes (with volatility generally around ±50% across different protocols), while Ethena shows stability in TVL (with a volatility score of 8.23). This sevenfold difference indicates a complementary market function—high-frequency trading with stable collateral supply.
Same Design, Different Outcomes: The Single-Chain Advantage
Hyperliquid primarily focuses on single-chain trading (65.5% of trades concentrated on Hyperliquid Layer1), but other blockchains also show distributed activity: Ethereum (5 protocols totaling $1.02 billion), Arbitrum (8 protocols totaling $2.26 billion). Multi-chain derivatives trading amounts to $4.76 billion (accounting for 34.8% of market share), involving over 20 protocols.
In the derivatives and synthetic dollar ecosystems, the leading protocols' single-chain dominance indicates that concentrated liquidity often outperforms multi-chain distribution when building foundational market infrastructure.
Competitive Positioning: Ethena vs. Infrastructure Giants
As DeFi expands, competition in most verticals intensifies. Notably, Ethena is the only synthetic dollar protocol among the top 50 in DeFi, reflecting not only its current market leadership but also its emerging structural defensive capabilities.
DeFi Infrastructure Top 50 Competitive Analysis
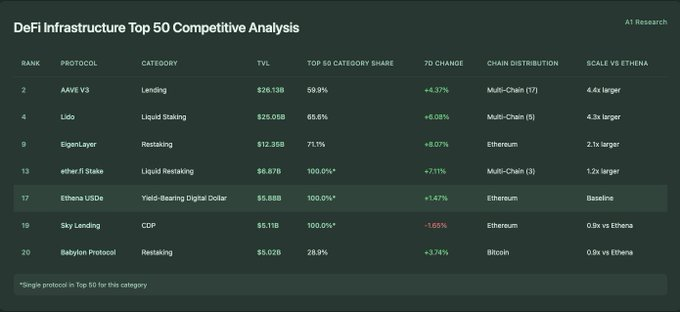
*Single Protocols Ranked in the Top 50 of This Track
Lending Track Competitive Analysis (Top 15)
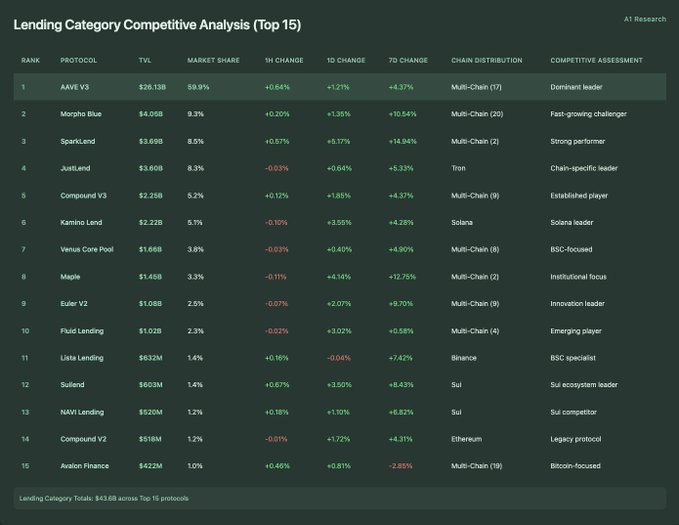
Total Lending Track: The top 15 protocols total $43.6 billion
Complete Liquidity Staking Track Competitive Analysis (Top 10)
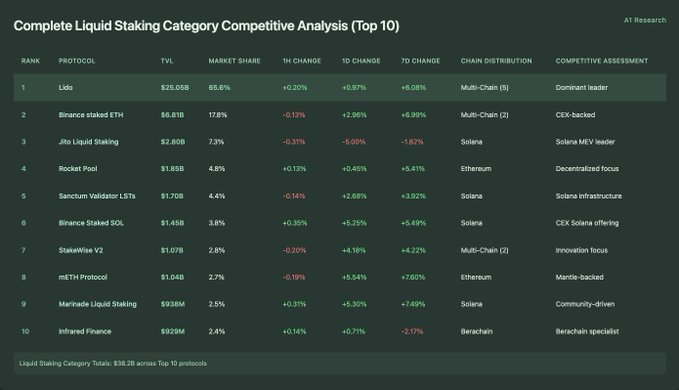
Liquidity Staking Track Total: The top 10 protocols total $38.2 billion
Competitive Scale Discrepancy Analysis
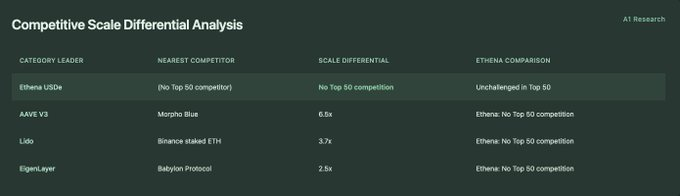
When One Protocol Dominates the Entire Track: Ethena's Structural Advantage
In most DeFi fields, protocols compete for incremental shares within established tracks. However, in rare cases, one protocol emerges early, establishes standards, and maintains dominance as the industry matures. Ethena is one of those cases.
Top-Level Synthetic Dollar: A Unique Existence
In the top 50 major DeFi tracks, market share concentration ranges from 58.0% (Uniswap V3 in DEX) to 100.0% for a single protocol representing a track. In the synthetic dollar track, Ethena occupies 100% of the top 50, highlighting the lack of comparable competitors at this scale.
System-Level Ranking Context
Ethena ranks 17th overall among DeFi protocols (excluding centralized exchanges) and is in the top 3% of all tracked protocols. Currently, its total value locked (TVL) ranks 17th, positioned between Bitget (16th, $6.02 billion) and BitMEX (18th, $5.54 billion).
Competitive Structure: Centralization vs. Decentralization
Ethena is the only synthetic dollar protocol among the top 50 in DeFi. This stands in stark contrast to the following tracks:
Lending: 7 protocols
Liquid Staking: 5 protocols
Re-staking: 2 protocols
Decentralized Exchanges: 2 protocols
This asymmetry reflects deeper structural dynamics: synthetic dollar protocols tend to concentrate on a single dominant infrastructure, while other verticals exhibit greater decentralization.
Growth Profile: Stability Over Acceleration
Among the leading categories in the top 50, the recent weekly growth rates are as follows:
EigenLayer: +8.07%
ether.fi: +7.11%
Lido: +6.08%
AAVE V3: +4.37%
Babylon: +3.74%
Ethena: +1.47%
Ethena's lower short-term growth reflects a more mature and stable adoption curve, aligning with infrastructure behavior rather than early protocol dynamics.
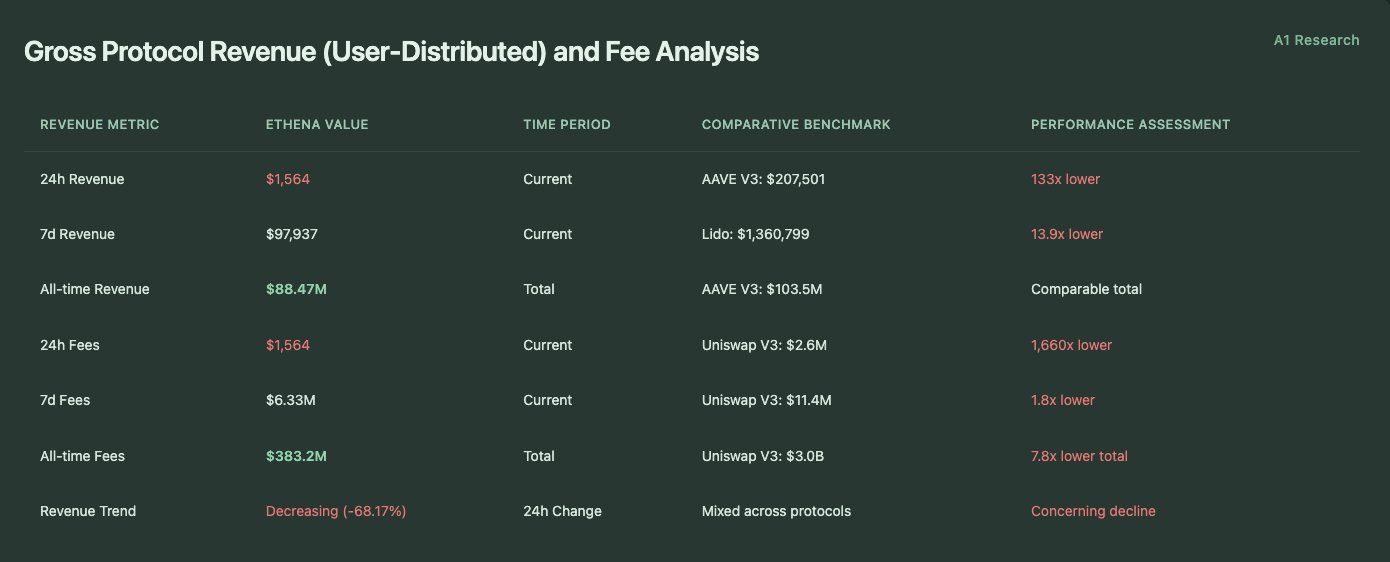
Utility Over Mining: Ethena's Infrastructure-First Economic Model
Since its launch, Ethena has accumulated over $400 million in protocol revenue, placing it among the highest-earning protocols in DeFi. However, unlike many protocols, Ethena does not use this revenue to expand its own funds. Instead, nearly 100% of the protocol revenue is distributed to USDe holders in the form of yields.
Total Protocol Revenue (User Distribution) and Fee Analysis
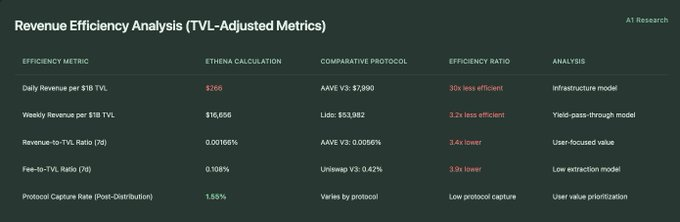
Revenue Efficiency Analysis (TVL Adjusted Metrics)
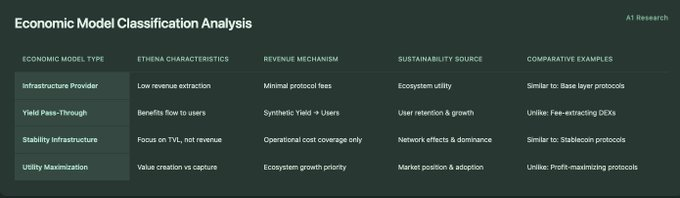
Economic Model Classification Analysis
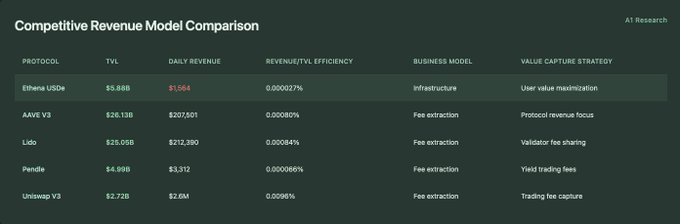
Competitive Revenue Model Comparison
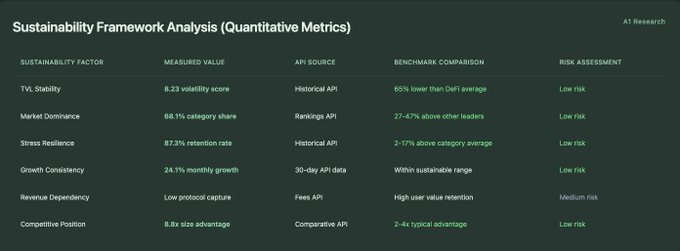
Sustainability Framework Analysis (Quantitative Metrics)
Rethinking Protocol Value: Ethena's Infrastructure-Dominant Economic Model
While many DeFi protocols are built around transaction-based yield extraction, Ethena operates on a fundamentally different premise: infrastructure utility takes precedence over protocol profitability. Its economic model prioritizes user value creation and market functionality over short-term profits.
Infrastructure and Revenue: Deliberately Low Profitability
Ethena's operational model is infrastructure rather than a profit-driven protocol. The protocol's TVL is $5.88 billion, with daily earnings of $1,564, resulting in a revenue efficiency of only 0.000027%. This fundamentally differs from fee-centric protocols like Uniswap V3 (efficiency of 0.0096%) or AAVE V3 (efficiency of 0.00080%). This model indicates a clear priority: maximizing user utility rather than protocol revenue.
Yield Transmission: A Core Feature of Design
Ethena's low yield retention rate (1.55%) indicates that the yields generated by the system primarily flow to USDe holders rather than being captured by the protocol treasury. This structure aligns closely with the stablecoin infrastructure model, where economic value is transmitted to users rather than accumulated by the protocol.
Sustainability Rooted in Market Role
Unlike protocols that rely on fee generation to maintain sustainability, Ethena's durability seems rooted in its ecosystem role and infrastructure value. Key performance indicators support this:
68.1% market share
8.23 volatility score
87.3% stress retention rate
These metrics suggest that the protocol's competitive advantage stems from its market positioning rather than fee flows.
The Illusion of Efficiency: How Yield Distribution Becomes a User Retention Engine
At first glance, measuring yield per $1 billion TVL, Ethena's "yield efficiency" appears to be 3-30 times lower than mainstream DeFi protocols. However, this is a misleading signal. Ethena's low protocol capture rate is not due to poor revenue generation; the protocol has generated over $400 million in total revenue. Instead, its yield transmission design almost entirely allocates yields directly to USDe holders.
This architecture prioritizes user consistency over protocol profit, sacrificing short-term gains for long-term capital stickiness and system integration. The result is strong defensiveness: high user trust, low user churn, and robust TVL elasticity.
Revenue Resistance and the Cost of Market Dominance
Despite its clear positioning, inherent risks remain. A daily revenue change of -68.17% highlights the volatility of revenue sources, which could pose sustainability challenges if operating costs begin to exceed protocol revenue. Since revenue is primarily driven by financing rates in the perpetual contract market, a shift to bearish mechanisms could compress financing spreads and further reduce protocol-level yields.
However, Ethena's role as an infrastructure layer has deep-rooted usability, suggesting that as long as ecosystem value continues to expand, it may remain viable without high revenue dependence.
Conclusion: Infrastructure, Goals, and Long-Term Layout
Ethena currently embodies its consistent and thoughtful design philosophy across various metrics (track creation, stress resilience, ecosystem integration, structural positioning, and economic model): not merely as a product but as the infrastructure of the DeFi ecosystem.
Ethena does not pursue maximization of protocol-level revenue but prioritizes capital stability, user value retention, and ecosystem coordination. This enables it to build trust and scale, not through aggressive mining or rapid multi-chain expansion, but by establishing itself as a core building block in specific market domains.
Infrastructure Blueprint
Ethena successfully showcases the blueprint for creating a DeFi track:
Achieving infrastructure-level scale and reliability early on—68.1% market share, 8.23 volatility score
Maintaining dominance throughout market cycles—76.2% TVL retention during significant stress events
Defining operational standards for the entire sub-market rather than competing within a single sub-market
Key Performance Validation
Track Creation Success: Ethena has triggered the emergence of 29 protocols from the ecosystem; despite 28 new entrants achieving over 1,000% growth rates, it has maintained a 68.1% dominance.
Institutional Model: V-shaped recovery (up 132.7% from the October low), infrastructure-level stability, and sustained market leadership reflect traditional infrastructure assets rather than typical DeFi volatility patterns.
Network Effects: Single-chain Ethereum deployment outperforms multi-chain competitors, indicating that liquidity concentration is superior to the geographical distribution of infrastructure protocols.
Model's Far-Reaching Impact
Ethena's development trajectory provides useful reference points for how infrastructure protocols can succeed in DeFi:
Not by controlling every metric, but by selecting metrics that are important to their functionality
Not through broad competition, but by becoming indispensable in narrow, strategically important verticals
Not through extraction, but through maximizing utility and coordinating user value
As DeFi matures and segments into specialized infrastructure layers, Ethena's development trajectory may no longer be an anomaly but rather a preview of how sustainable, institution-oriented protocols operate.
The protocol's success indicates that some verticals, particularly those serving as financial infrastructure, may naturally lean towards winner-takes-all outcomes, which will have long-term implications for the evolving market structure of DeFi.
This article is for informational purposes only and does not constitute financial, investment, legal, or tax advice. The views expressed herein are those of A1 Research at the time of publication and are subject to change without notice. Nothing in this article should be construed as a recommendation to buy, sell, or hold any asset. A1 Research does not guarantee the accuracy or completeness of the information contained herein. Please conduct your own due diligence and consult a licensed financial advisor before making any investment decisions. This article is not financial advice.
免责声明:本文章仅代表作者个人观点,不代表本平台的立场和观点。本文章仅供信息分享,不构成对任何人的任何投资建议。用户与作者之间的任何争议,与本平台无关。如网页中刊载的文章或图片涉及侵权,请提供相关的权利证明和身份证明发送邮件到support@aicoin.com,本平台相关工作人员将会进行核查。


