Ethereum Technical Analysis: Bullish Structure Intact—If $3,600 Support Survives

CN
7 hours ago

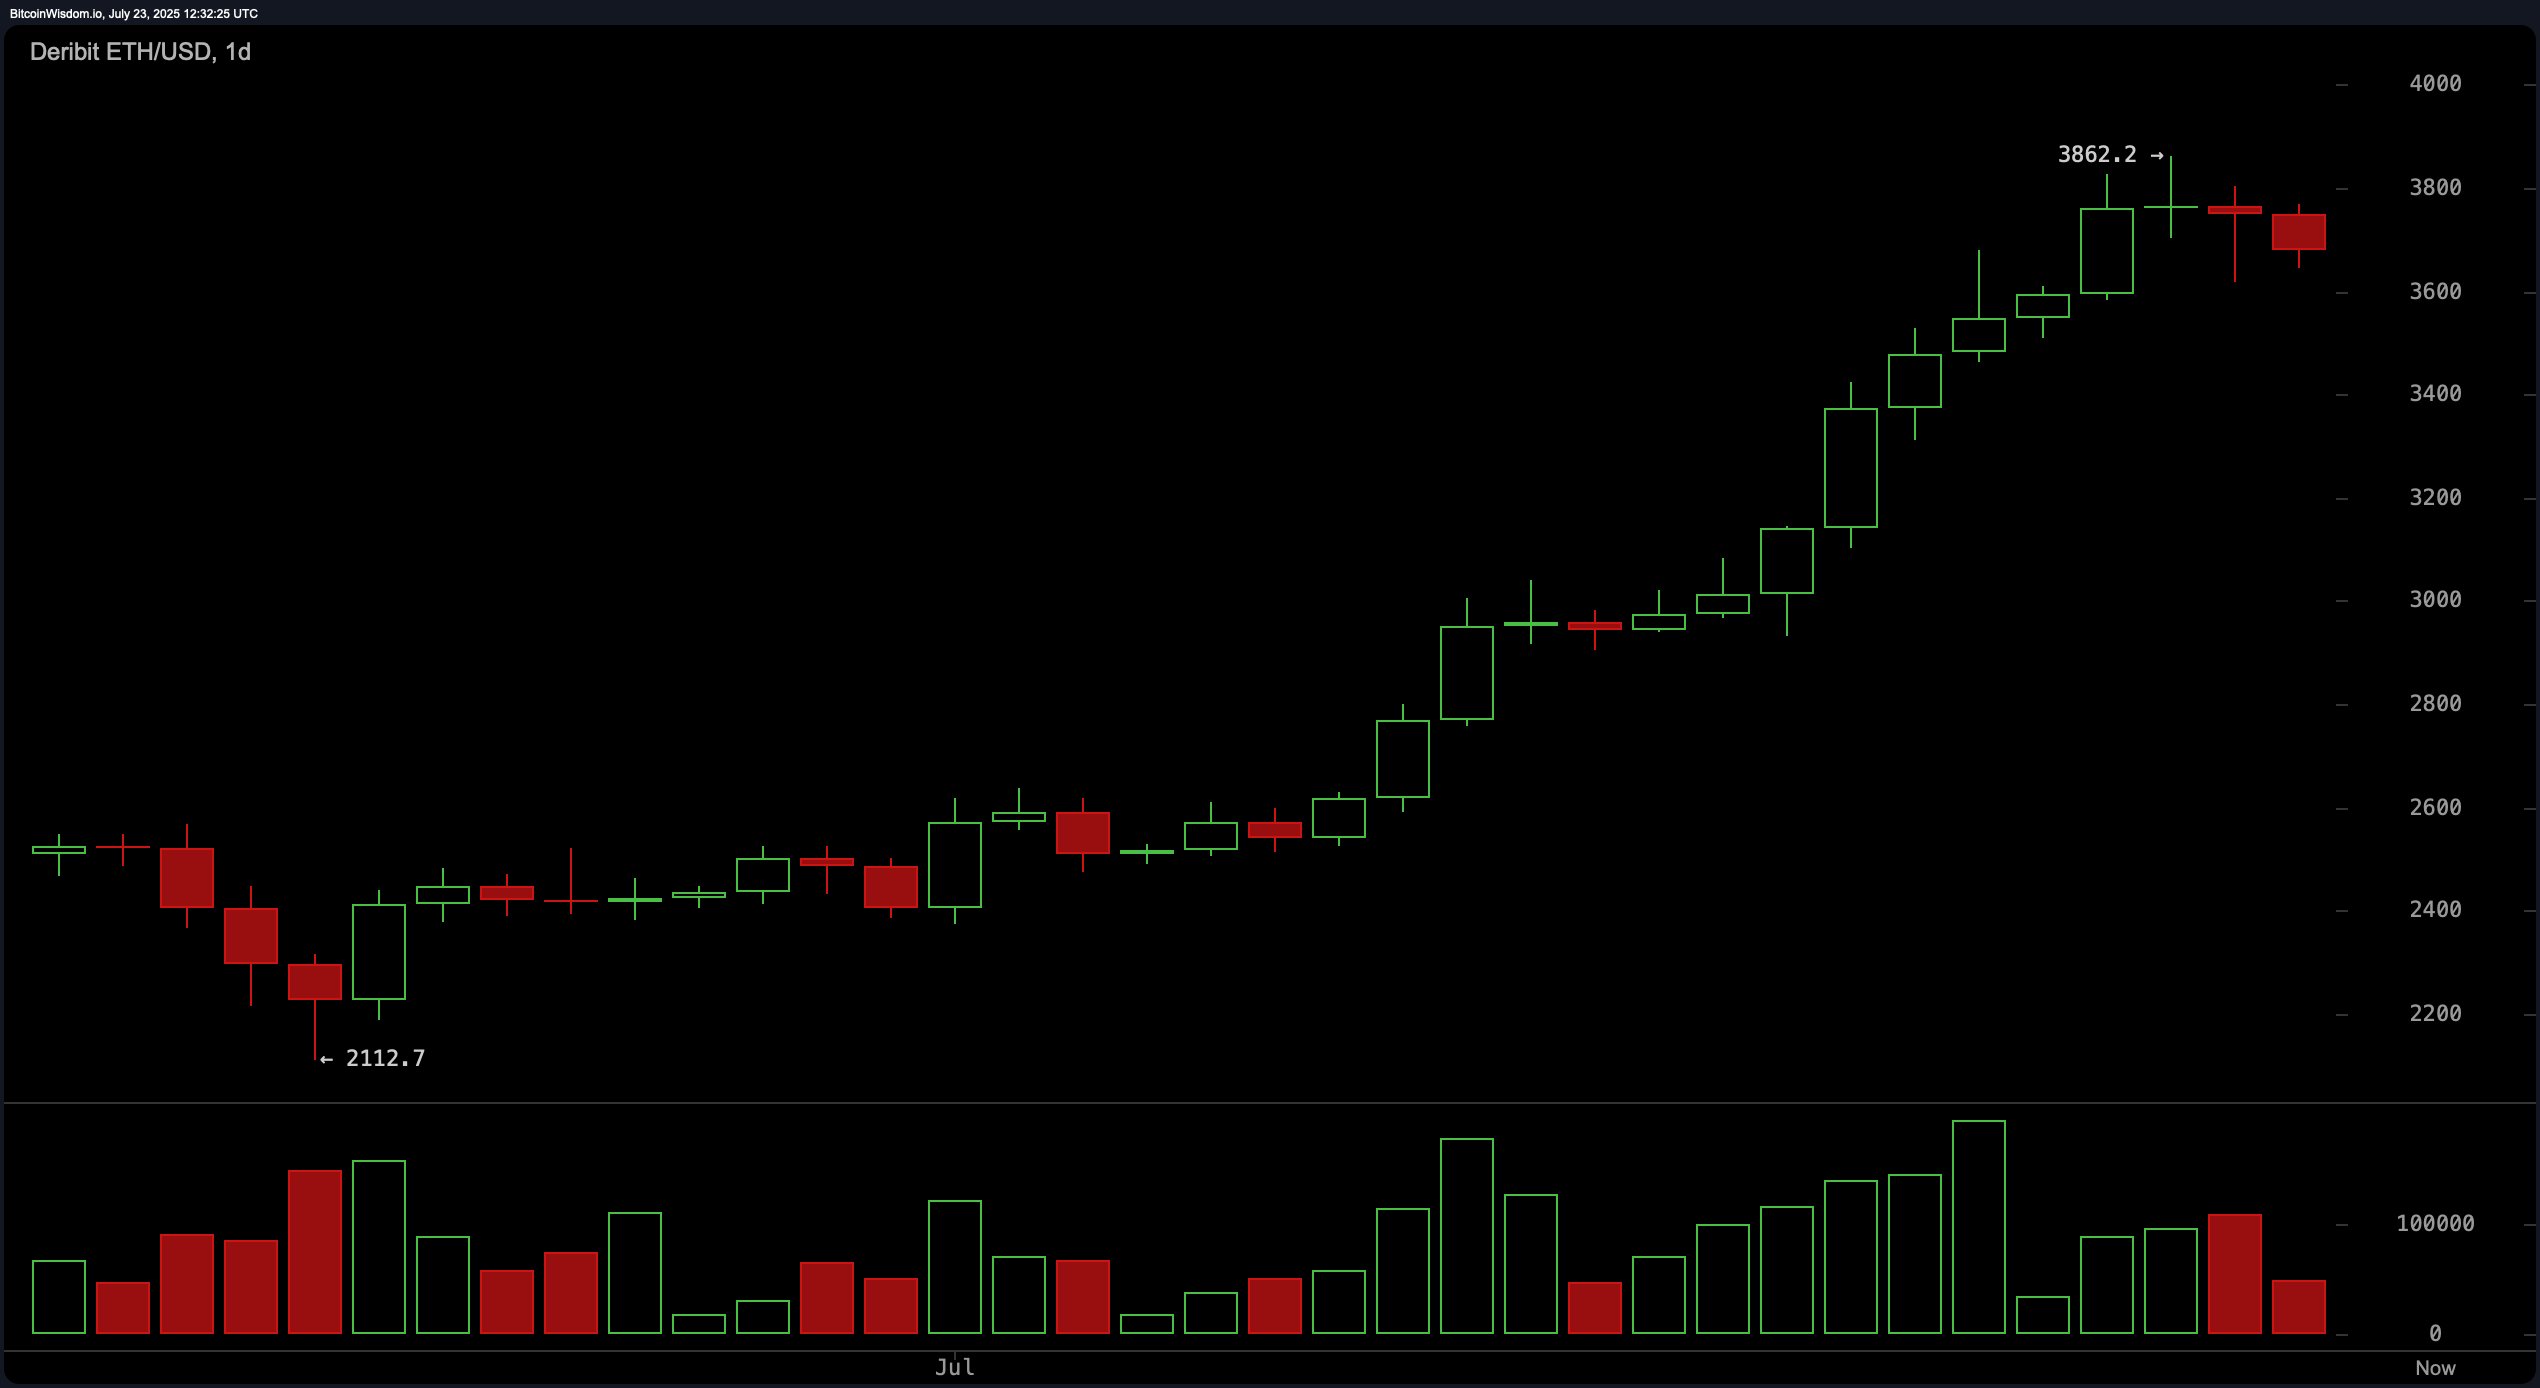
From a long-term perspective, the daily chart reveals ether remains in a strong uptrend after rallying from approximately $2,112 to a peak of $3,862. Recent price action, however, shows early signs of correction, with the last two daily candles turning bearish and exhibiting diminishing volume—signaling weakening bullish momentum. The support area is forming around the $3,600 level, where traders may monitor for bullish confirmation. Resistance remains firm near the $3,800 to $3,860 zone, previously marked by heightened buying pressure.

Ethereum Technical Analysis: Bullish Structure Intact—If $3,600 Support Survives

ETH/USD Deribit on July 23, 2025, 1-day chart.

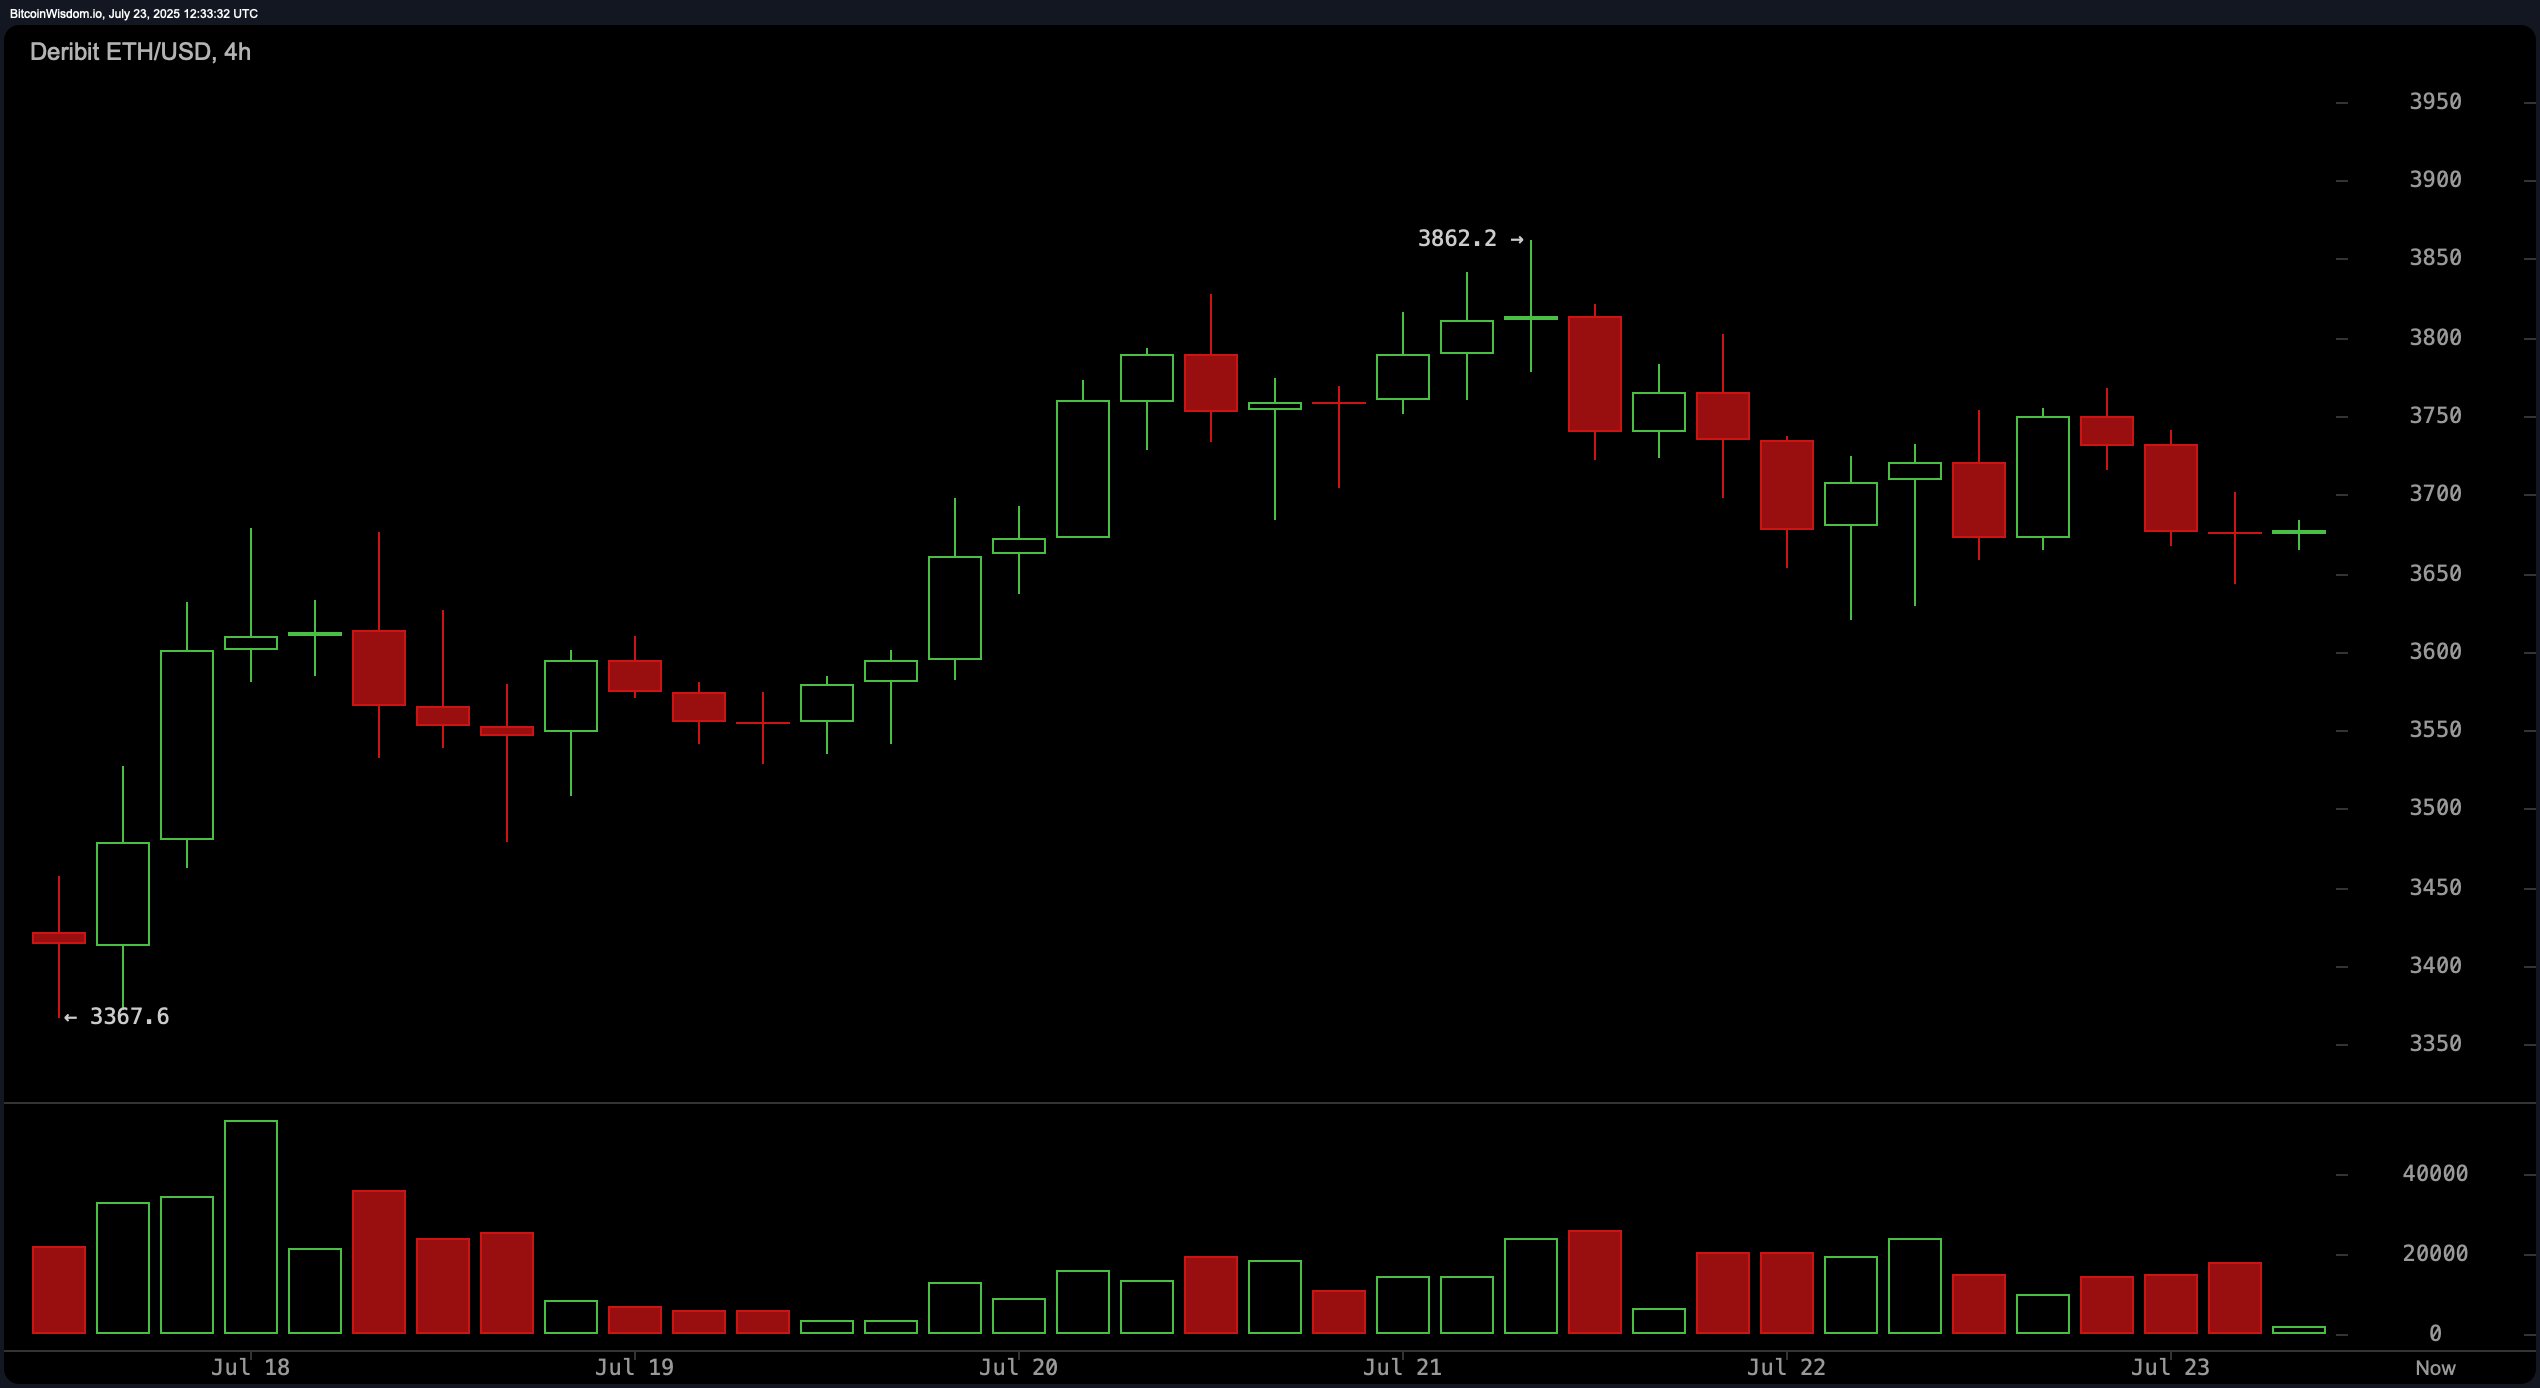
The 4-hour chart confirms a mid-term corrective trend. Ethereum has retreated from its recent high of $3,862, failing to sustain upward momentum. The price currently consolidates between $3,650 and $3,750 with lower highs and a declining volume profile, indicating increased short-term bearish sentiment. If ethereum fails to reclaim the $3,750 level with conviction, the bearish correction could extend further. Conversely, a rebound from the $3,600 support or a strong breakout above $3,750 could invite renewed buying interest.

Ethereum Technical Analysis: Bullish Structure Intact—If $3,600 Support Survives

ETH/USD Deribit on July 23, 2025, 4-hour chart.

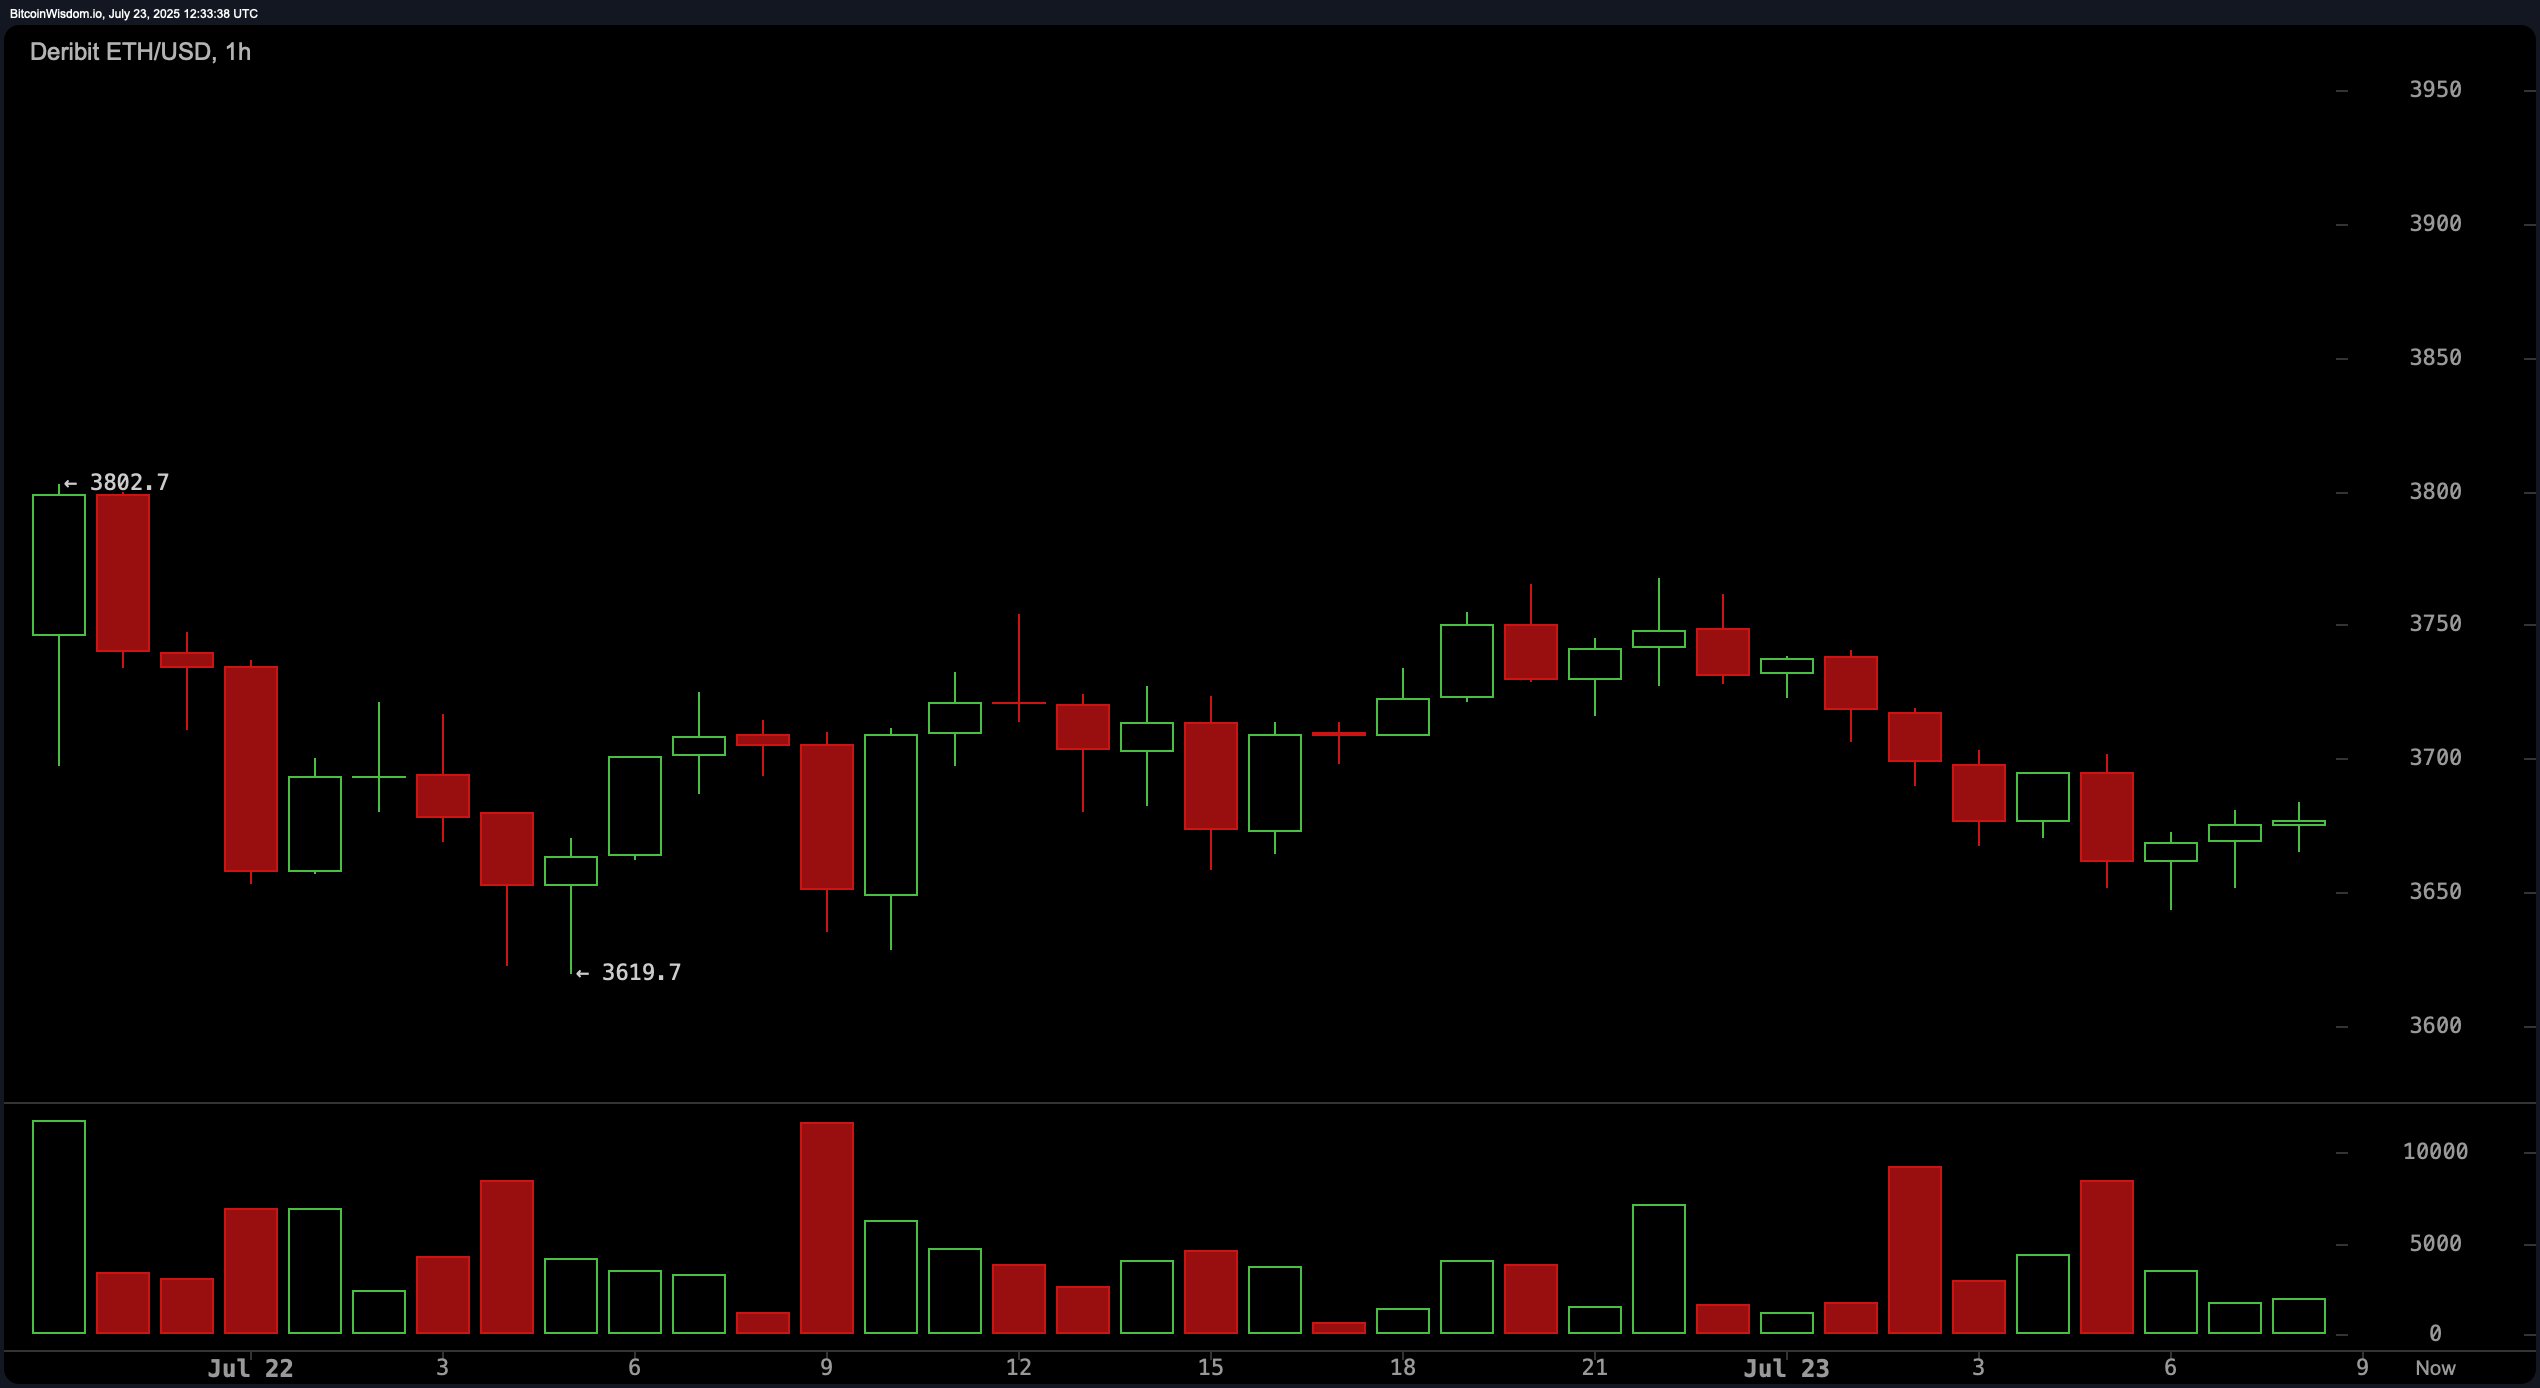
In the short-term view, as seen on the 1-hour chart, ethereum displays a sideways-to-bearish structure. A sharp sell-off from the $3,802 level led to a choppy and indecisive recovery. The price remains capped below $3,700, with small-bodied candles and subdued trading volume suggesting market hesitation. For intraday traders, maintaining support around $3,670 to $3,680 is crucial; failure to hold could trigger further downside toward $3,640 or lower. Resistance remains near $3,730 to $3,750, where sellers are likely to remain active.

Ethereum Technical Analysis: Bullish Structure Intact—If $3,600 Support Survives

ETH/USD Deribit on July 23, 2025, 1-hour chart.

Oscillator readings paint a mixed picture. The relative strength index (RSI) at 80.0 and Stochastic at 89.2 both signal overbought conditions and suggest a potential for short-term pullbacks. The momentum indicator at 703.3 supports this bearish outlook, while the moving average convergence divergence (MACD) at 312.5 offers a contrasting bullish signal. The commodity channel index (CCI) at 99.7 and average directional index (ADX) at 47.0 indicate a trend in progress but show no immediate bias. The Awesome oscillator remains neutral at 869.5, reinforcing short-term indecision.

Moving averages (MAs) provide a clearer long-term bullish structure. All exponential and simple moving averages—ranging from 10-period to 200-period—register positive signals, reflecting strong underlying momentum. The 10-period exponential moving average (EMA) at $3,507.7 and 10-period simple moving average (SMA) at $3,509.8 confirm bullish short-term alignment. Even the 200-period SMA, well below at $2,480.9, confirms a structurally intact uptrend. Unless the price breaks below $3,600 with high volume, ethereum appears to be in a healthy consolidation phase within a larger bullish trajectory.

Bull Verdict:

Ethereum’s broader trend remains decisively bullish, supported by a strong foundation across all major moving averages and a series of higher lows on longer timeframes. As long as the $3,600 support zone holds, and momentum indicators such as the moving average convergence divergence (MACD) and moving averages maintain upward bias, the likelihood of a continuation toward the $3,800–$3,860 resistance range—and potentially new highs—remains intact.

Bear Verdict:

Despite ethereum’s longer-term strength, the current overbought conditions indicated by the relative strength index (RSI) and stochastic %K, combined with bearish momentum and reduced trading volume, signal vulnerability to a deeper pullback. A confirmed breakdown below $3,600 with strong sell volume could trigger downside toward $3,400–$3,300, shifting short- to mid-term sentiment in favor of the bears.

免责声明:本文章仅代表作者个人观点,不代表本平台的立场和观点。本文章仅供信息分享,不构成对任何人的任何投资建议。用户与作者之间的任何争议,与本平台无关。如网页中刊载的文章或图片涉及侵权,请提供相关的权利证明和身份证明发送邮件到support@aicoin.com,本平台相关工作人员将会进行核查。

上新快、福利猛!注册BitMart即享14,000+ USDT迎新奖!
Ad
Share To
APP

X

Telegram

Facebook

Reddit

CopyLink