Bitcoin Price Watch: Support and Resistance Narrow—Breakout Imminent?

CN
7 hours ago

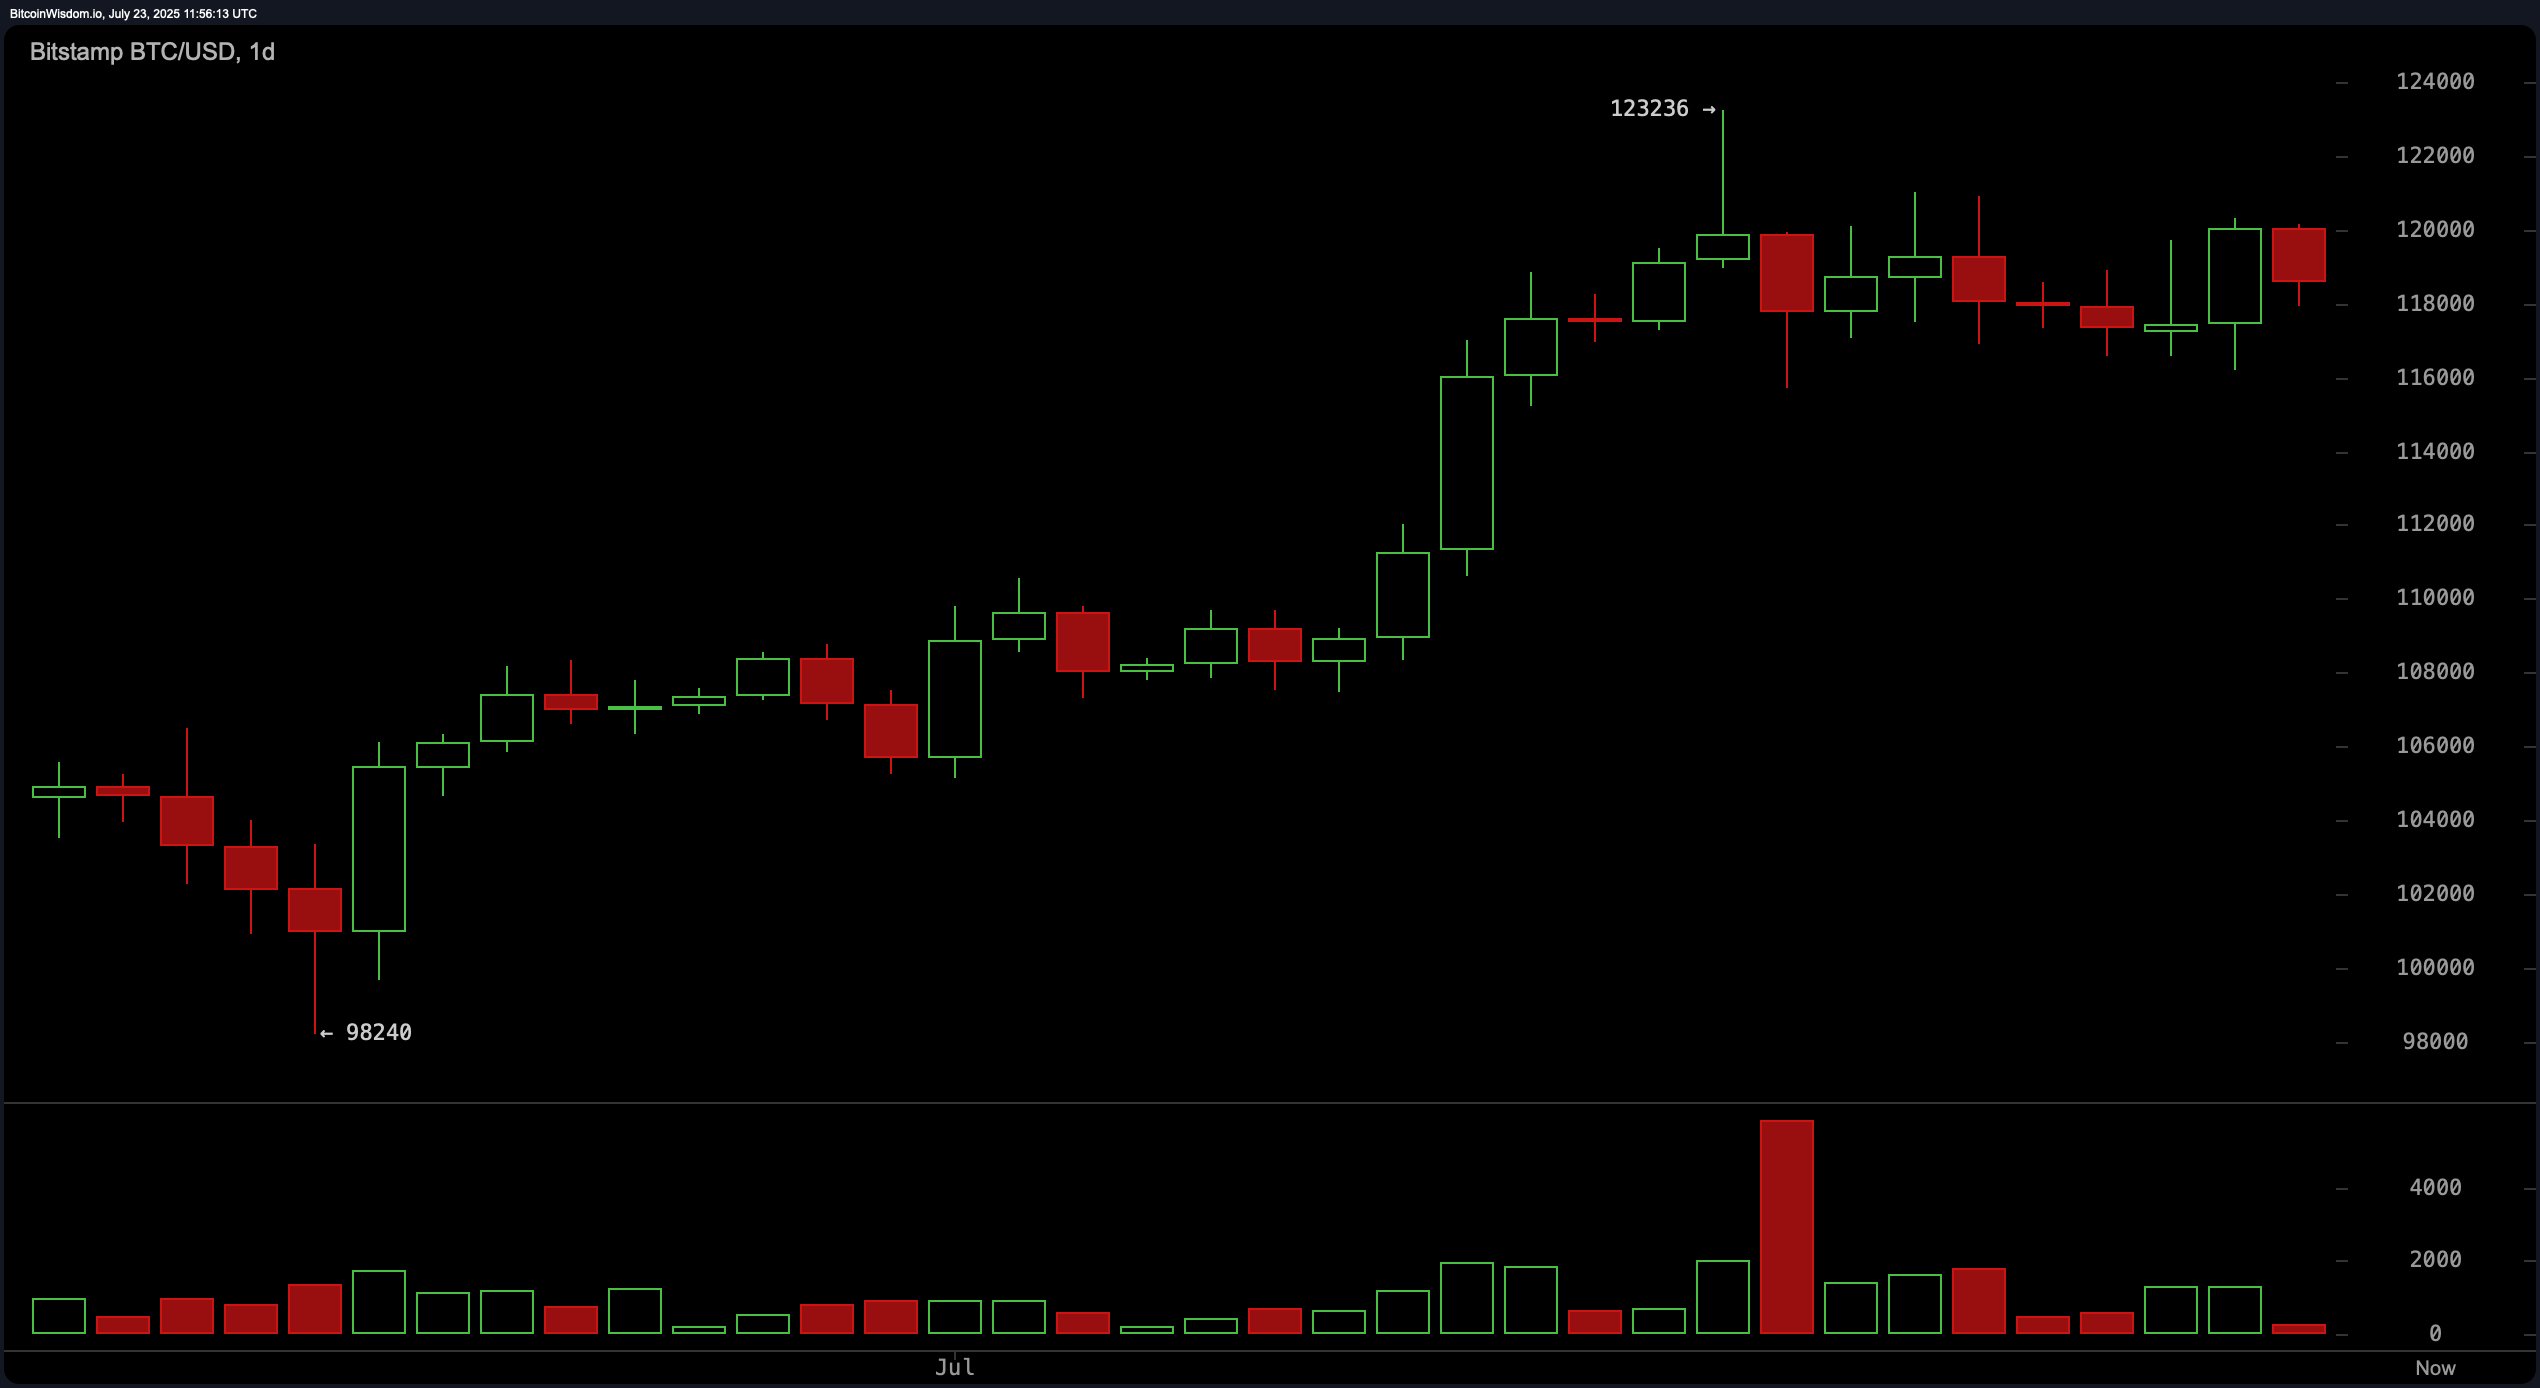
The daily chart reveals bitcoin has remained in a sustained uptrend since bottoming near $98,240. Although it peaked at $123,236, recent consolidation between $117,000 and $121,000 suggests the market may be pausing for breath. A surge in bullish volume just before the peak hints at potential trend exhaustion, and price action hovering near support at $117,000–$118,000 could offer a buy-the-dip opportunity, assuming volume holds. Technical sentiment remains bullish, yet cautious as traders await confirmation for either a breakout or a deeper retracement.

Bitcoin Price Watch: Support and Resistance Narrow—Breakout Imminent?

BTC/USD 1-day chart via Bitstamp on July 23, 2025.

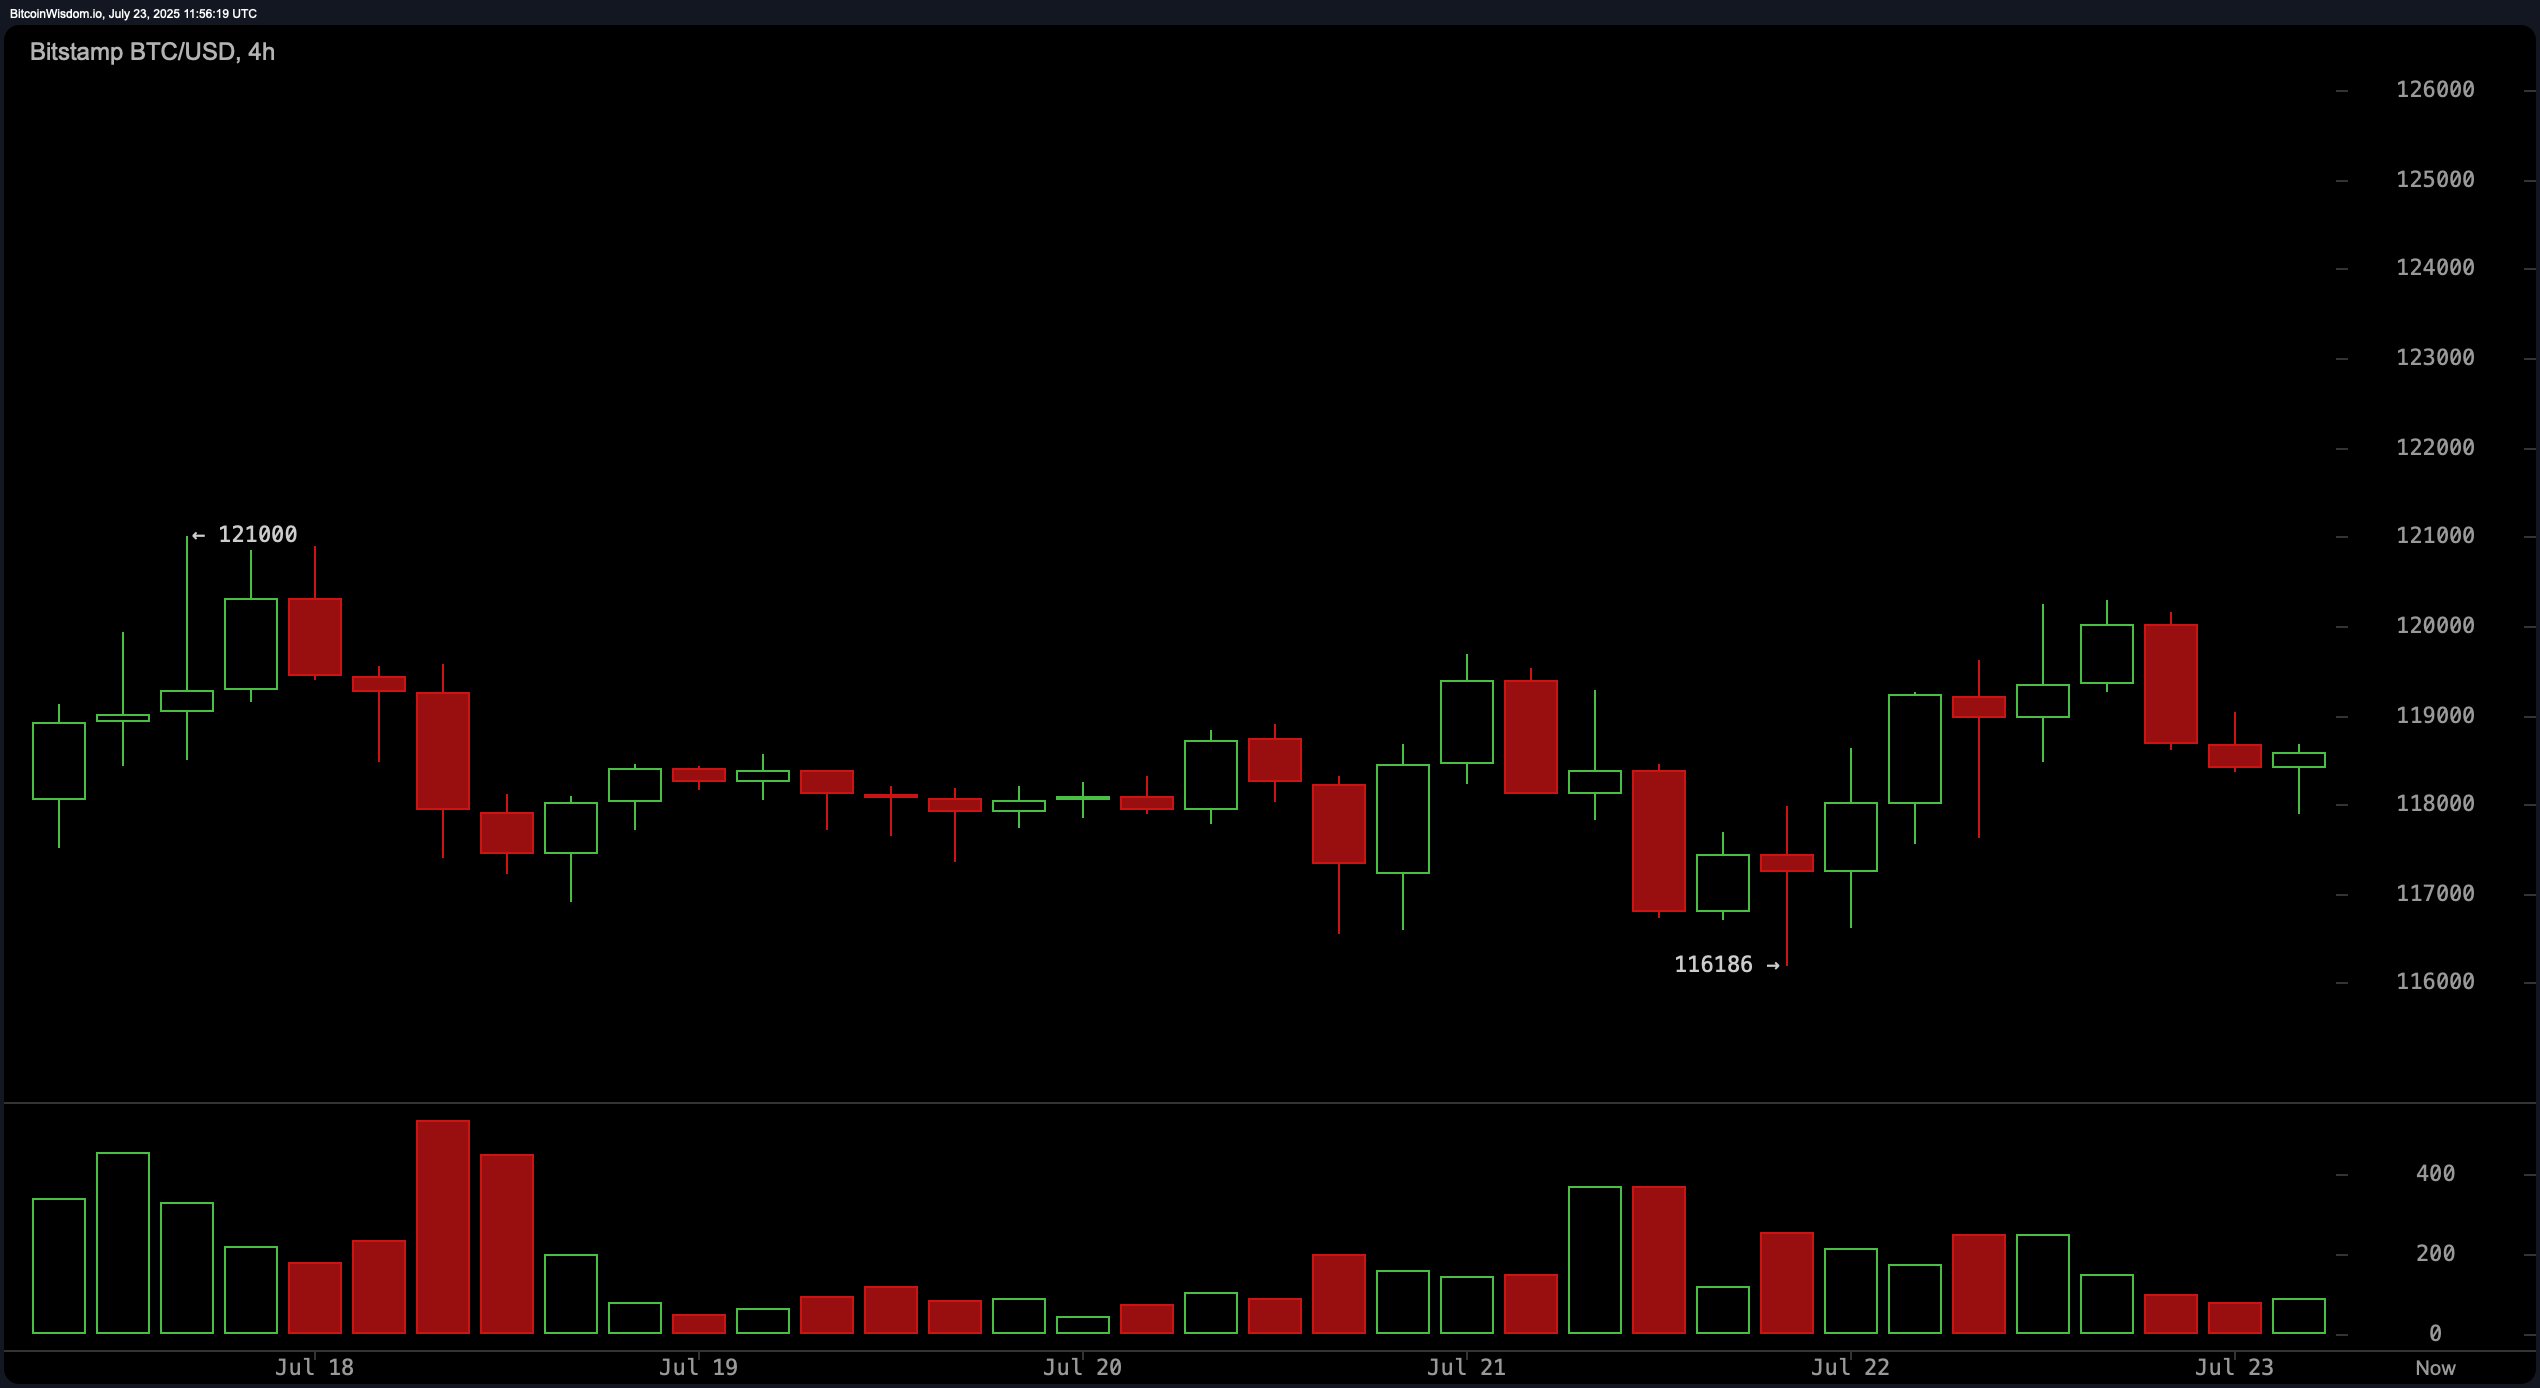
On the 4-hour chart, bitcoin recently faced rejection at $121,000, subsequently retracing to $116,186 before staging a bounce. However, the pattern of lower highs reflects weakening bullish momentum, indicative of a potential distribution phase. Should the $116,000–$117,000 zone hold during another retest, this could spark short-term buying, though confirmation via volume and bullish candle formations is essential. In this timeframe, sentiment skews neutral to bearish unless price reclaims higher levels with conviction.

Bitcoin Price Watch: Support and Resistance Narrow—Breakout Imminent?

BTC/USD 4-hour chart via Bitstamp on July 23, 2025.

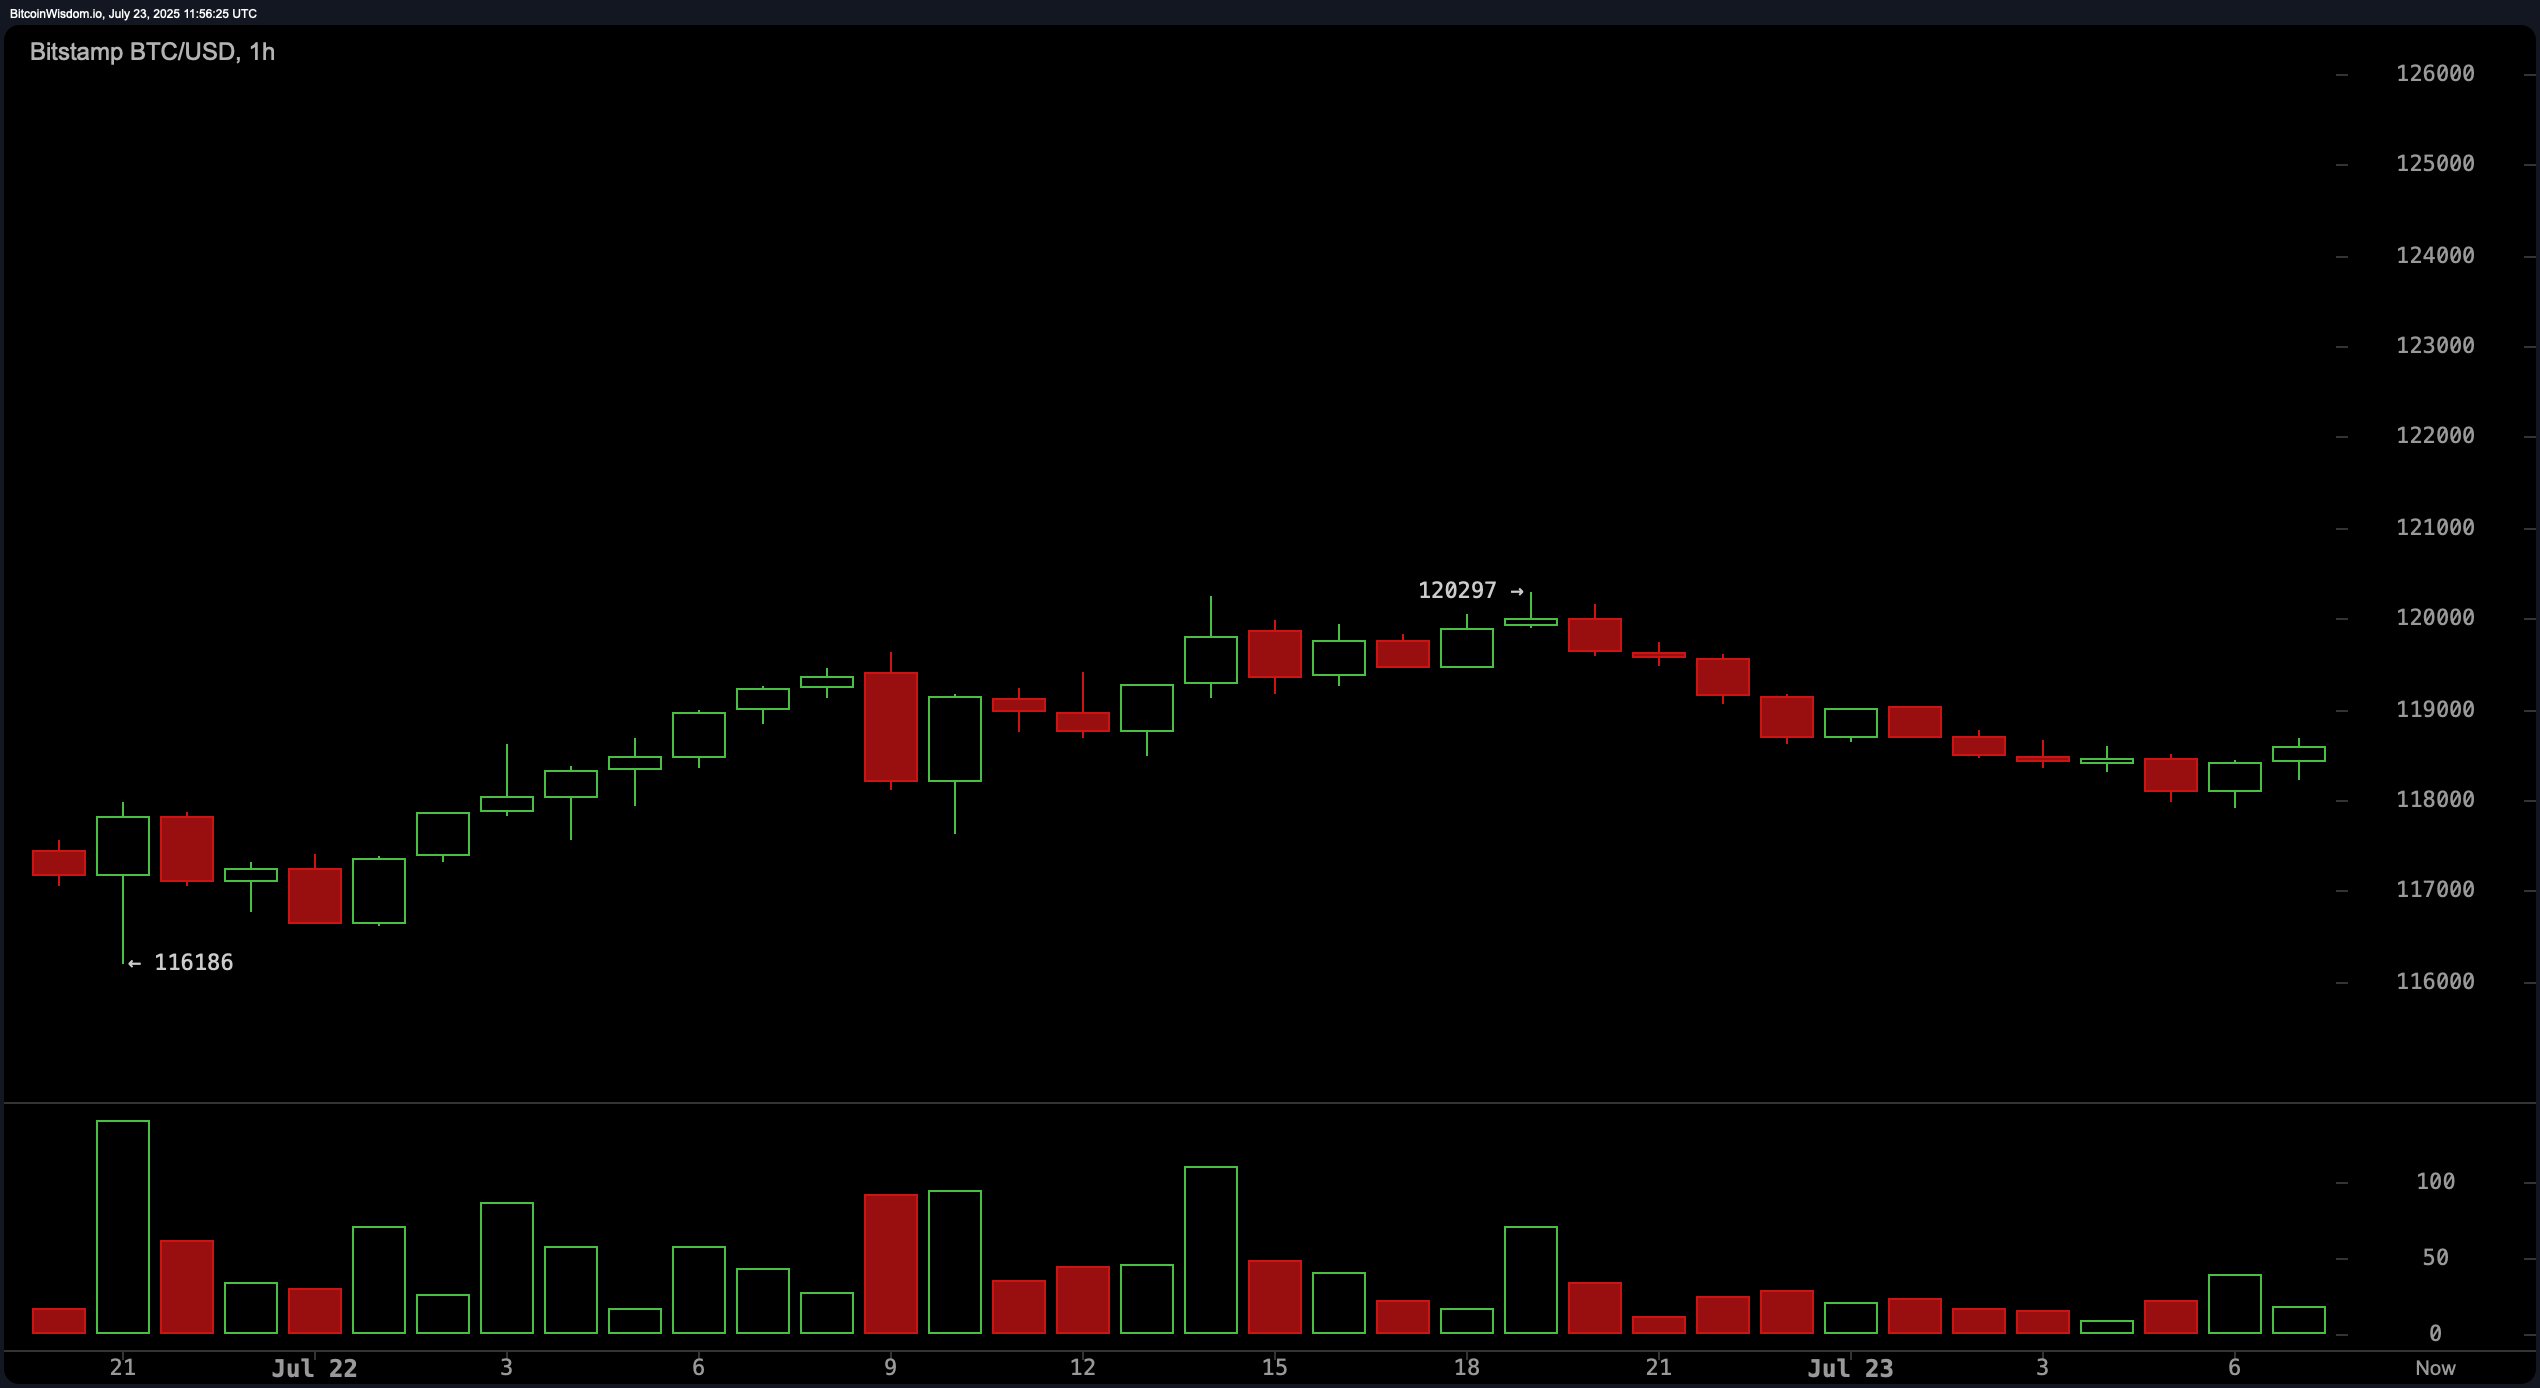
Zooming into the hourly chart, the picture tilts bearish. After a strong rally toward $120,297, bitcoin has entered a sequence of lower highs and lows. This descending pattern underlines short-term selling pressure, with minor support near $118,000 acting as a pivotal level. Intraday traders may look for quick rebounds from this area, keeping stops tight below $117,800. Resistance near $119,500–$120,000 remains a logical target unless momentum shifts.

Bitcoin Price Watch: Support and Resistance Narrow—Breakout Imminent?

BTC/USD 1-hour chart via Bitstamp on July 23, 2025.

From an indicator perspective, oscillators largely reflect indecision. The relative strength index (RSI) at 63, Stochastic at 68, commodity channel index (CCI) at 59, average directional index (ADX) at 29, and Awesome oscillator at 6,739 all present neutral signals. The momentum indicator, however, registers a reading of −556, issuing a bearish warning. The moving average convergence divergence (MACD) level stands at 2,853, also suggesting negativity, reinforcing caution in the short term.

Despite near-term headwinds, bitcoin maintains a favorable structure in its moving averages. All major exponential moving averages (EMA) and simple moving averages (SMA) — including the 10-, 20-, 30-, 50-, 100-, and 200-period metrics — remain in a bullish territory. The 10-period EMA at $117,840 and the 10-period SMA at $118,495 underscore short-term bullishness, while the longer-term 200-period EMA and SMA at $98,747 and $98,167, respectively, affirm the macro uptrend. This alignment of moving averages indicates that while short-term weakness exists, the broader outlook remains resilient.

Bull Verdict:

Bitcoin remains structurally strong, with all key exponential and simple moving averages aligned to the upside, suggesting sustained institutional interest and long-term bullish momentum. If the $117,000–$118,000 support range holds and volume confirms a rebound, a renewed push toward $122,000–$123,000 is plausible, preserving the broader uptrend.

Bear Verdict:

Despite longer-term bullish signals, short-term charts reveal a weakening trend, with bearish divergence, lower highs, and declining momentum across the hourly and 4-hour timeframes. Oscillators and the moving average convergence divergence (MACD) both flash caution, and a decisive break below $117,000 could open the door to a deeper correction.

免责声明:本文章仅代表作者个人观点,不代表本平台的立场和观点。本文章仅供信息分享,不构成对任何人的任何投资建议。用户与作者之间的任何争议,与本平台无关。如网页中刊载的文章或图片涉及侵权,请提供相关的权利证明和身份证明发送邮件到support@aicoin.com,本平台相关工作人员将会进行核查。

上新快、福利猛!注册BitMart即享14,000+ USDT迎新奖!
Ad
Share To
APP

X

Telegram

Facebook

Reddit

CopyLink