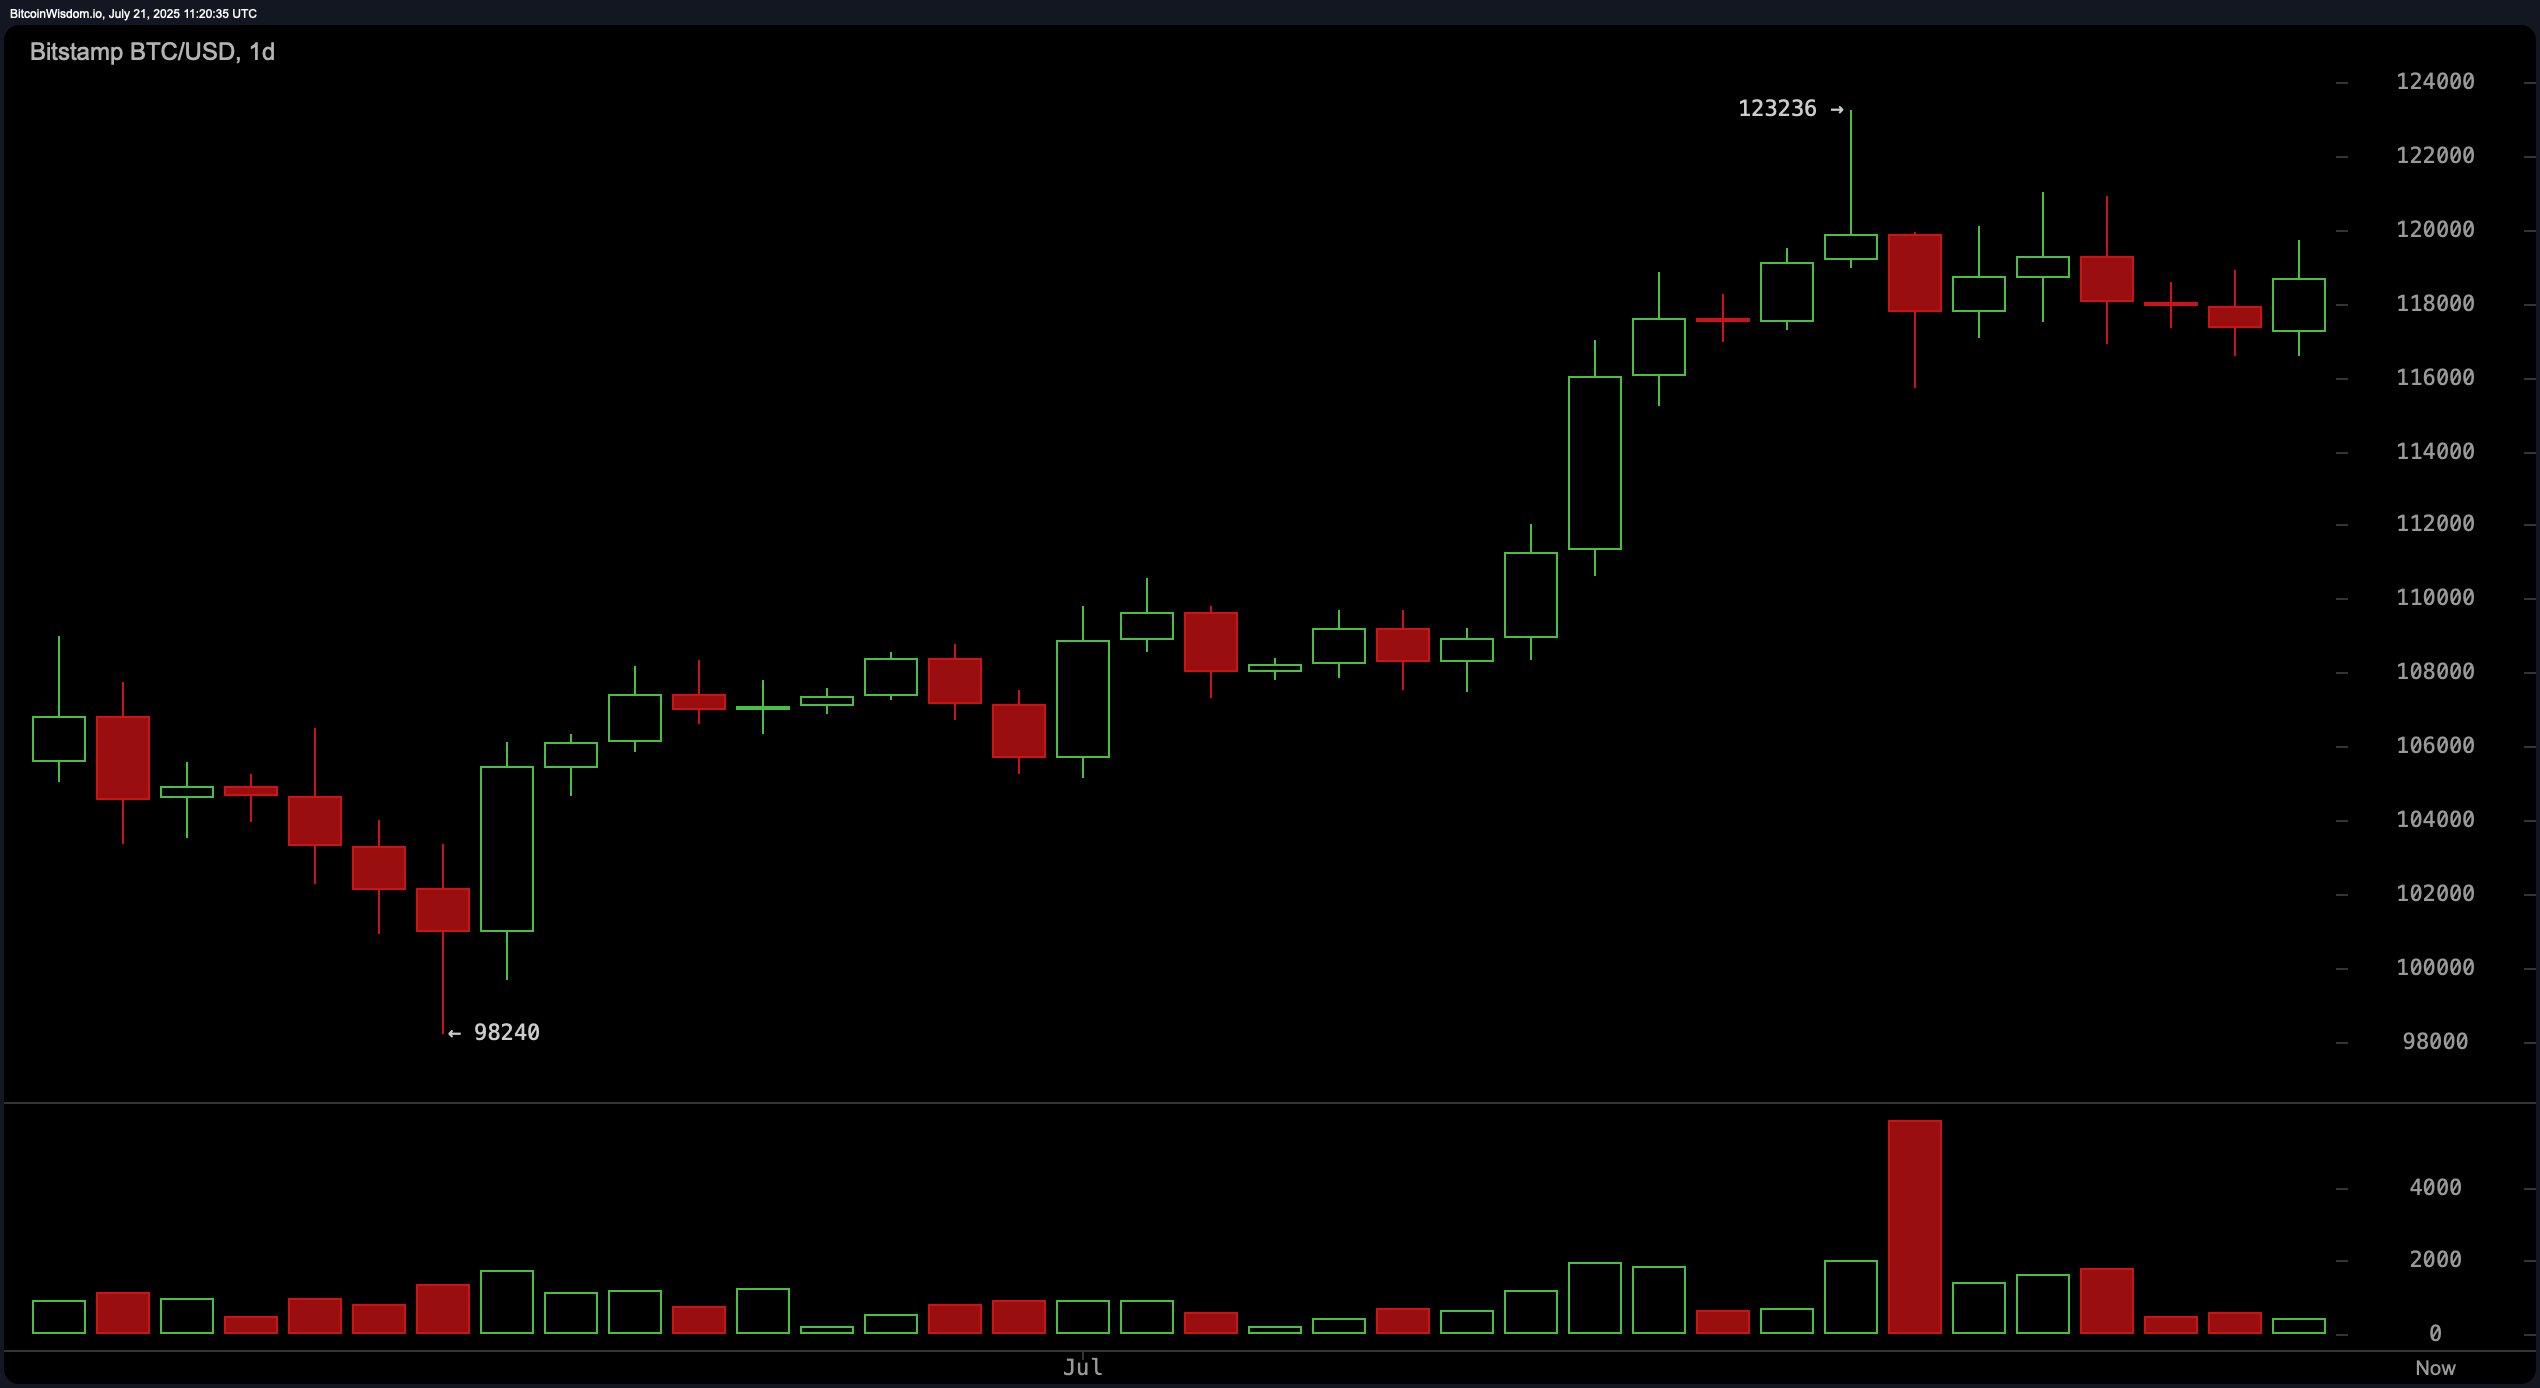
On the daily chart, bitcoin has maintained its upward momentum since rebounding from the $98,240 level. The recent peak at $123,236 was followed by a tight consolidation phase characterized by reduced volume, forming a bullish flag or pennant pattern. A breakout above the $123,236 resistance with volume confirmation would likely validate the continuation of the uptrend, targeting levels beyond $127,000. Traders are advised to place stops below $117,500 to manage downside risk, with a breakdown under $115,000 potentially invalidating the bullish setup.
BTC/USD 1-day chart via Bitstamp on July 21, 2025.
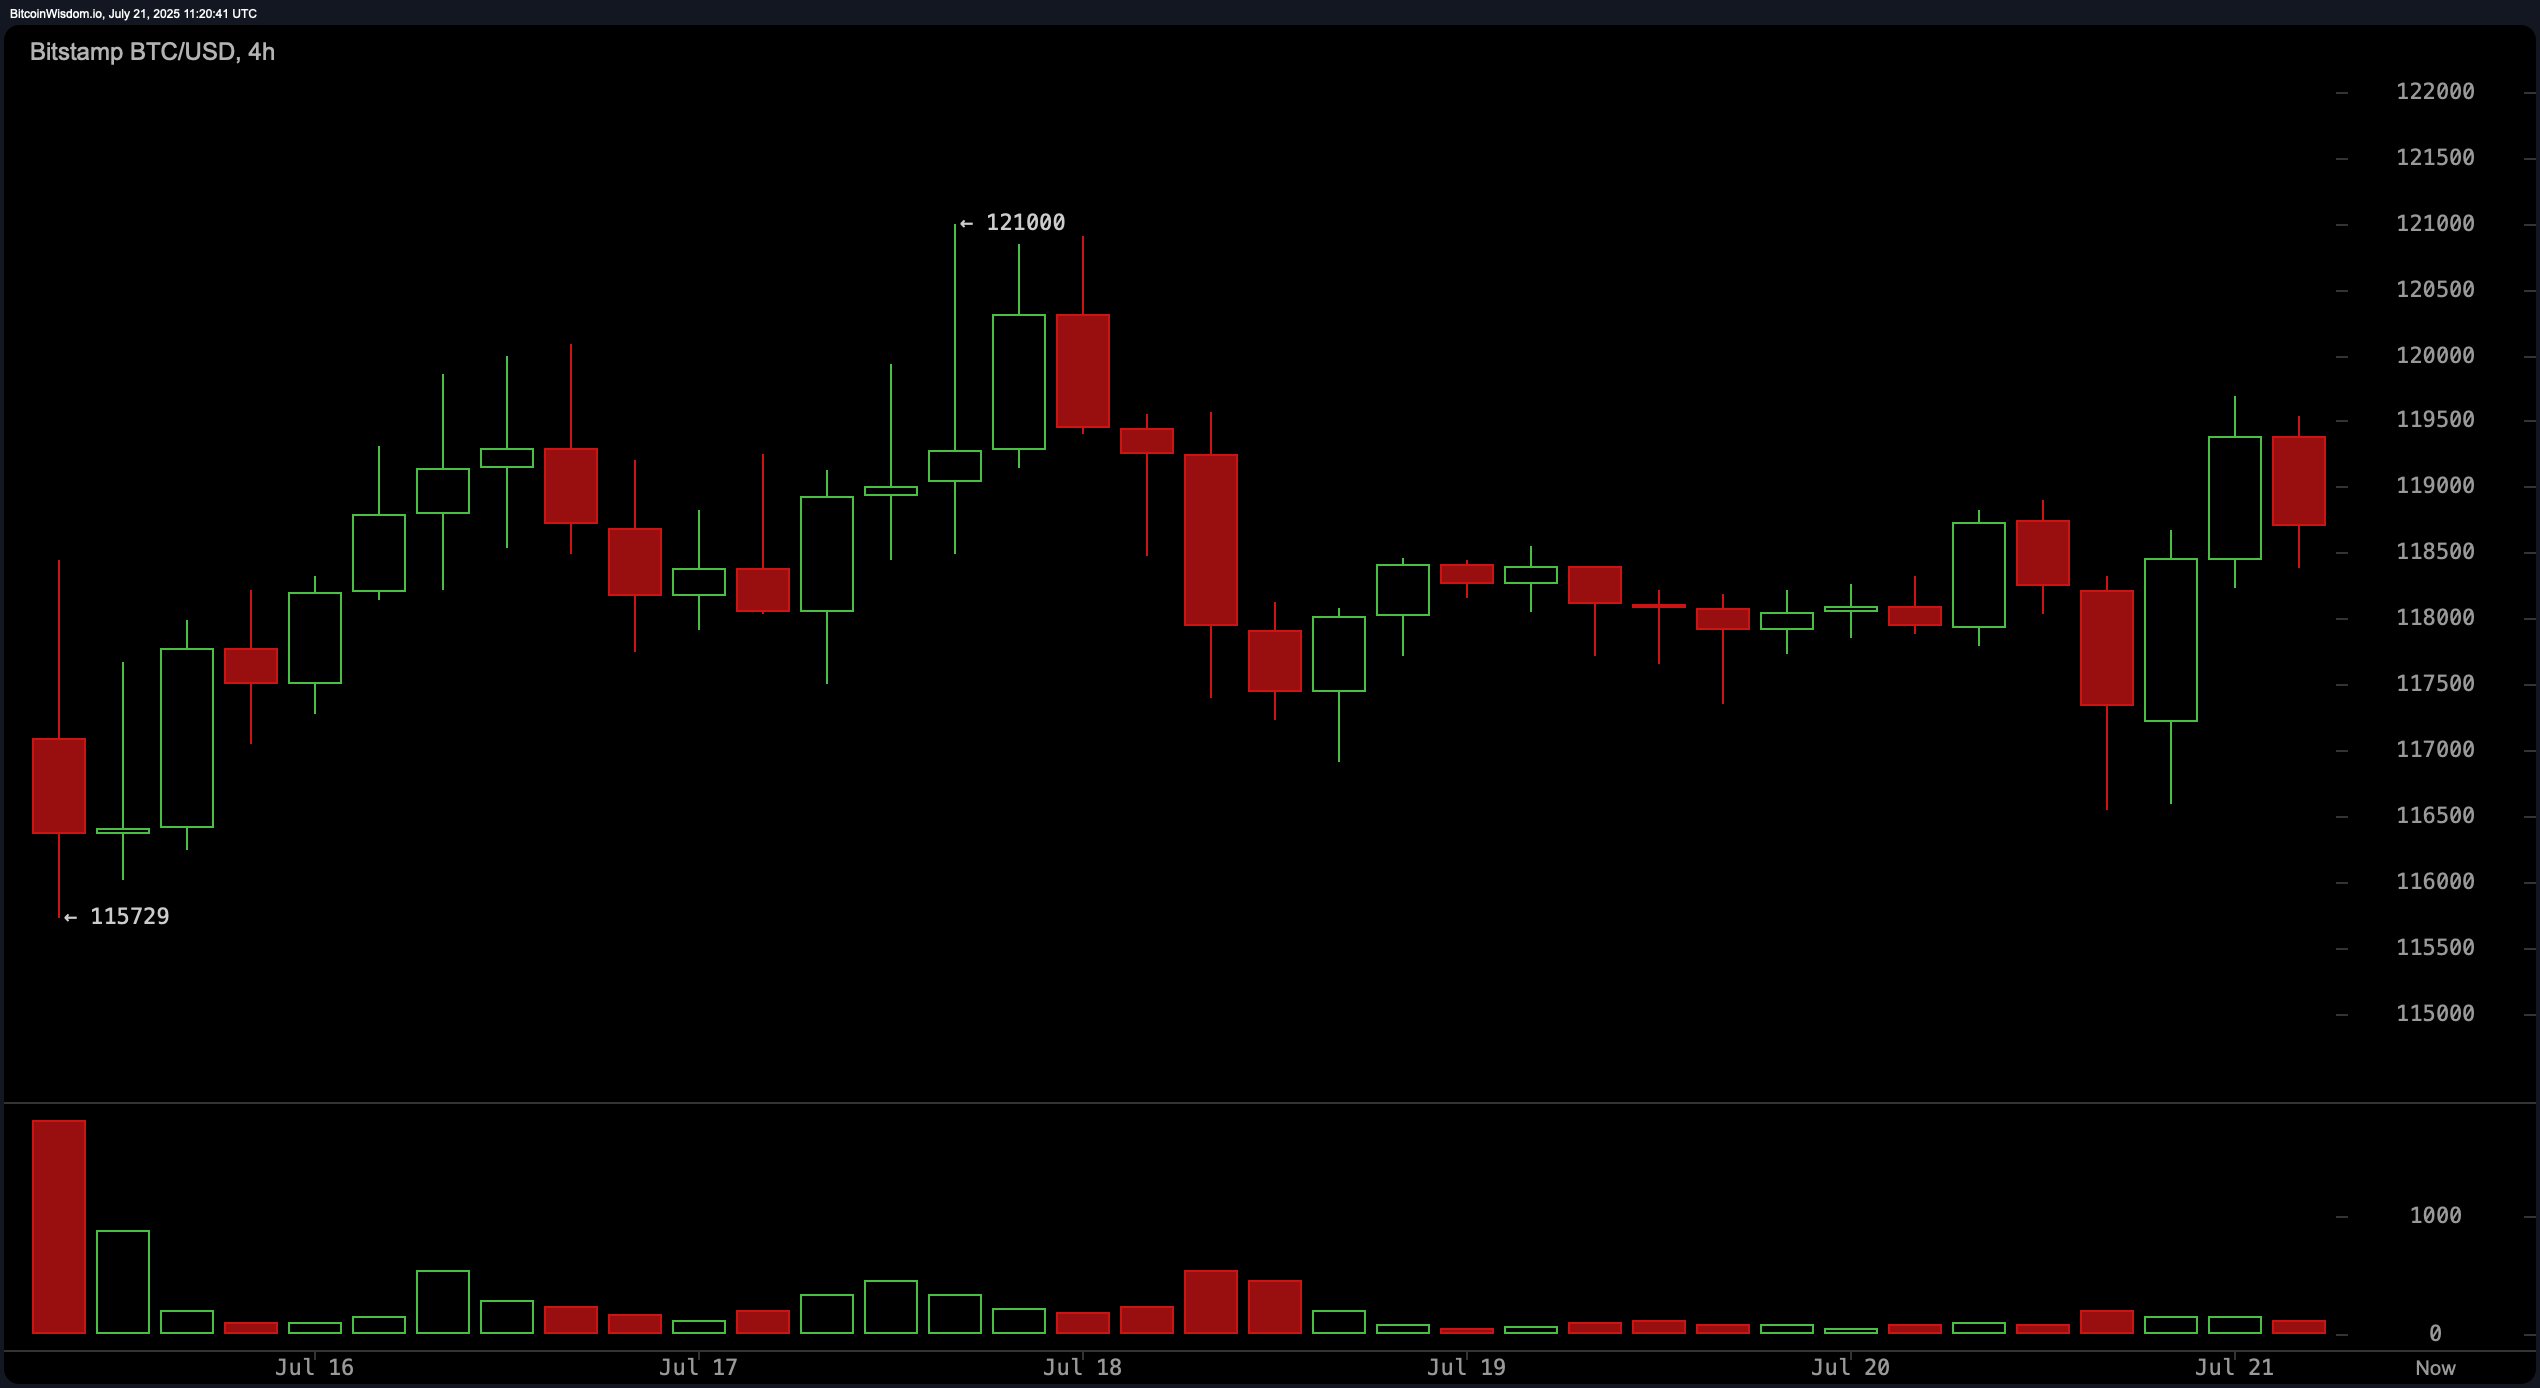
The 4-hour chart shows bitcoin recovering from a medium-term pullback after reaching $121,000, with support firmly established around $115,729. The emergence of higher lows indicates a strengthening bullish sentiment. A confirmed breakout above the $120,000 resistance, particularly on strong volume, would serve as a medium-term entry point with upside targets between $122,000 and $123,000. Cautious traders should maintain a stop-loss below the $116,000 threshold.
BTC/USD 4-hour chart via Bitstamp on July 21, 2025.
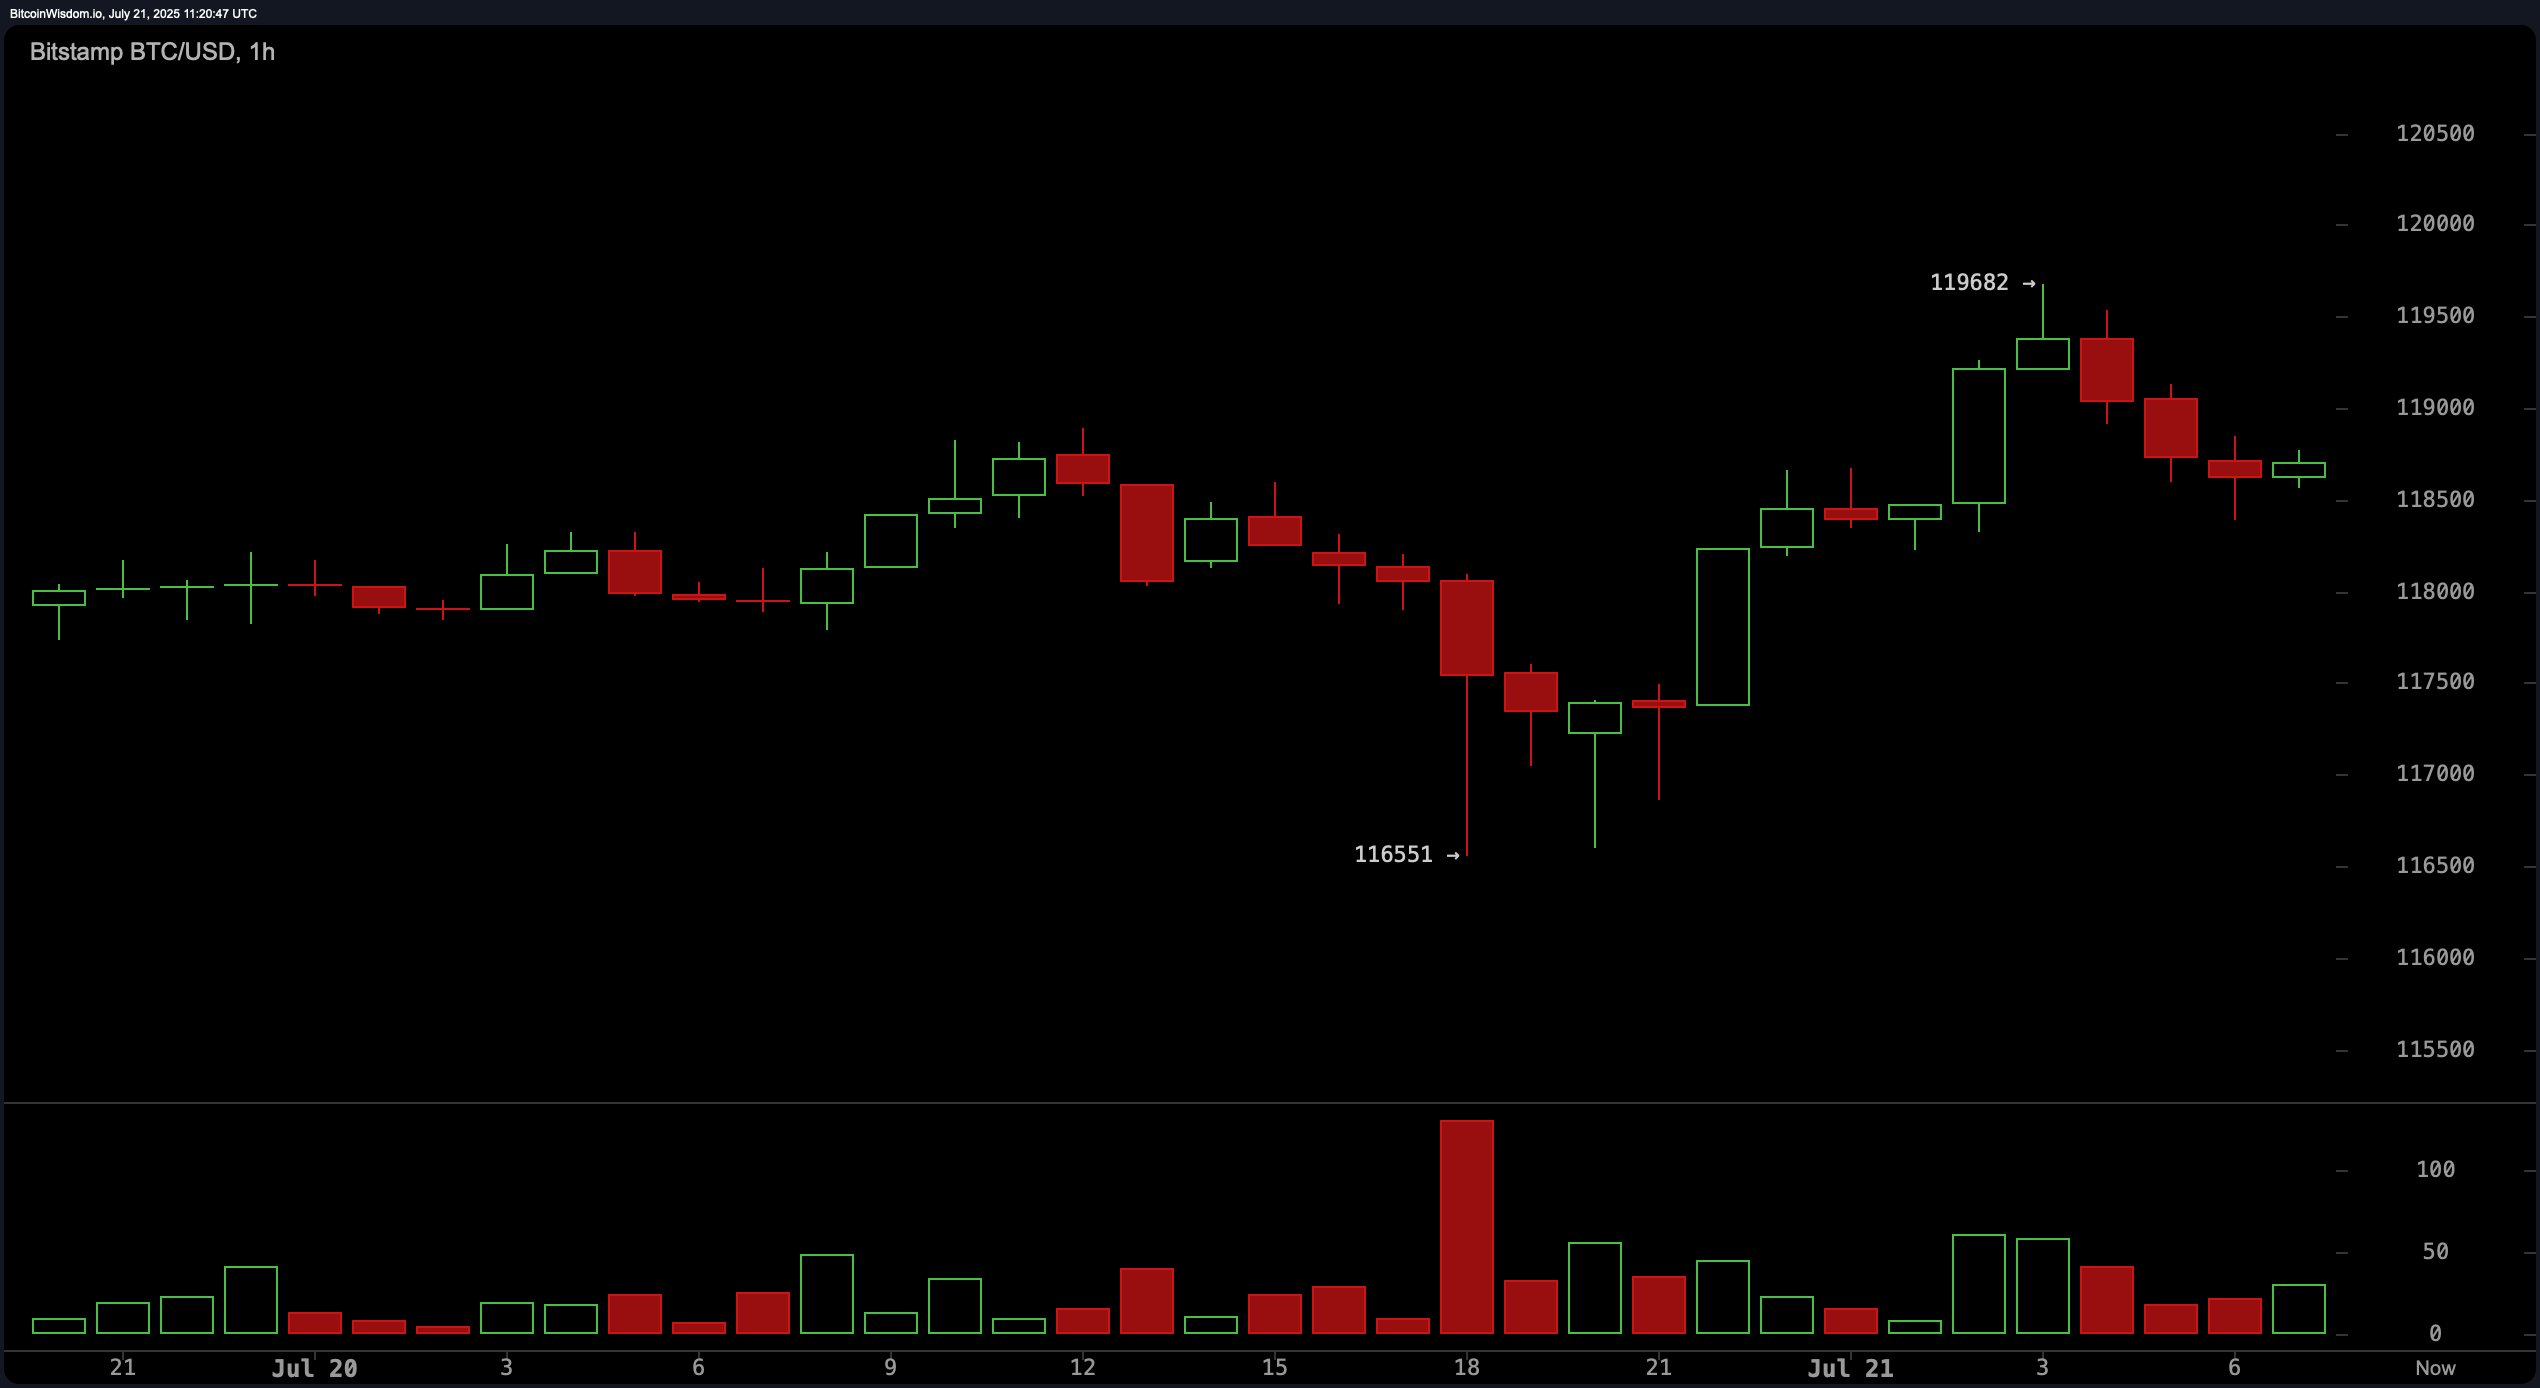
Short-term price action on the 1-hour BTC/USD chart highlights a bounce from $116,551 up to a resistance at $119,500. While current price movement reflects a pullback, the low volume during this phase is consistent with continuation patterns. Traders may consider entry within the $118,000 to $118,500 support zone, especially if a bullish engulfing candle or volume surge materializes. The stop-loss level is advised around $116,500, with short-term targets set between $120,000 and $121,000.
BTC/USD 1-hour chart via Bitstamp on July 21, 2025.
Oscillator data presents a mixed but stable outlook. The relative strength index (RSI) at 66, Stochastic at 67, and commodity channel index (CCI) at 59 all remain in neutral zones, indicating neither overbought nor oversold conditions. The average directional index (ADX) at 28 reflects a moderately trending market, while the Awesome oscillator reads 7,744, also suggesting neutrality. Notably, the momentum indicator signals a mild bear signal at 1,090, while the moving average convergence divergence (MACD) stands at 3,019, supporting a bull signal scenario, adding nuance to the overall technical outlook.
Moving averages (MAs) overwhelmingly reinforce the bullish narrative. All major exponential moving averages (EMAs) and simple moving averages (SMAs) from 10 to 200 periods are aligned in a bullish configuration, with the 10-period EMA at $117,380 and the 200-period SMA at $97,962. This convergence of moving averages below the current price provides a strong support structure and affirms upward momentum. Traders are encouraged to monitor volume closely during breakout attempts and maintain a buy-the-dip strategy as long as bitcoin holds above the $116,000 level.
Bull Verdict:
Bitcoin’s price structure across all major timeframes supports a bullish outlook, reinforced by consistent buy signals from all major moving averages and a technically sound consolidation phase. If the price holds above $116,000 and breaks above $123,236 with strong volume, a sustained rally toward $127,000 or higher appears likely.
Bear Verdict:
Despite the broader bullish trend, the lack of strong oscillator confirmation and reliance on key support levels leaves room for downside risk. A breakdown below $115,000 per bitcoin with volume would undermine the bullish setup, potentially triggering a broader correction and challenging the medium-term upward trajectory.
免责声明:本文章仅代表作者个人观点,不代表本平台的立场和观点。本文章仅供信息分享,不构成对任何人的任何投资建议。用户与作者之间的任何争议,与本平台无关。如网页中刊载的文章或图片涉及侵权,请提供相关的权利证明和身份证明发送邮件到support@aicoin.com,本平台相关工作人员将会进行核查。