显然,山寨币季节的气息正在弥漫。随着比特币今天横盘交易,加密货币交易者似乎将目光投向其他地方:以太坊已经突破3300美元大关,目前交易价格为3339.13美元,周涨幅强劲达到20%。XRP今天又上涨了12%,超过了2018年的历史最高点。坐落于市值前五名之外的以太坊竞争对手索拉纳会是下一个吗?
宏观形势对风险资产继续看好。加密货币市场在最近的反弹中继续前进,总市值达到3.86万亿美元,在过去24小时内上涨了1.40%。尽管比特币今天持平,但仍然在120,000美元以下,单独占据2.3万亿美元的市值。
传统市场信号混杂,标准普尔500指数下跌0.40%,收于6243.76,较早前创下的新高有所回落。纳斯达克表现优异,上涨0.18%,创下20677.80的历史收盘新高。
那么,这对索拉纳意味着什么呢?
索拉纳接近金叉
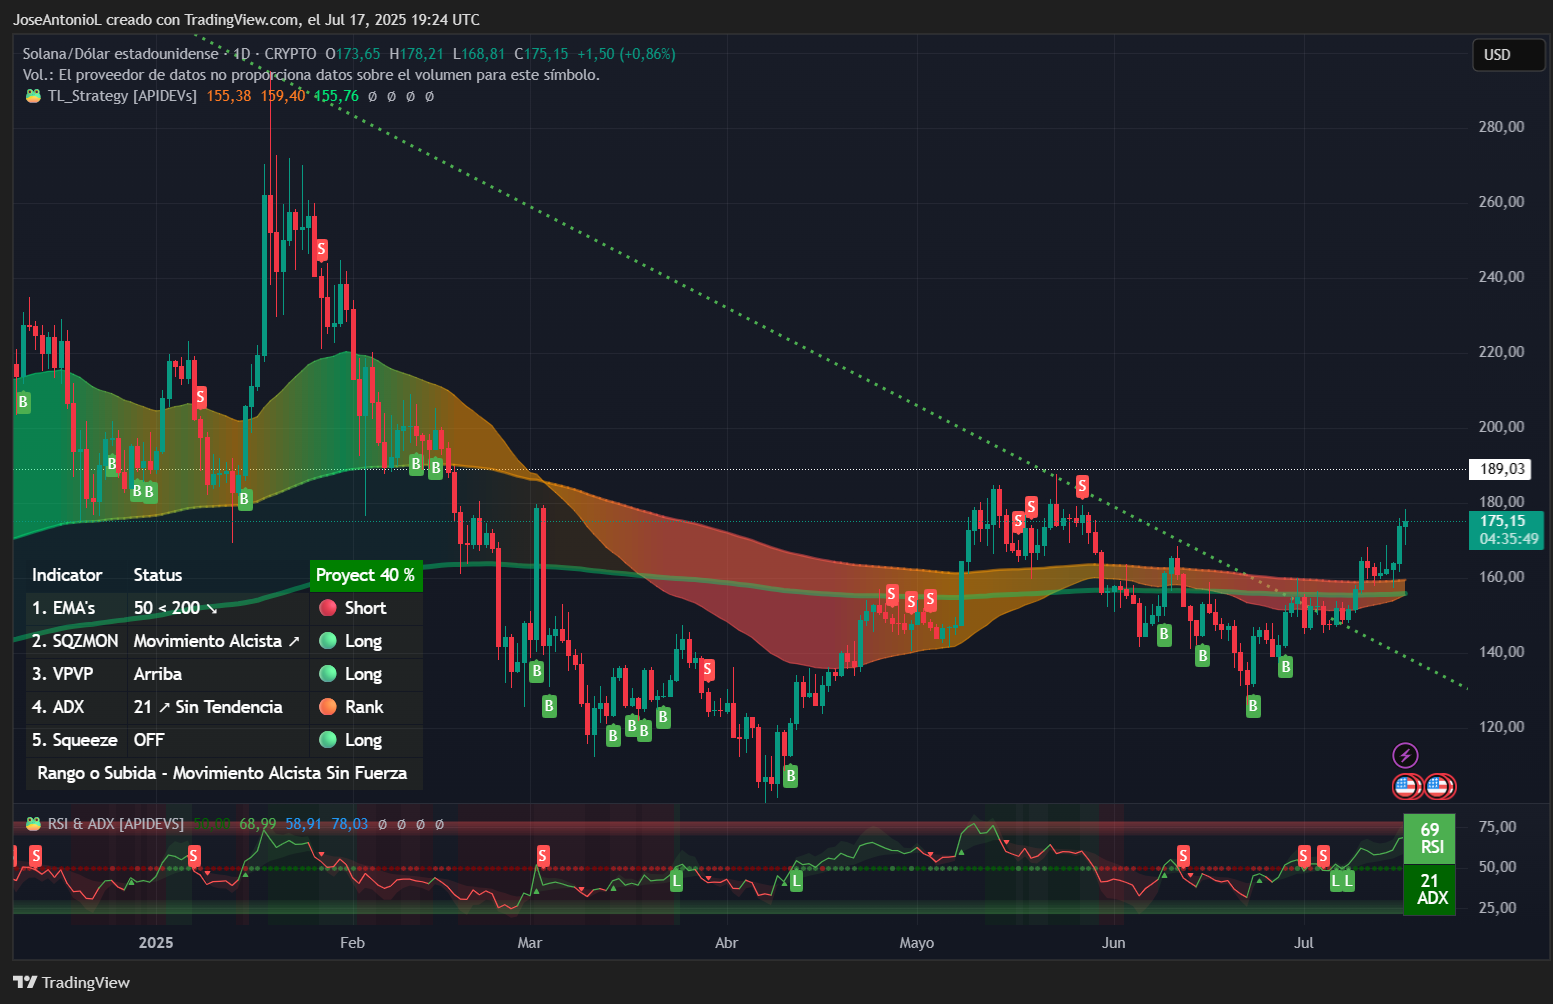
索拉纳价格数据。图片来源:TradingView
考虑到XRP和以太坊最近的走势,SOL(索拉纳区块链的原生代币)的图表看起来非常看涨,这并不令人惊讶。
索拉纳在过去一周上涨了9.7%,目前交易价格为175.15美元,曾测试心理价位180美元。最近的上涨是由于多个看涨催化剂的推动,包括在德意志交易所Xetra上推出Virtune的Staked Solana ETP,提供对SOL的合规性投资和质押奖励。以太坊巨额ETF流入的溢出效应为像索拉纳这样的高贝塔山寨币创造了额外需求,交易量激增以确认市场的真实兴趣。
索拉纳的技术图景在多个指标上呈现出强烈的看涨信号。索拉纳终于击败了其看跌三角形,突破了自2025年初以来一直存在的价格阻力位。
相对强弱指数(RSI)衡量价格变化的速度和幅度,以识别超买或超卖状态。在RSI为68点时,SOL显示出强劲的看涨动能,尚未达到超买阈值70。这通常被交易者解读为看涨,因为这表明买方掌控市场,同时仍有空间在达到疲软水平之前推高价格。交易者通常将RSI在50-70之间的读数视为持续上涨的“甜蜜点”。
SOL的平均方向指数(ADX)为21,这对SOL的多头来说是个好消息。ADX衡量趋势强度而不考虑方向,读数超过25确认强趋势。在21的情况下,这表明自5月高点以来将SOL价格下调47%的看跌修正正在减弱。对交易者而言,这意味着SOL可能即将确认看涨突破。
至于代币的指数移动平均线(EMA),图表显示50日EMA(橙色线)目前低于200日EMA(红色线),通常是看跌信号。EMA是给定时间段内的价格平均值。然而,价格已经果断突破了这两个平均线,目前交易价格在175美元左右,而EMA则接近160美元的价格区间。
随着两个EMA的接近,我们可能即将进入金叉情景,进一步确认索拉纳从看跌转向看涨的趋势。常规读者可能还记得,以市值领先索拉纳数十亿的以太坊,最近在其图表上形成了相同的模式,推动了看涨动能。
索拉纳的挤压动量指标显示为“关闭”状态,表明波动性已经从之前的压缩阶段释放。这对于价格突破重重阻力是必要的,并可能表明SOL已经走出整合阶段,现在处于活跃的趋势阶段,这通常支持持续的方向性运动,而不是波动的横盘走势。
可见范围的交易量轮廓显示在150-160美元区间内有显著的交易活动,形成了强大的支撑基础。这个高交易量节点充当“磁铁”,在任何回调时应提供支撑,因为许多交易者在这个区域持有的头寸可能会被捍卫。
关键水平
立即支撑:$160-162(之前的阻力转为支撑)
强支撑:$150-155(高交易量节点和EMA重合)
立即阻力:$189.03(图表上可见的水平阻力)
强阻力:$200-205(心理整数和测量移动目标)
XRP:敲响历史的大门
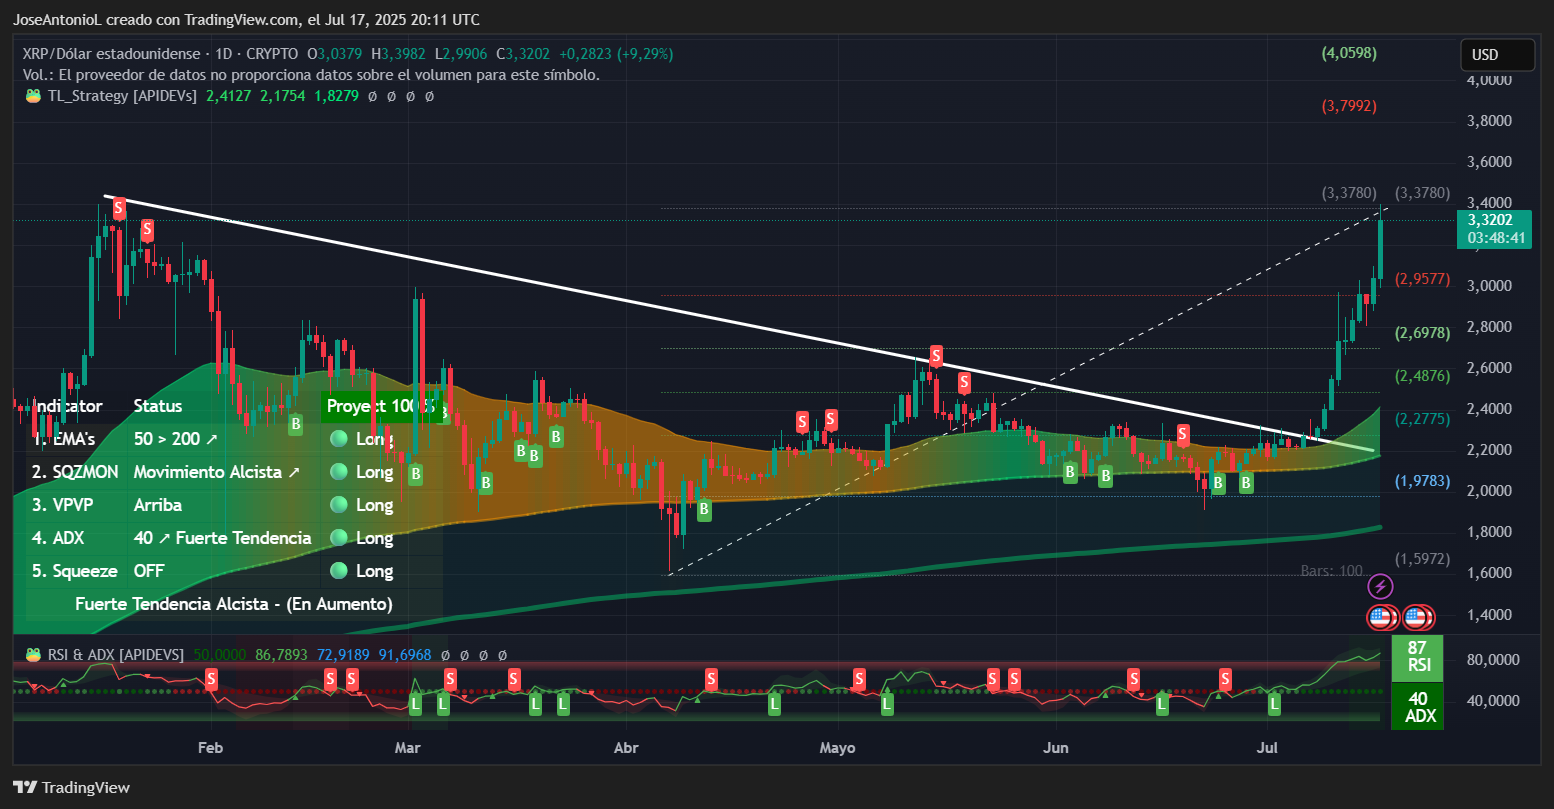
谈到XRP,别无他法:这枚币为其真正的信徒带来了惊人的回报。XRP今天飙升至3.47美元,突破了2018年的历史最高点3.40美元。
现在似乎几乎可以肯定的是,XRP将很快达到至少3.50美元,在Myriad——由Decrypt的母公司Dastan开发的预测市场——上,用户将这一概率评估为95%。
当前价格代表着由美国国会围绕加密友好法案的监管乐观情绪和ProShares的XRP期货ETF推出所推动的巨大反弹。随着代币在突破长期三角形模式后几乎进入价格发现模式,技术设置表明如果历史最高点被果断突破,可能会有显著的进一步涨幅。
XRP的技术指标全面发力,描绘出极其看涨的图景:
RSI读数为87,表明极度超买状态,因为超过70的读数通常信号过度扩展。然而,在强劲的趋势市场中,尤其是在突破多年高点时,RSI可以在较长时间内保持超买。这就是交易者所称的“嵌入RSI”,即指标保持在70以上,而价格继续上涨。
虽然它警告可能出现短期回调,但也确认了通常伴随历史突破的异常买入压力。
XRP的ADX为40,显示出异常强劲的趋势。超过25的读数表明强趋势,但超过40的水平则被称为“强势趋势”——这种走势如此强劲,往往会超出逻辑目标。动量交易者应顺势而为,而不是与之对抗——但那些错过机会的人最好等待更好的时机,除非他们能够承受风险或在历史最高水平后进行正常的修正。
与索拉纳不同,XRP显示出完美的看涨EMA设置,50日EMA远高于200日EMA。价格在3.47美元,显著高于这两个平均线,且它们之间有强烈的分离。这种配置通常表明成熟的上升趋势,伴随机构支持,因为长期投资者在整个上涨过程中一直在积累。
从技术上讲,这枚币如此看涨,即使下跌25%也将保持健康,并处于更广泛的看涨趋势之内。
关键水平
立即支撑:$3.00(心理水平和吞没蜡烛取消今天的涨幅)
强支撑:$2.69(之前的阻力区)
价格测试区:$3.40
下一个目标约为$3.79,基于127.2%的斐波那契扩展
最终目标接近$4.00-$4.05,基于模式的测量移动和下一个整数
作者所表达的观点和意见仅供参考,并不构成财务、投资或其他建议。
免责声明:本文章仅代表作者个人观点,不代表本平台的立场和观点。本文章仅供信息分享,不构成对任何人的任何投资建议。用户与作者之间的任何争议,与本平台无关。如网页中刊载的文章或图片涉及侵权,请提供相关的权利证明和身份证明发送邮件到support@aicoin.com,本平台相关工作人员将会进行核查。


