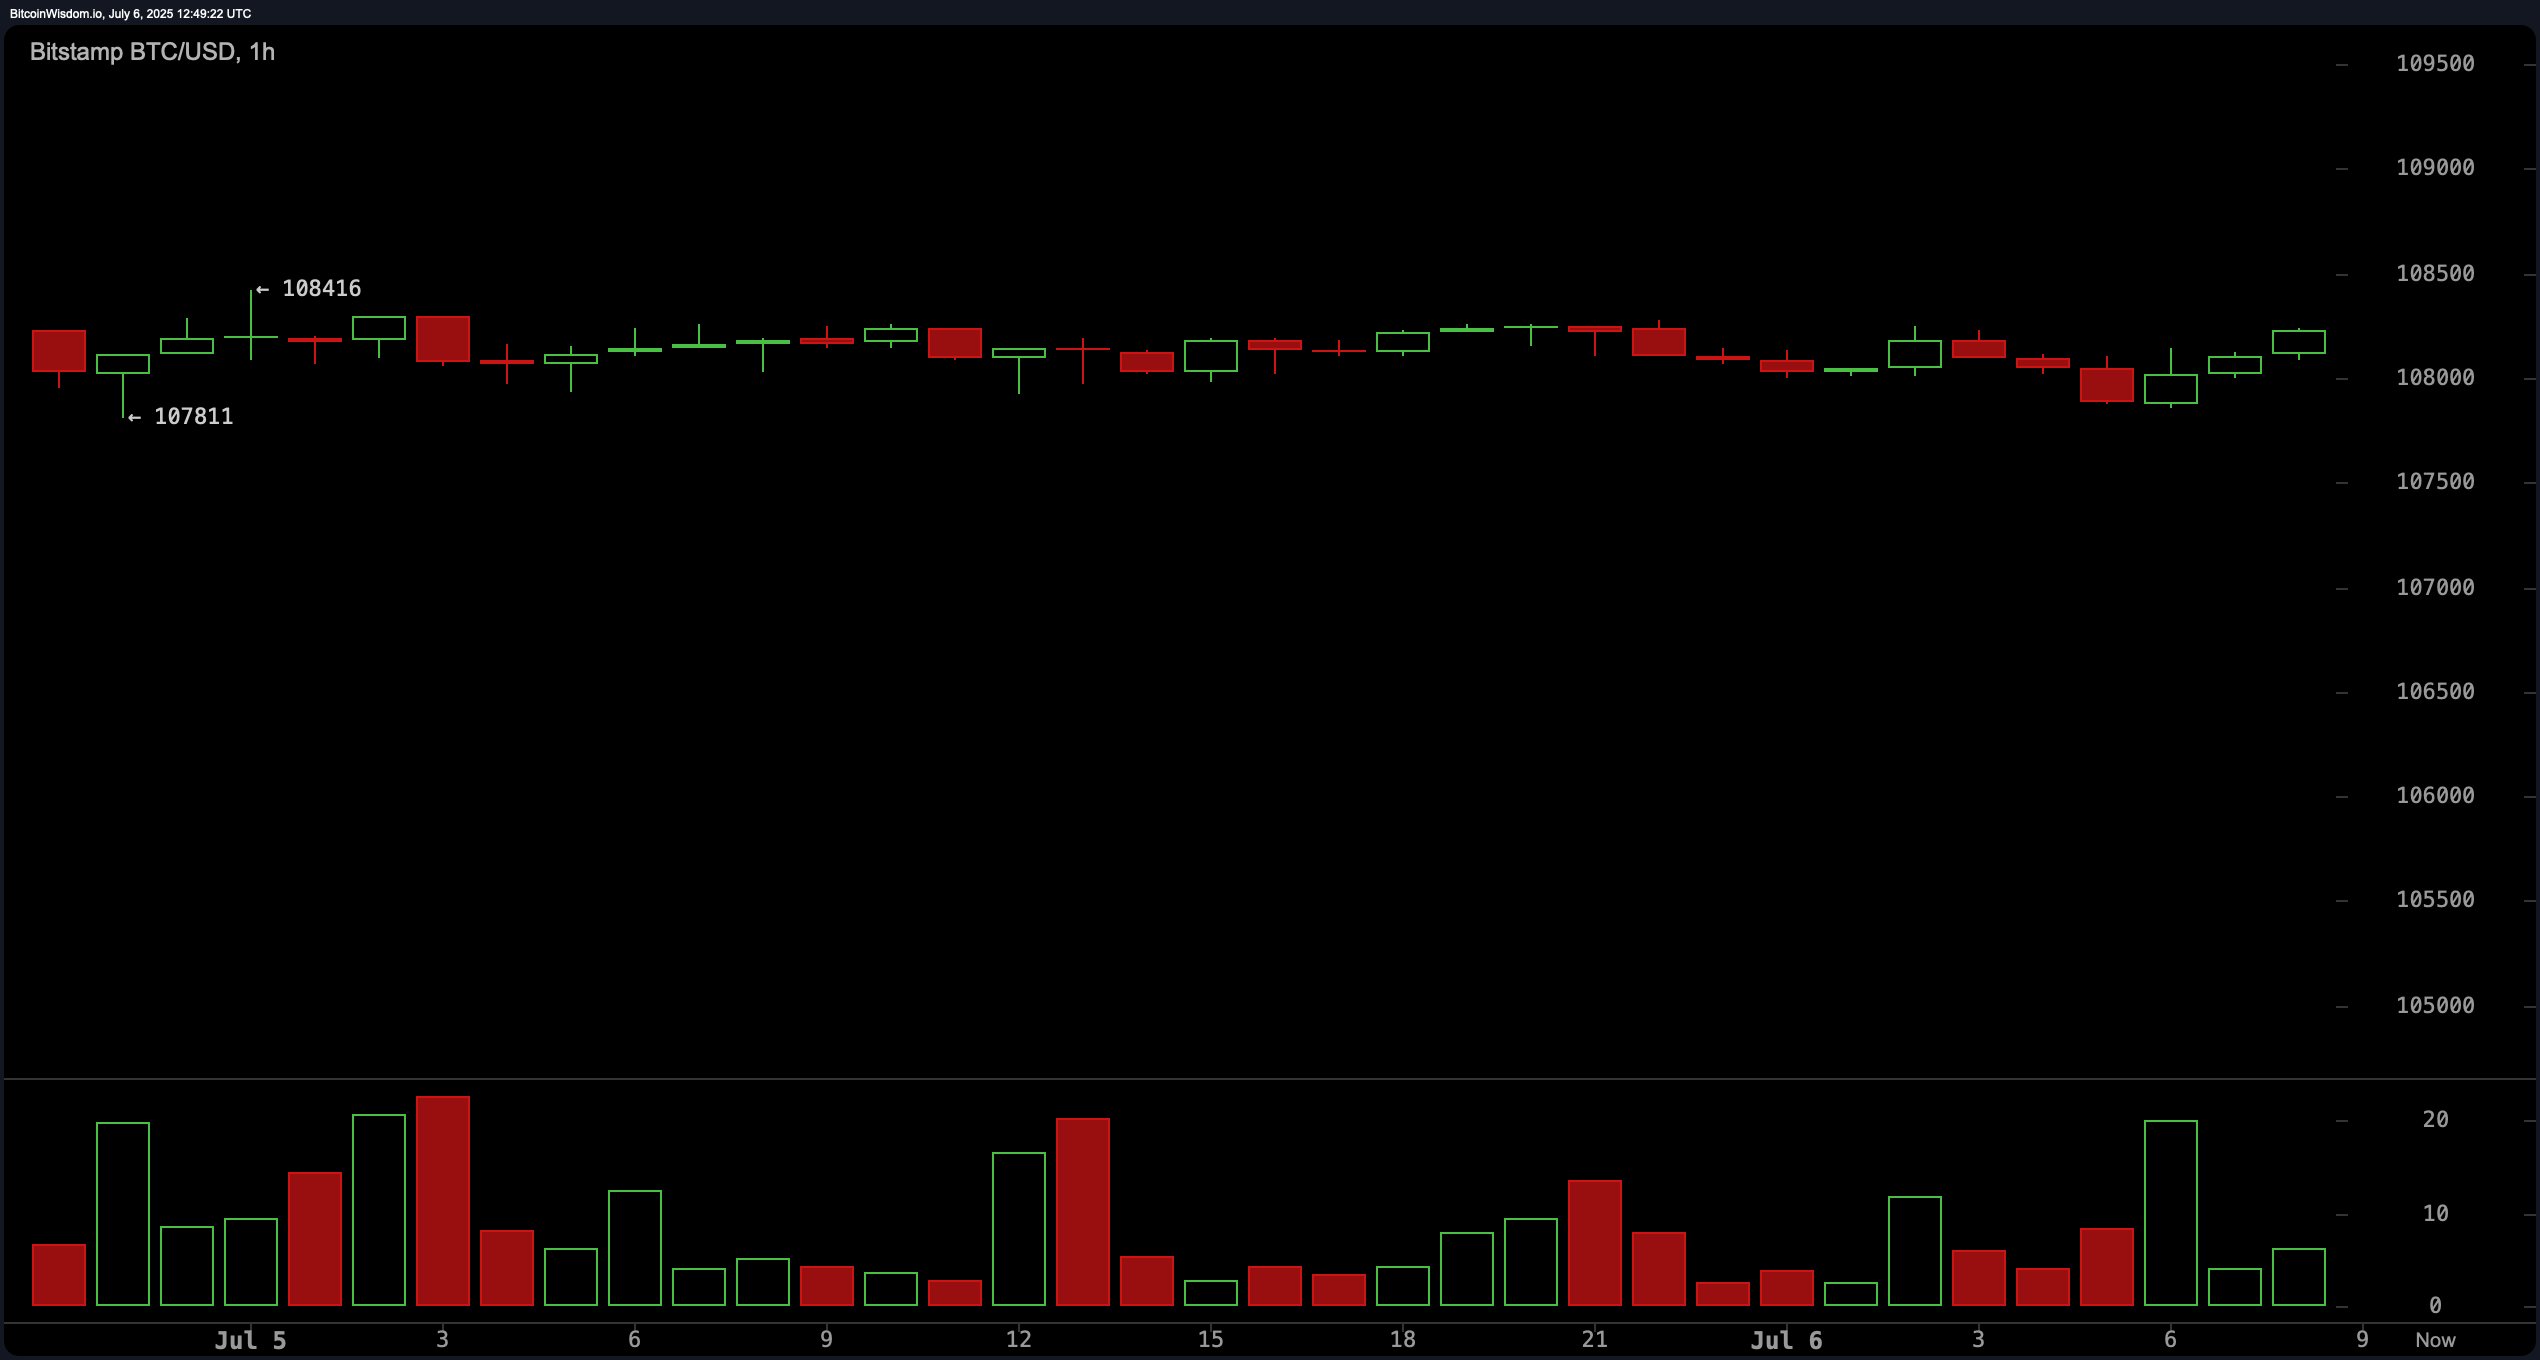
On the 1-hour chart, bitcoin exhibited muted price action with tight consolidation between $107,800 and $108,400. The low volume underscored a lack of directional conviction among traders. Scalping opportunities exist within this range, but risk remains elevated due to limited volatility and a narrow spread. Technical signals recommend caution; the relative strength index (RSI) at 55 is neutral, as are the Stochastic oscillator and commodity channel index (CCI), indicating indecision. Despite this, the momentum oscillator suggests a modest bullish tilt, registering a value of 1,220, while the moving average convergence divergence (MACD) level sits at 853, signaling buying strength.

BTC/USD 1-hour chart via Bitstamp on July 6, 2025.
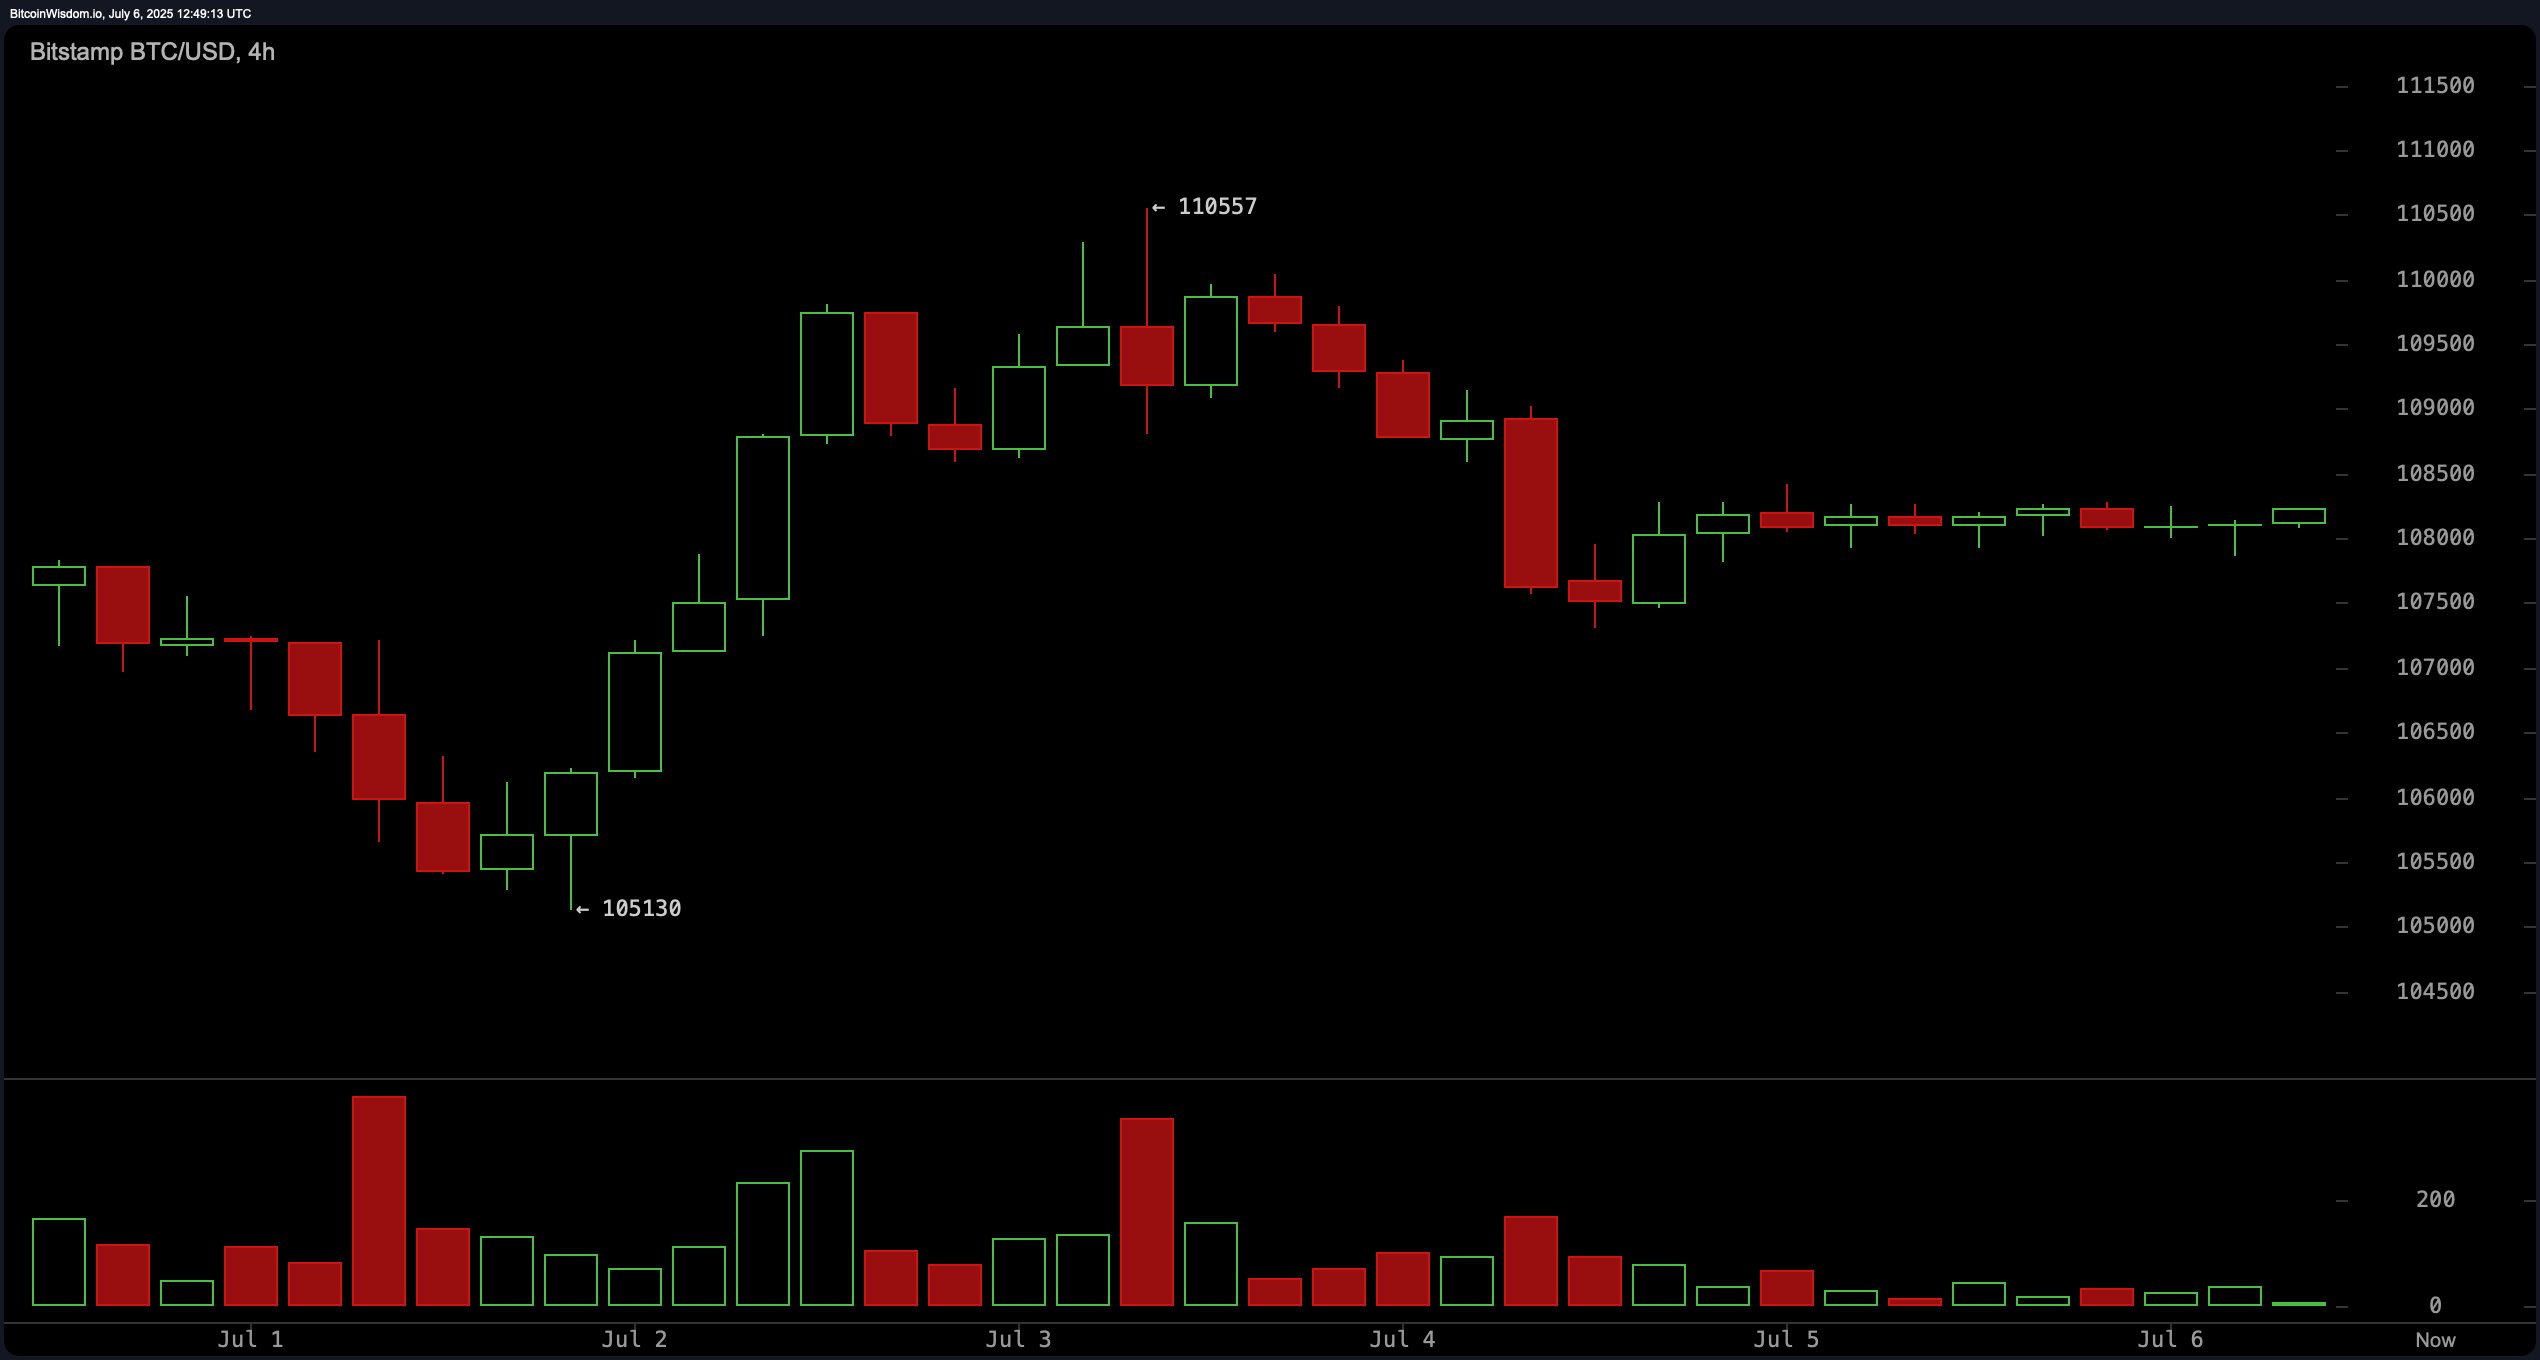
The 4-hour bitcoin chart reveals a slightly broader perspective, showcasing a rebound from $105,130 followed by sideways consolidation between $107,500 and $108,500. Declining volume points to weakening market momentum, reinforcing the need for a breakout to confirm direction. Key technical levels remain closely watched; a decisive move above $108,500 could lead to a retest of the $110,500 resistance. Conversely, a breakdown below $107,000 per bitcoin may pave the way for a pullback toward $105,000. Oscillator data remains largely neutral on this timeframe, while all short- to mid-term exponential and simple moving averages indicate a sustained buy trend.

BTC/USD 4-hour chart via Bitstamp on July 6, 2025.
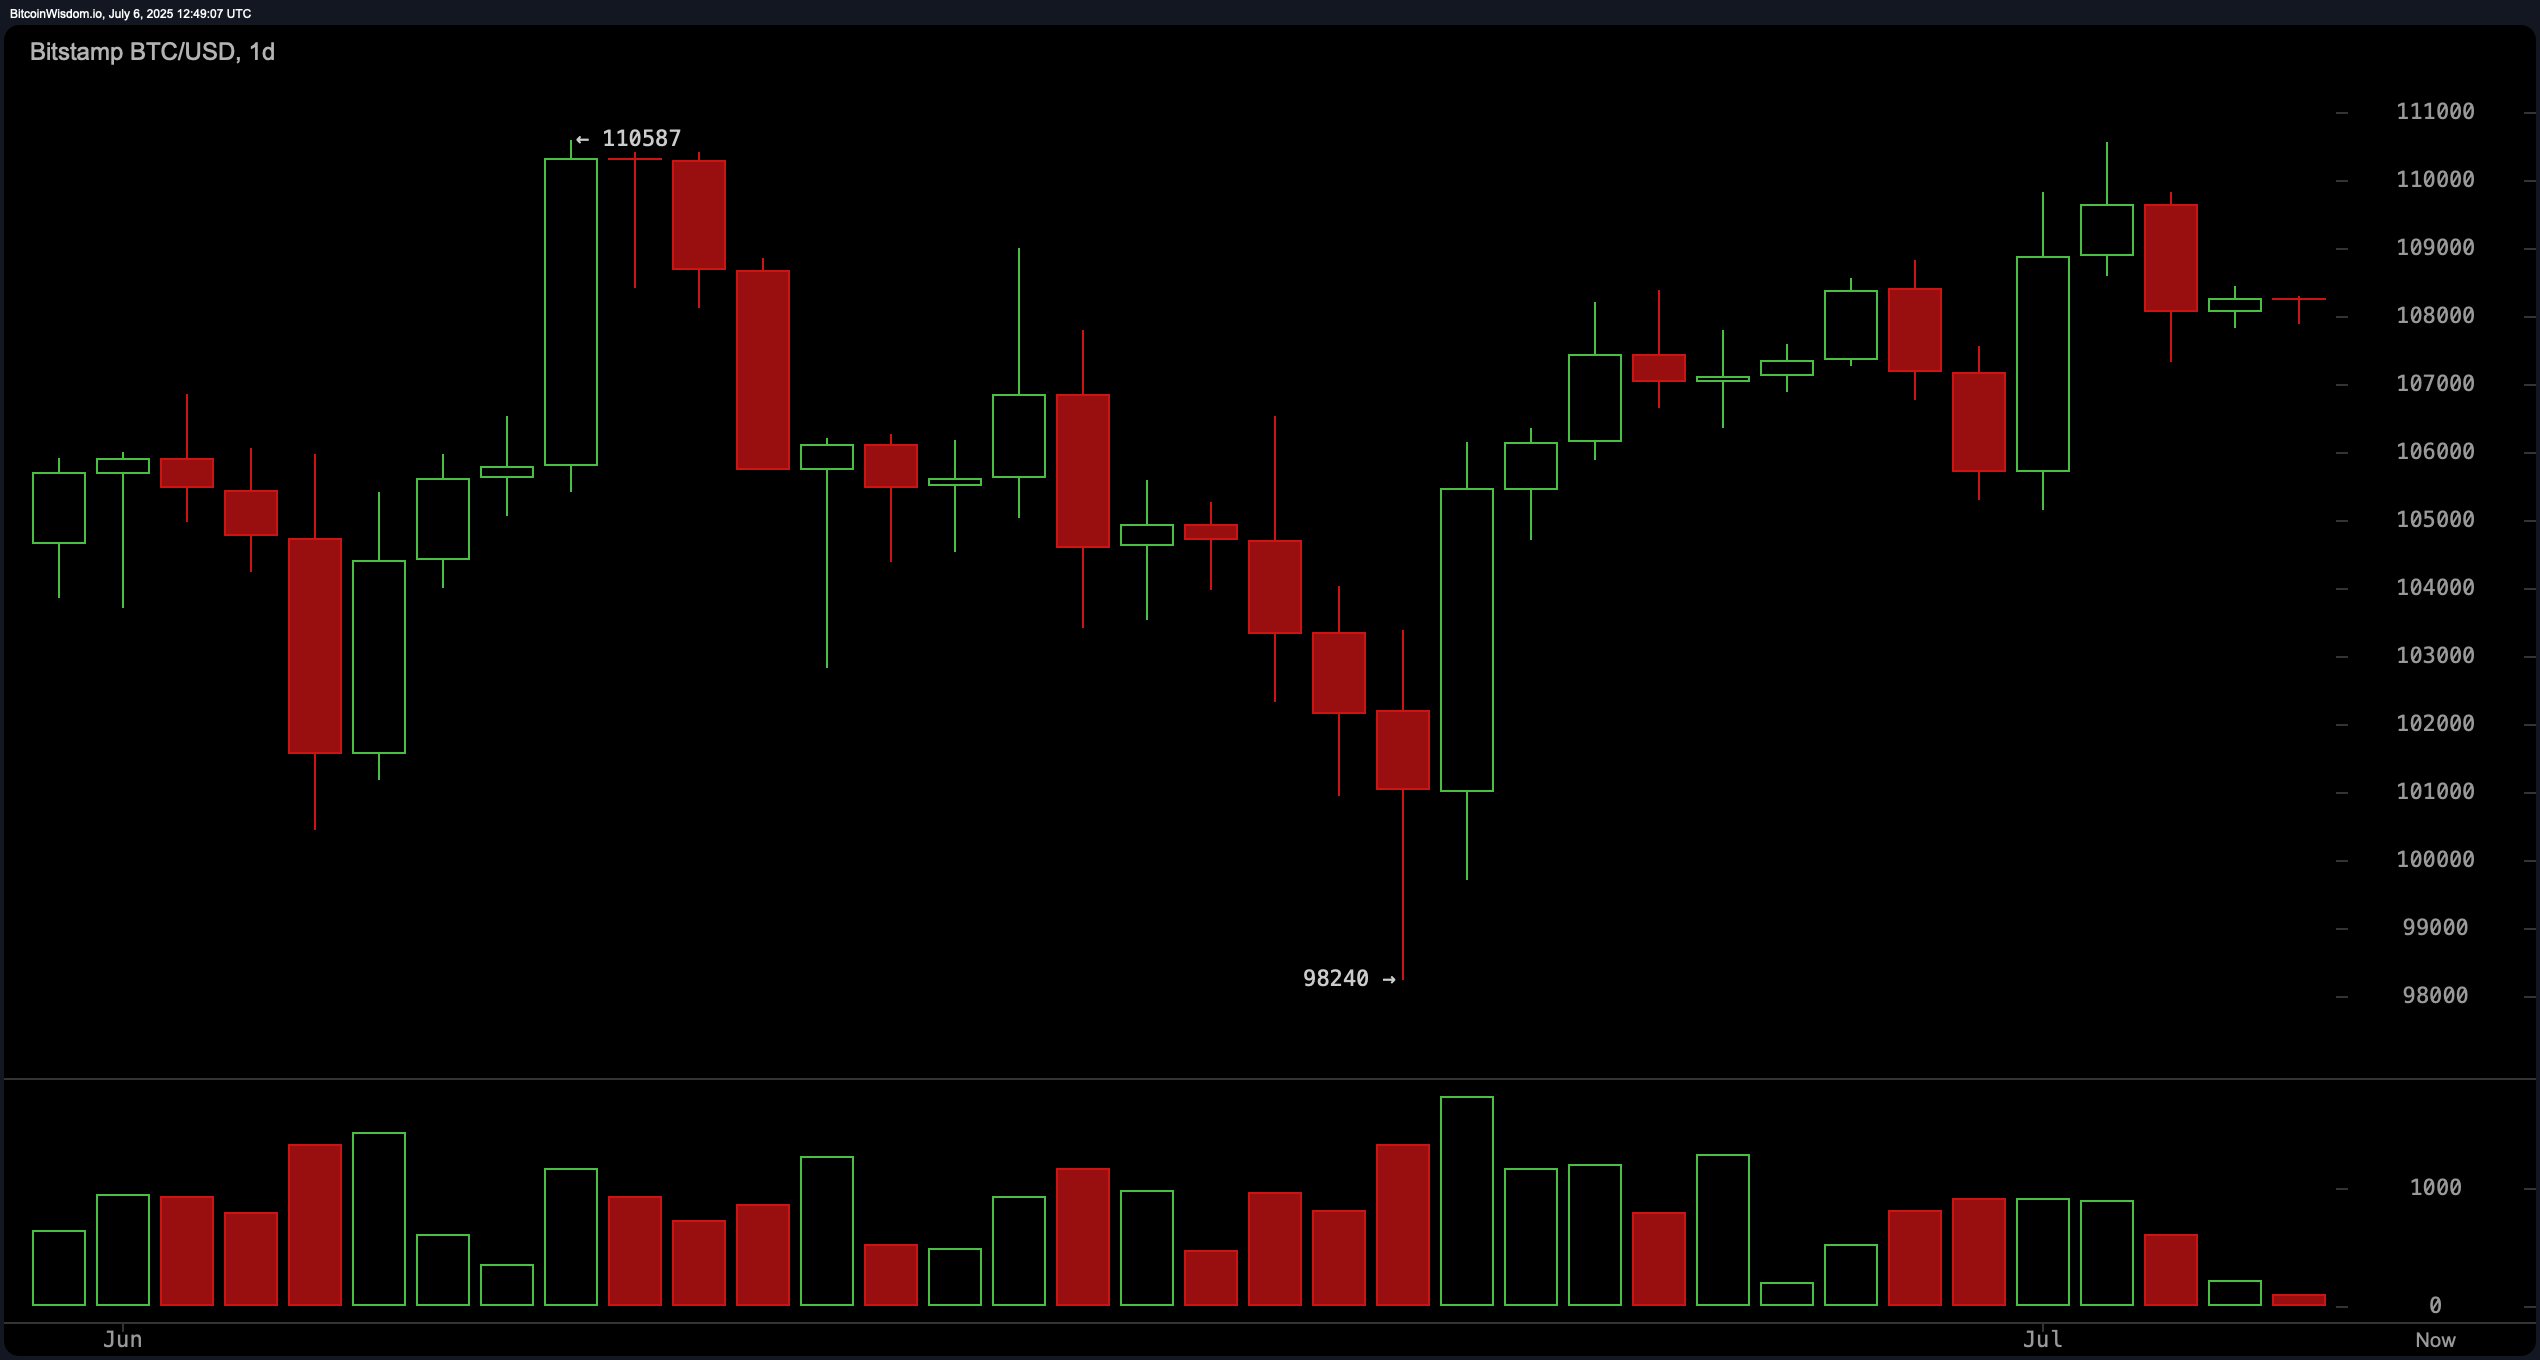
From a daily perspective, bitcoin continues to oscillate within a broader consolidation zone, anchored between support at $98,000 and resistance at $110,500. Price has failed to break above this upper boundary twice, suggesting potential exhaustion at higher levels. A double-bottom formation around $98,240 hints at a strong foundational base, supported by increased volume during reversal candles, a potential sign of institutional participation. With key moving averages—ranging from the 10-day to the 200-day—positioned below current price levels and issuing buy signals, the overall medium-term trend remains bullish.

BTC/USD 1-day chart via Bitstamp on July 6, 2025.
Oscillators across all timeframes offer a mixed picture. On the daily scale, the relative strength index (RSI) at 55, the Stochastic at 80, the commodity channel index (CCI) at 69, and the average directional index (ADX) at 10 all suggest neutrality, indicating a balanced tug-of-war between bulls and bears. However, momentum and trend-following indicators such as the Awesome oscillator, momentum oscillator, and MACD offer a bullish bias. These divergences often precede volatility spikes, reinforcing the importance of volume-confirmed breakouts for directional trading.
Given the current technical landscape, traders should maintain a cautious stance in the short term while preparing for directional plays contingent on a confirmed breakout above $110,500 or a breakdown below $107,000. Medium-term strategies may favor accumulation near strong support levels around $98,000, especially if the price continues to hold that base. Stop-losses should be tactically placed just outside of established support and resistance bands to manage risk effectively. As bitcoin continues to consolidate within this well-defined range, disciplined execution and patience will be critical for capturing the next major move.
Bull Verdict:
If bitcoin decisively breaks above the $110,500 resistance level with strong accompanying volume, the path opens for a continued bullish advance. The alignment of all major moving averages in buy territory and positive momentum signals supports the case for upside extension toward new highs.
Bear Verdict:
A breakdown below $107,000, particularly if volume rises during the move, could trigger a deeper correction toward the $105,000 and $98,000 support levels. Despite bullish longer-term indicators, weakening volume and neutral oscillators warn that bullish momentum may be stalling in the short term.
免责声明:本文章仅代表作者个人观点,不代表本平台的立场和观点。本文章仅供信息分享,不构成对任何人的任何投资建议。用户与作者之间的任何争议,与本平台无关。如网页中刊载的文章或图片涉及侵权,请提供相关的权利证明和身份证明发送邮件到support@aicoin.com,本平台相关工作人员将会进行核查。


