Bitcoin Price Watch: Is Bitcoin Winding up for a Volatile July Surge?

CN
3 hours ago

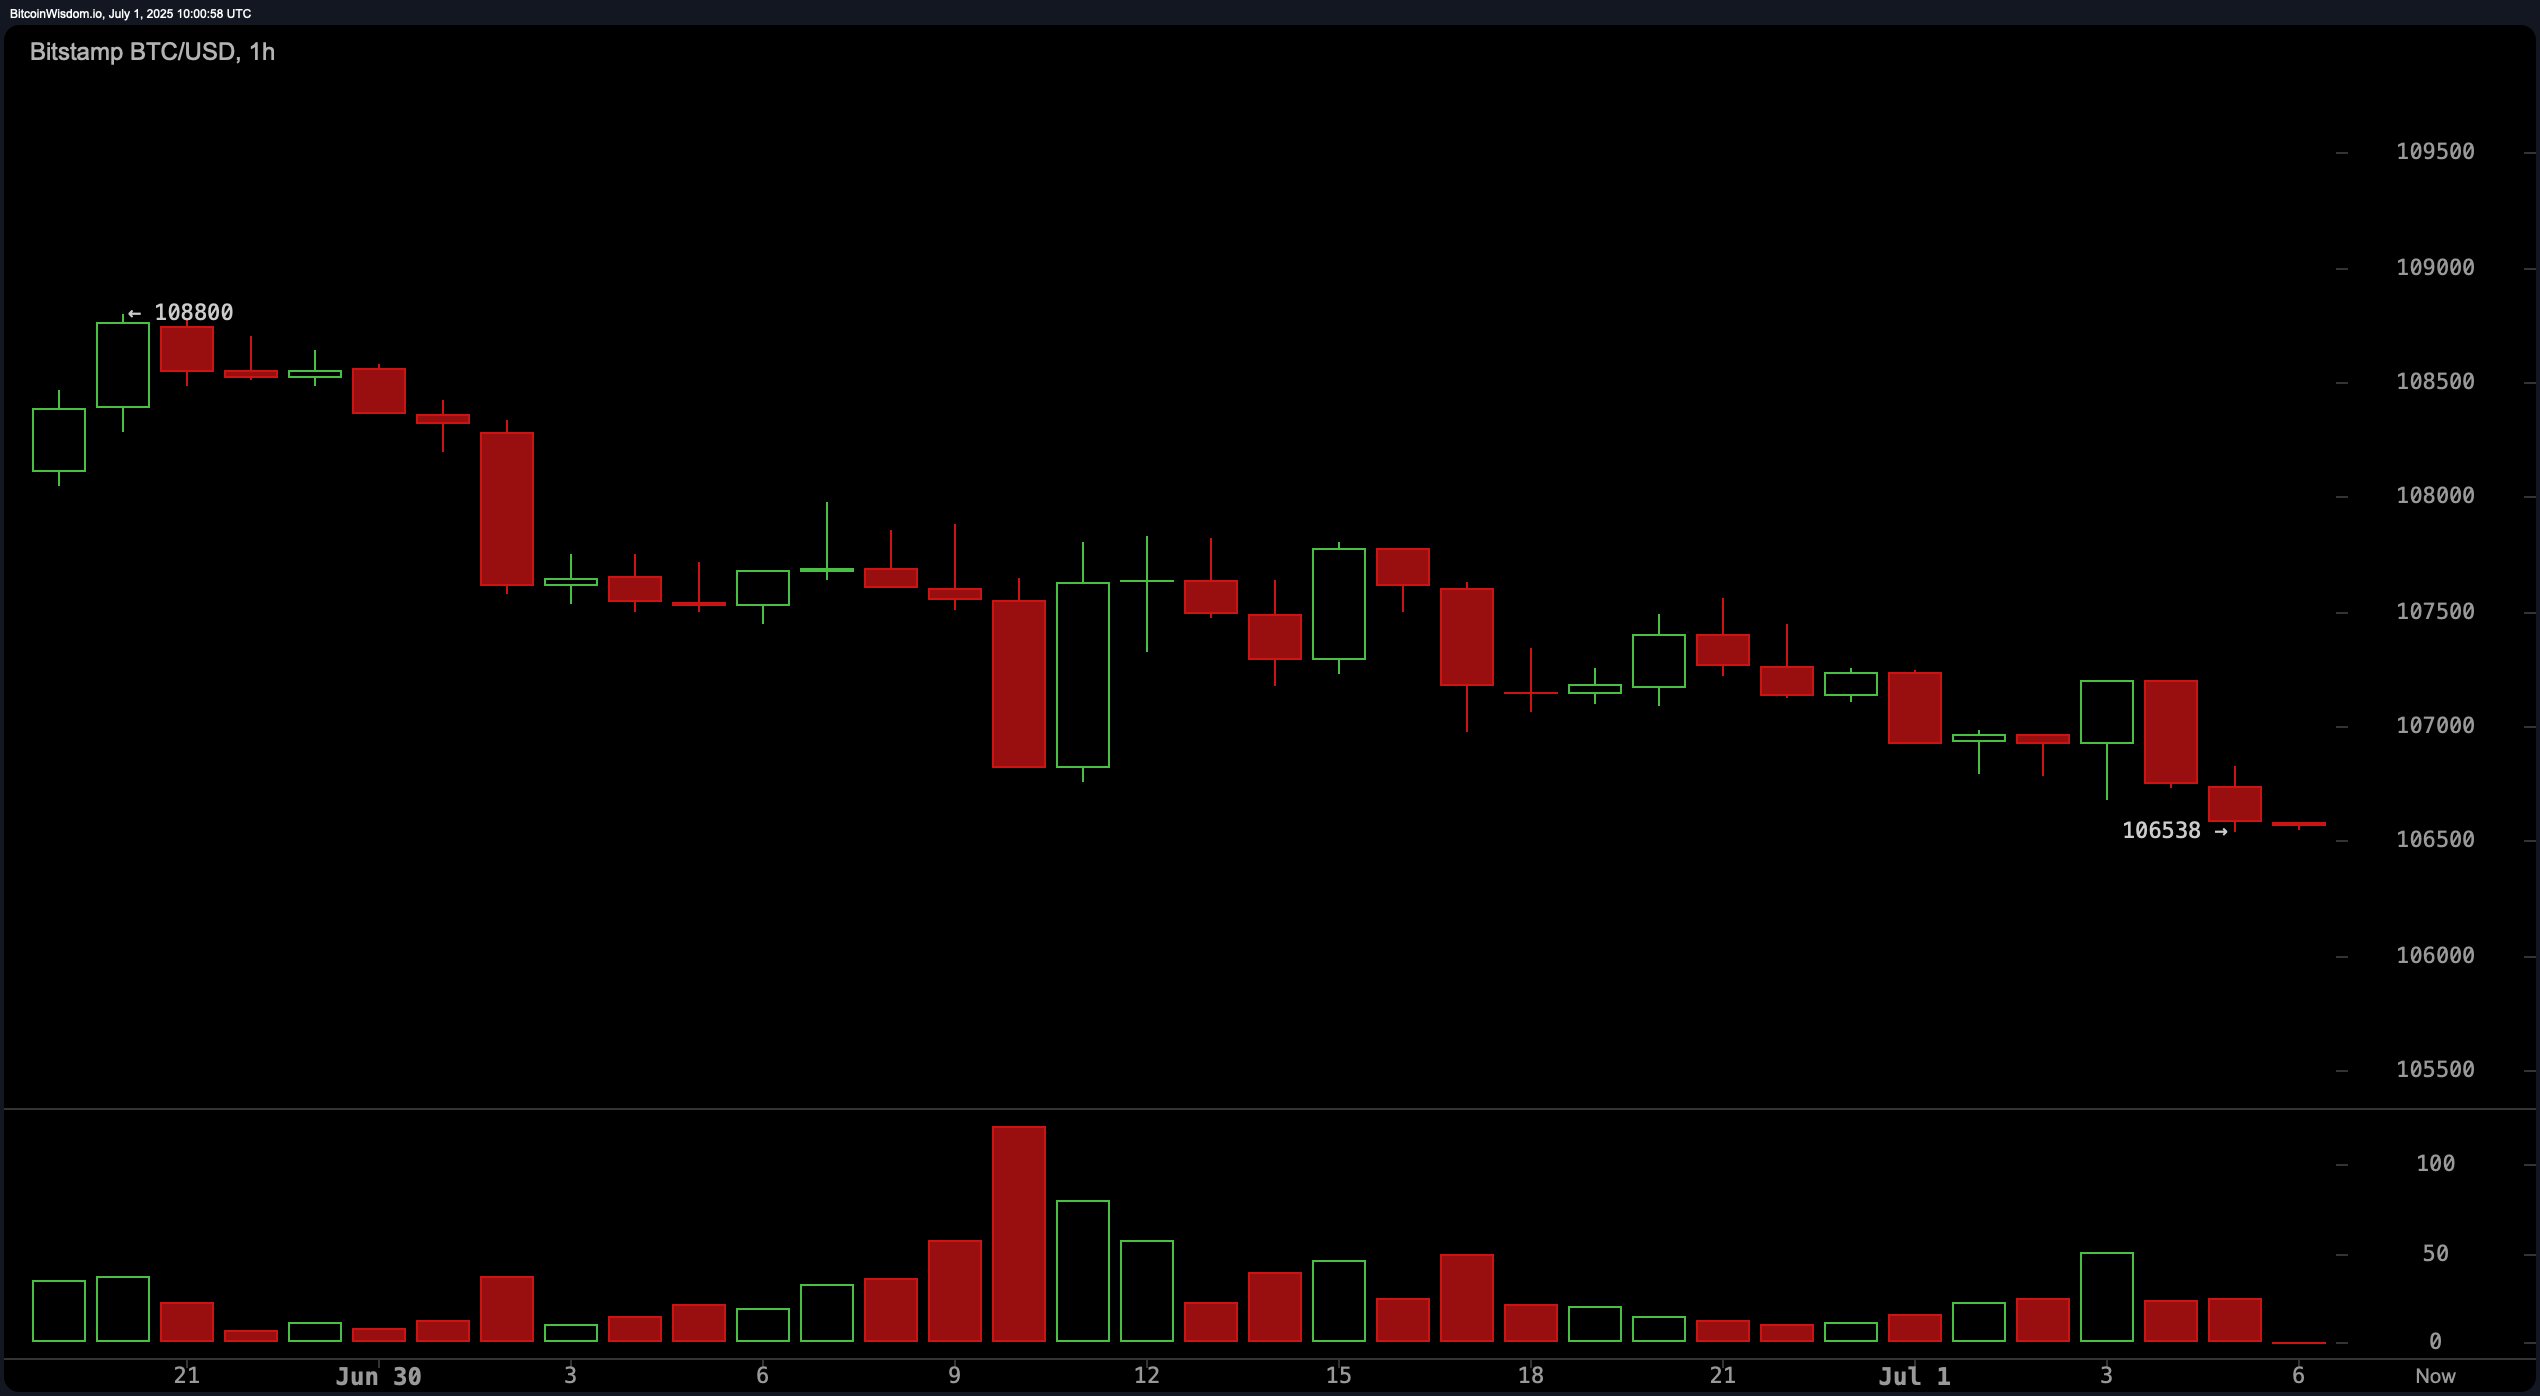
The 1-hour BTC/USD chart displays a clear downtrend originating from the recent $108,800 peak, marked by consistent lower highs and lower lows. Volume confirms the trend, with selling activity intensifying on red candles, pointing to persistent bearish pressure. Traders are eyeing weak intraday bounces between $107,500 and $108,000 as potential short entries, while considering $106,000 a near-term support threshold for exit strategies. The gradual decline lacks the velocity of panic selling but signals steady distribution. Unless momentum indicators shift significantly, the short-term outlook remains bearish.

Bitcoin Price Watch: Is Bitcoin Winding up for a Volatile July Surge?

BTC/USD 1-hour chart via Bitstamp on July 1, 2025.

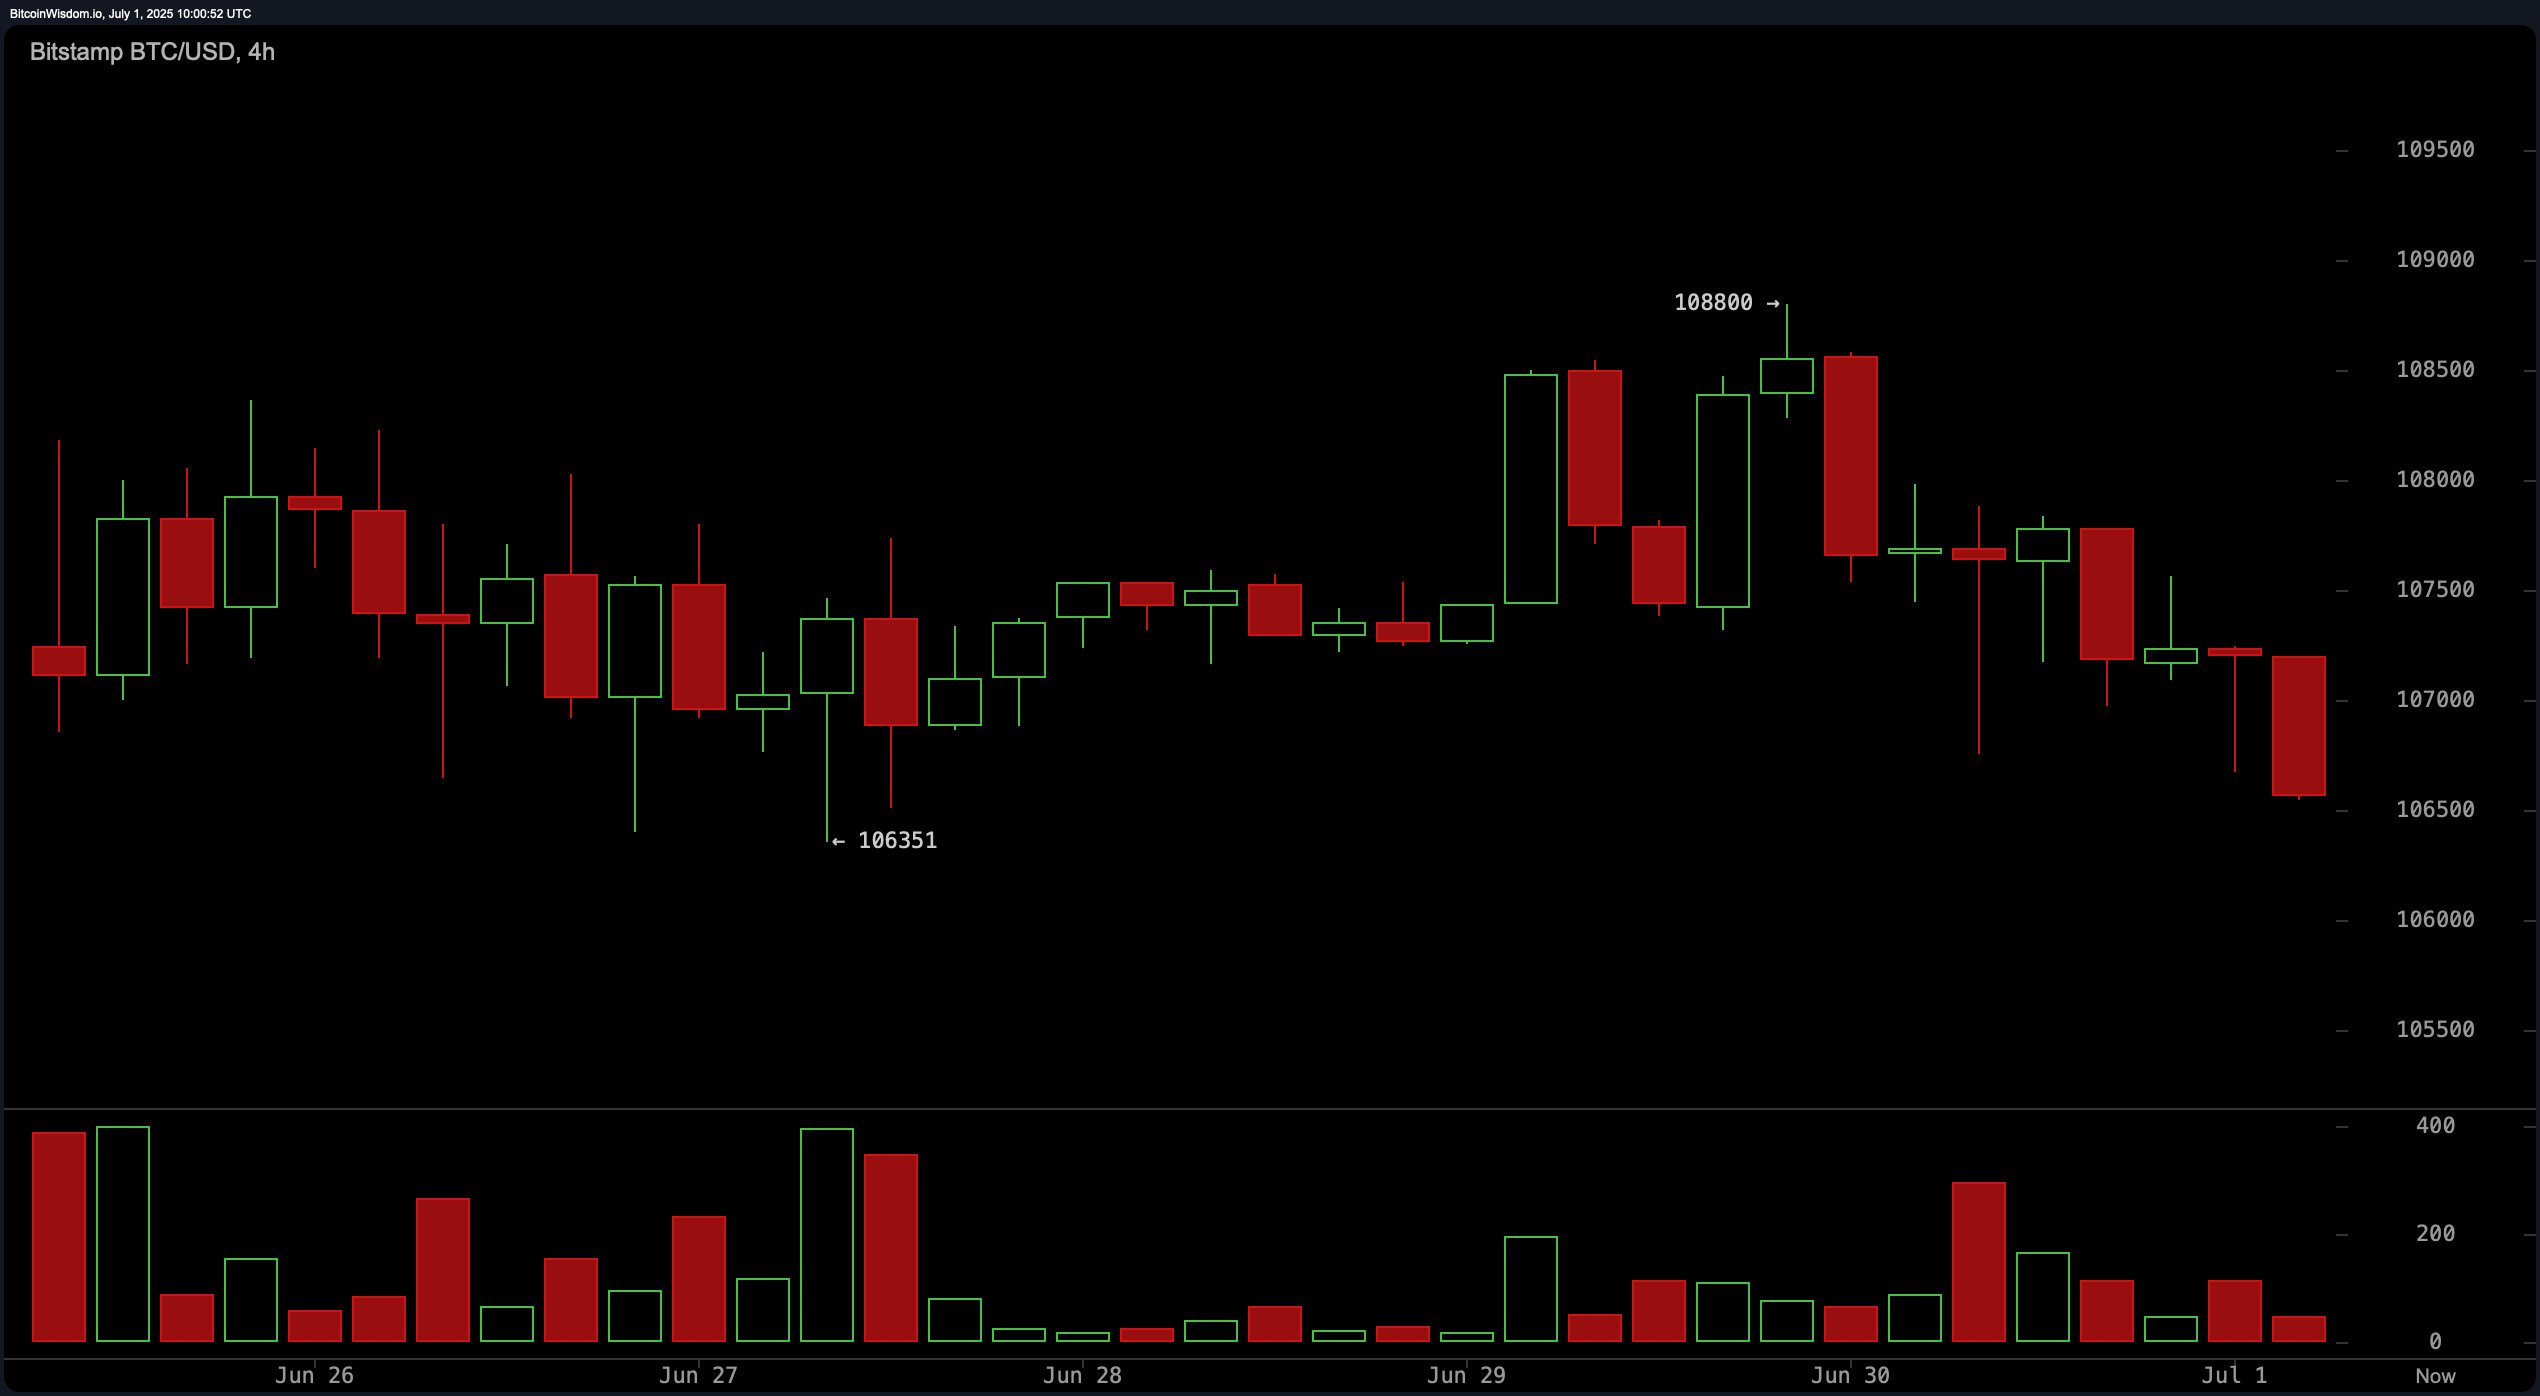
On the 4-hour chart, bitcoin appears range-bound after failing to hold the breakout above $108,800. Support has formed around $106,300, but the overall structure suggests indecision, evidenced by smaller candles and declining volume post-breakout. This cool-down phase could persist unless momentum improves meaningfully. Entry opportunities for scalpers may arise near the $106,000 mark, with profit-taking likely capped around $108,000 resistance. A breakdown below support would invite renewed bearish targeting of sub-$105,000 levels.

Bitcoin Price Watch: Is Bitcoin Winding up for a Volatile July Surge?

BTC/USD 4-hour chart via Bitstamp on July 1, 2025.

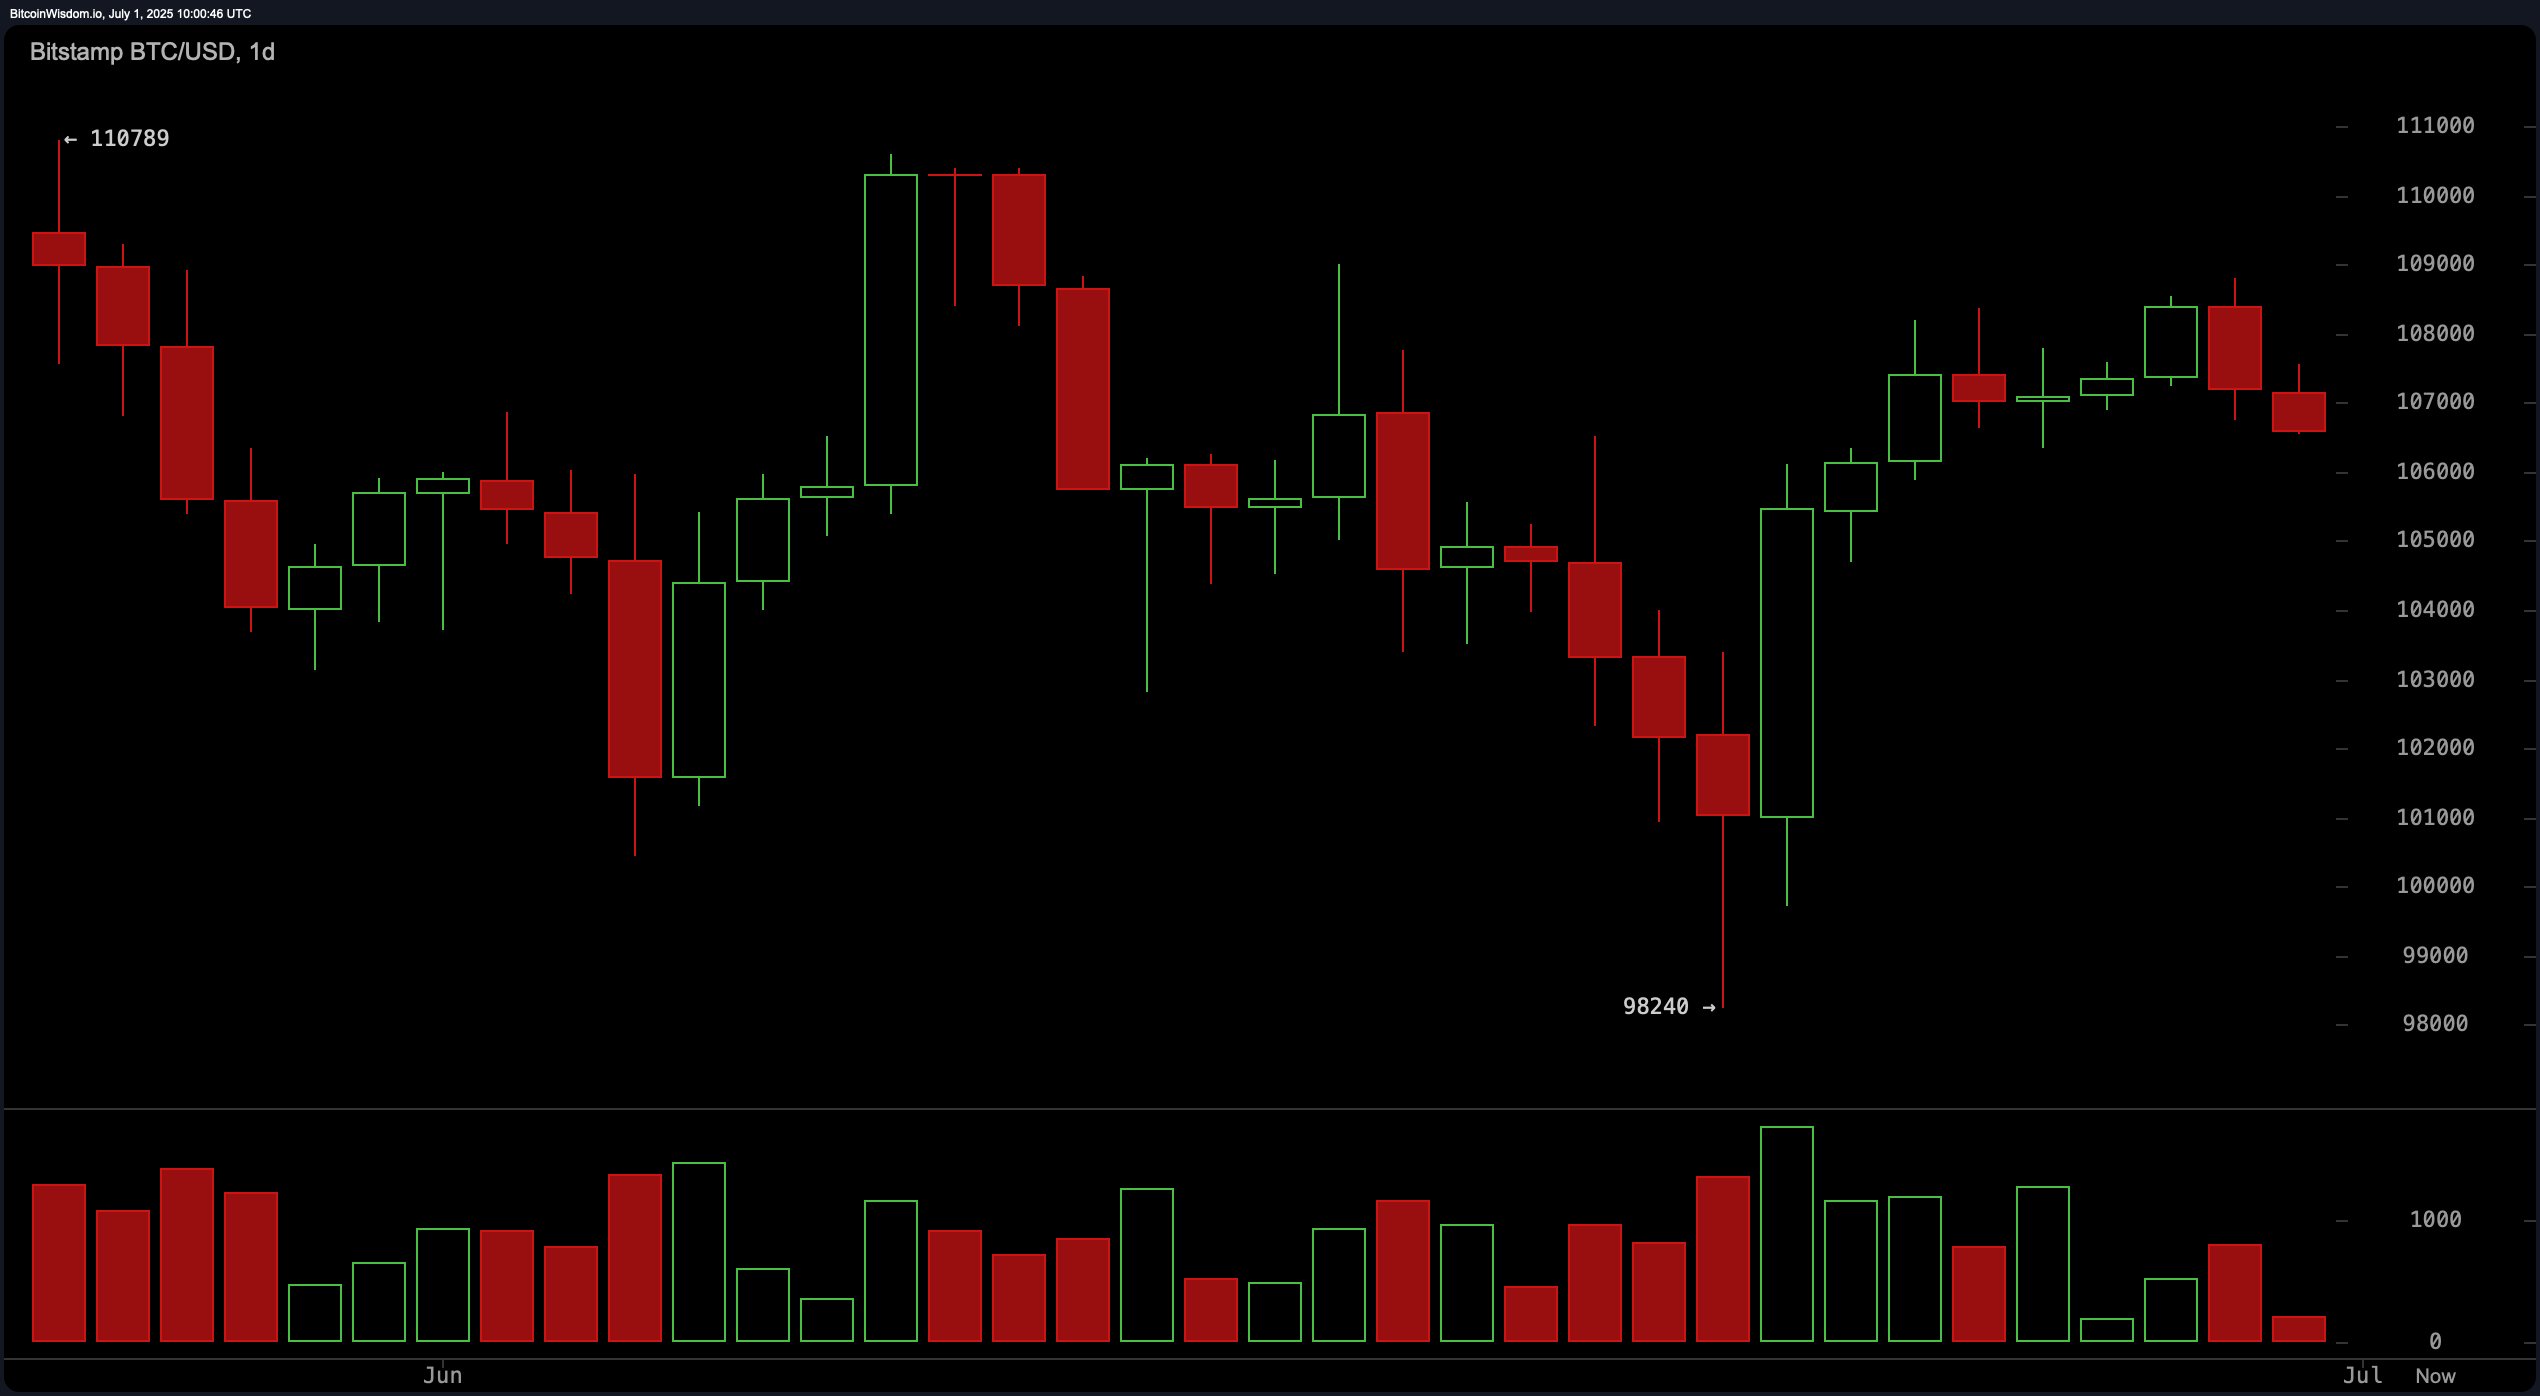
Bitcoin‘s daily chart portrays a broader consolidation phase after the rally peaked near $110,789, followed by a pullback to a recent low of $98,240. The rebound from that level indicates buying interest, yet sellers have consistently emerged near $108,000. A bearish engulfing pattern has developed, pointing to potential downside ahead if momentum fails to reclaim upper resistance. Traders are watching for entries in the $102,000–$103,000 range, while eyeing exits around $108,000–$110,000. A decisive break below $98,000 would likely accelerate selling pressure.

Bitcoin Price Watch: Is Bitcoin Winding up for a Volatile July Surge?

BTC/USD 1-day chart via Bitstamp on July 1, 2025.

Oscillator readings present a neutral-to-mixed picture. The relative strength index (RSI) stands at 52, signaling equilibrium, while the stochastic %K (14, 3, 3) reads 86, suggesting overbought conditions with a sell signal. The commodity channel index (CCI) at 58 and the average directional index (ADX) at 12 both indicate neutrality. Meanwhile, the momentum indicator at 4,462 and the MACD level (12, 26) at 557 points to residual bullish sentiment. This contrast highlights market indecision, favoring short-term trades over directional bets.

Moving averages (MAs) support a cautiously bullish long-term posture despite near-term weakness. The 10-period exponential moving average (EMA) at $106,607 issues a sell signal, while the 10-period simple moving average (SMA) at $106,367 indicates a buy. All longer-period moving averages—including the 20, 30, 50, 100, and 200-period EMAs and SMAs—issue buy signals, reflecting continued strength in the broader trend. These averages serve as dynamic support levels that could cap downside moves if bitcoin weakens further. Overall, the confluence of short-term bearish action and long-term bullish structure suggests tactical flexibility for traders.

Bull Verdict:

If bitcoin holds the $106,000 support and buyers re-enter around the $102,000–$103,000 zone, the longer-term uptrend supported by bullish moving averages could resume. A break above $108,000 may open the path toward retesting $110,000 and ultimately $111,000, reinforcing the bullish structure evident on higher timeframes.

Bear Verdict:

If the $106,000 support fails to hold, technical indicators suggest a decline toward the $103,000–$100,000 range is likely. Continued selling pressure, confirmed by oscillator weakness and bearish intraday structure, could accelerate downside momentum, especially if $98,000 is breached, invalidating bullish setups for bitcoin in the near term.

免责声明:本文章仅代表作者个人观点,不代表本平台的立场和观点。本文章仅供信息分享,不构成对任何人的任何投资建议。用户与作者之间的任何争议,与本平台无关。如网页中刊载的文章或图片涉及侵权,请提供相关的权利证明和身份证明发送邮件到support@aicoin.com,本平台相关工作人员将会进行核查。

ad
Gate: 注册赢取$10000+礼包
Ad
Share To
APP

X

Telegram

Facebook

Reddit

CopyLink