Shiba Inu is at another turning point, and the chart's price action suggests that the asset is looking for a spark. SHIB is currently trading just below a crucial resistance level, the 26 EMA, following weeks of declining prices with intermittent attempts at recovery. The 26-day Exponential Moving Average has historically been a key level for determining SHIB's momentum.
Sellers have regained control and forced the asset back into a downward trend each time the price has come close to this dynamic resistance. The 26 EMA has rejected price advances several times since early June and is currently trading around the $0.0000119 mark.
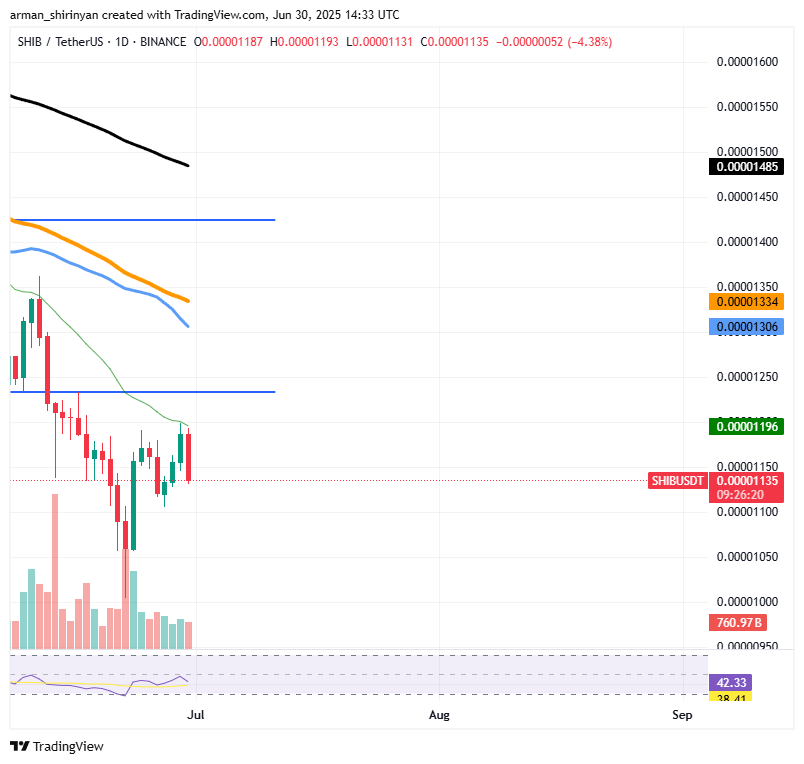
SHIB/USDT Chart by TradingView
The chart confirms that the overall trend is still bearish by displaying a distinct pattern of lower highs and lower lows. Additionally, volatility has decreased significantly, which is frequently a sign of a decisive move. However, in the absence of new buying pressure, there is a greater chance that the breakout will be negative. The market has not yet recovered its confidence, as indicated by the RSI's trend in the lower half of the neutral zone. At best, the volume is still neutral.
HOT Stories Shiba Inu (SHIB) Needs This Now, This Bitcoin (BTC) Signal Not Great, XRP: First Time in History? $56 Million in XRP Enters Biggest US Crypto Exchange Coinbase Legendary Trader Who Predicted XRP's 2024 Rally Says It Might Be Time for 'Round 2' Shocking Crypto Heist Takes Place in Mall Parking Lot
You Might Also Like

Mon, 06/30/2025 - 14:25 Just In: XRP Ledger Ethereum Sidechain Now Live ByTomiwabold Olajide
Trading activity has increased significantly, even during recent relief rallies, which supports the notion that SHIB is having trouble generating steady demand. Bulls will not compromise on regaining the 26 EMA. SHIB would give the first clear indication in weeks that sellers are losing ground and that momentum may be changing if it could close firmly above this moving average.
There is no solid proof that the token can withstand a reversal until this resistance is overcome. In the event that the 26 EMA is not broken, traders should keep a close eye on the market, as this could lead to further declines in Shiba Inu prices. For the time being, SHIB must overcome this obstacle or risk further decline.
Bitcoin's chance
The price movement of Bitcoin keeps luring traders with the prospect of a breakout, but the truth is much less compelling. Bitcoin is pinned beneath a distinct descending trendline on the daily chart, which has capped each of the most recent rallies. Right now, the price ranges between $107,000 and $108,000, with the upper limit serving as a recalcitrant ceiling.
It appears at first that Bitcoin is preparing for a significant upward move. The steady sequence of higher lows and the trendline squeeze point to increasing pressure. However, if you look closer, the image becomes less appealing. Instead of any significant inflows of fresh capital, forced short liquidations have been the main driver of this rally. Instead of a structural change in sentiment, we are merely witnessing tactical positioning.
You Might Also Like

Mon, 06/30/2025 - 14:04 Binance to Suspend Polygon Withdrawals on This Date: Here's Why ByTomiwabold Olajide
The same can be said for volume: it is flat and uninspired. The surge of demand that Bitcoin needs for a real breakout is not happening. Until then the current squeeze appears to be more of a setup for profit-taking than a long-term upswing.
What's the plan for Bitcoin? Right now the market is at a standstill. The 50 and 100-day EMAs' support keeps the price afloat, and the structure is still technically sound. However, there is still a lot of space for profit-taking at these levels. Sellers will probably regain control and drive Bitcoin back into the $100,000-$105,000 range if new buyers do not intervene quickly.
This move does not indicate the beginning of a new macro uptrend. In the absence of volume confirmation and greater buyer conviction, it is safer to regard this as a short squeeze as opposed to a clear breakout. Caution is advised until the opposite is demonstrated. This signal is weak, and it could be expensive to ignore that fact.
XRP sleeping
XRP is moving into uncharted territory, and not in a good way. Around the $2 mark, XRP is locked in an exceptionally tight sideways channel for the first time in its trading history. XRP has a history of explosive volatility, whether it is soaring to new heights or crashing dramatically. However, even experienced market participant have never witnessed this protracted stasis for the asset.
Price action has hardly moved outside of the 50-day and 100-day exponential moving averages, which have pinned XRP for the past few weeks. Both the trading volume and volatility indicators have been steadily declining. This depicts a market in which it seems as though neither bulls nor bears are willing or able to make a bold move. This lack of involvement is alarming.
You Might Also Like

Mon, 06/30/2025 - 13:20 Ethereum (ETH) Death Cross Warning: Is It Too Soon to Panic? ByTomiwabold Olajide
If sideways consolidations follow significant rallies, they can be beneficial because they give markets a chance to regroup before the subsequent leg up. But there has not been a noticeable uptrend in XRP. This sluggish behavior instead feels like fatigue. It appears that traders are no longer convinced that a sharp correction or a bullish breakout is on the horizon.
Since there is not any significant momentum to rely on, the likelihood of an upward move is reduced. This trading pattern admits from a psychological perspective that neither buyers nor sellers have a compelling story. Institutional flows have shifted, and retail interest has vanished. Most likely, XRP will continue to grind sideways until it can recover levels above the 200 EMA or exhibit a volume surge.
免责声明:本文章仅代表作者个人观点,不代表本平台的立场和观点。本文章仅供信息分享,不构成对任何人的任何投资建议。用户与作者之间的任何争议,与本平台无关。如网页中刊载的文章或图片涉及侵权,请提供相关的权利证明和身份证明发送邮件到support@aicoin.com,本平台相关工作人员将会进行核查。


