The effects of the ceasefire between Israel and Iran seems to have already been digested by traders as markets today cool down after big jumps earlier this week. Only two coins (Pi and Maple Finance) are up more than 10% with the average price appreciation in the top 100 coins by market cap being around 2%, and the average dip around that mark too.
But crypto traders are pushing upwards: total cryptocurrency market cap across the sector is up to $3.283 trillion, a modest 0.81% daily increase.
Traditional markets also remained relatively stable with the S&P 500 rising slightly to 6,097 points, gaining 0.07% from the previous session. The Federal Reserve's decision to maintain interest rates at 4.25%-4.5% continues to create a wait-and-see environment, with Fed Chair Jerome Powell stating the central bank is "well positioned to wait" for more economic clarity. Looking ahead, traders on Myriad—a prediction market developed by Decrypt's parent company Dastan—currently believe the Nasdaq will outperform the S&P 500 in the month of June.
Meanwhile, some coins are—as usual—doing better than others today, with Bitcoin Cash and Cardano traders making moves—perhaps with the urge to feel something on an otherwise boring markets day.
Bitcoin Cash (BCH) breaking out
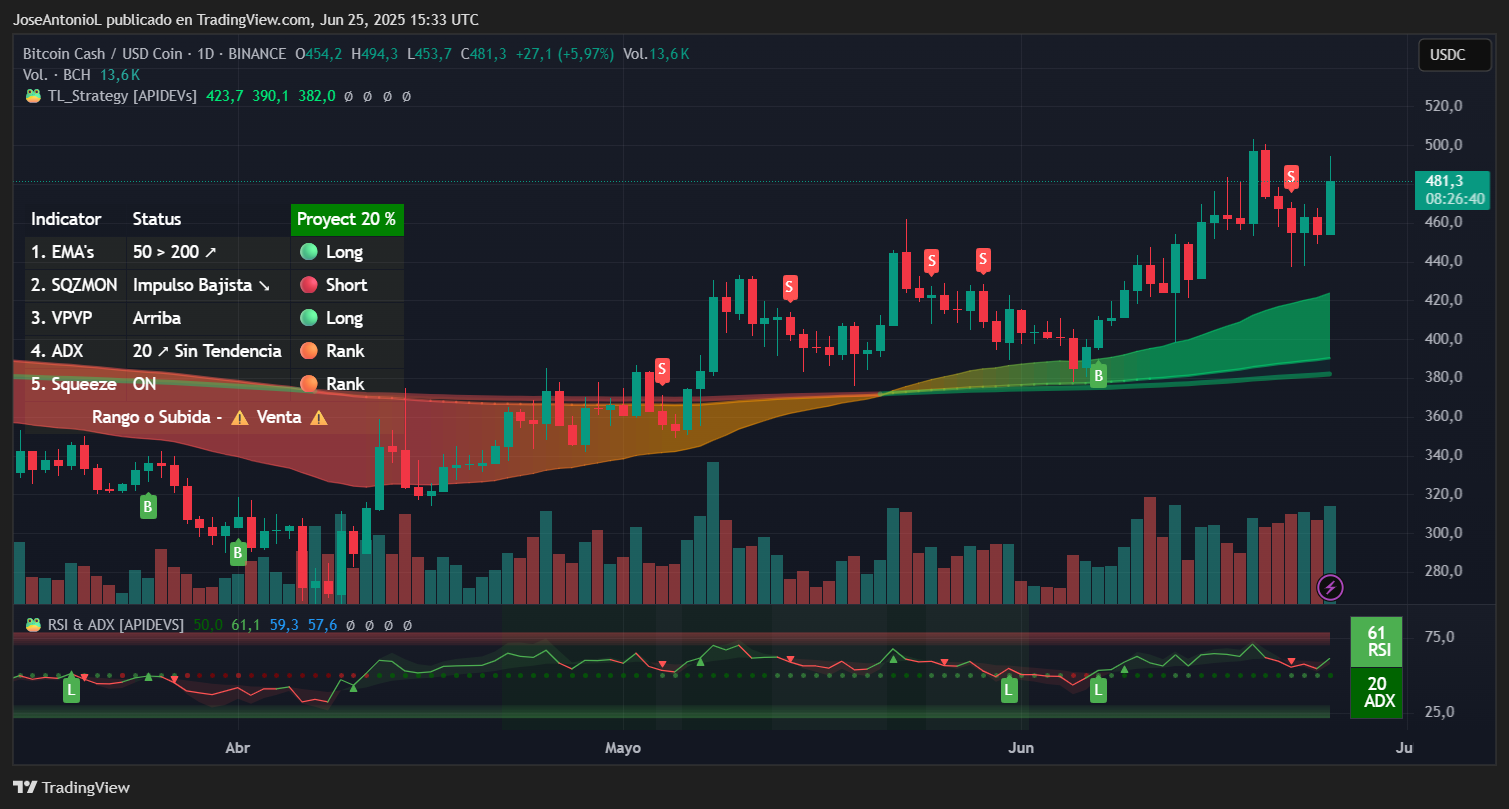
Bitcoin Cash trading data. Image: TradingView
Bitcoin Cash, the original fork of the original Bitcoin, demonstrated its strength today, surging approximately 6% to $481.30 as it successfully breached the critical $470 resistance level that had capped prices throughout most of the month. This breakout came with substantial trading volume and multiple bullish technical confirmations.
The Relative Strength Index, or RSI, sits at a healthy 61, indicating strong bullish momentum without reaching overbought territory. This reading suggests buyers are in control, but there's still room for further upside before hitting the typical 70+ overbought threshold where profit-taking often occurs. The RSI measures the speed and magnitude of price changes, and readings between 50-70 are generally considered bullish momentum zones.
The Average Directional Index, or ADX, reads 20, just below the crucial 25 threshold that confirms established trend strength. While this indicates the trend is weak and still developing rather than fully established, the rising trajectory suggests momentum is building toward a more decisive breakout. The ADX measures trend strength regardless of direction—readings above 25 typically signal strong trending conditions that traders often follow.
Moving Average Configuration: BCH is trading well above both its 50-day EMA (around $385) and 200-day EMA (near $352), creating a widening gap known as the "moving average divergence." This growing separation signals a strong, sustained trend. The 50-day EMA, averaging prices over roughly 2.5 months, often acts as dynamic support in an uptrend, while the 200-day EMA reflects the broader market direction. With the 50-day EMA above the 200-day, short-term momentum is outpacing the longer-term trend—recent buyers are paying significantly more than those who entered 200 days ago, and the expanding distance between the two lines suggests that buying pressure remains intense.
The Squeeze Momentum Indicator shows "ON" status with an upward trajectory, suggesting price compression is being released to the upside. This indicator identifies periods when volatility contracts before major moves—the "ON" reading indicates the squeeze is active and momentum is building. This is not definitive, but suggest caution, either with a strong price break in a positive direction, or a heavy correction to come.
Overall, BCH is going up, but it's possible that traders interpret its current zone as a tough one with indicators giving mixed signals.
Key Levels:
- Immediate support: $460-$470 (recent breakout zone now becomes support)
- Strong support: $385 (50-day EMA)
- Immediate resistance: $500 (psychological level and next major barrier)
- Strong resistance: $540 (measured move target from recent consolidation)
Cardano (ADA) breaks down
Are Cardano dudes even into Cardano anymore? During his most recent livestream, Cardano founder Charles Hoskinson proposed the Cardano Treasury get rid of nearly $100 million worth of ADA to buy a basket of stablecoins alongside Bitcoin and other synthetic assets.
Take this however you want. This is either a good sign for the network, as it helps increase DeFi liquidity and further decentralize the structure for long-term ecosystem growth, or the team doesn’t want the risk of hodling a coin that has not had a true bullish cycle since 2021.
Cardano (ADA) trading data. Image: TradingView
During the last 24 hours, markets seem to have taken the news with bitterness. ADA experienced a stark 3.5% drop to $0.5669 as multiple technical indicators flashed bearish signals.
The price action suggests ADA is struggling to maintain key support levels amid broader altcoin weakness.
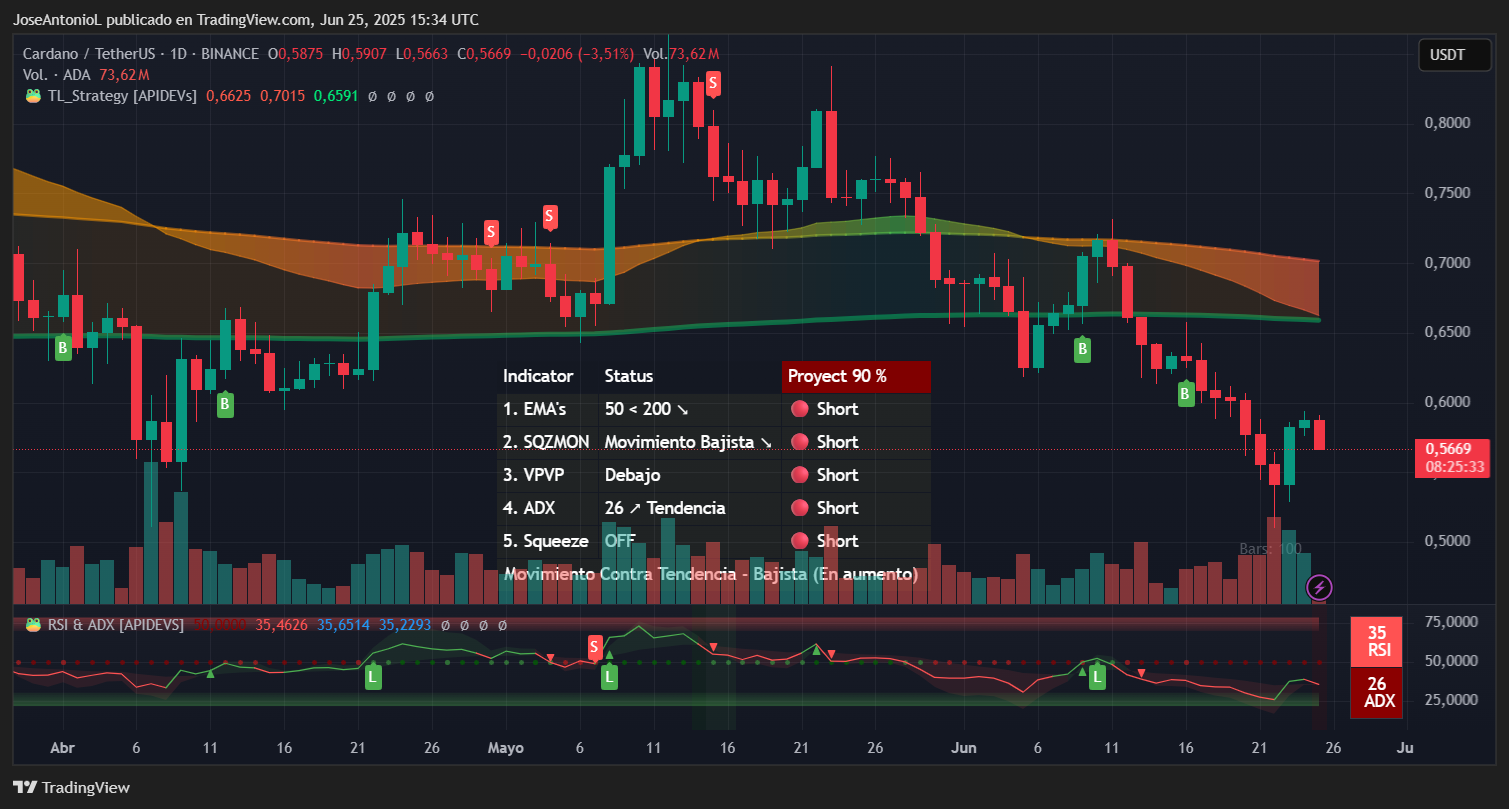
Cardano (ADA) trading data. Image: TradingView
The RSI has dropped to 35, approaching oversold territory below 30 but not yet there. This reading indicates selling pressure is intensifying, and while oversold conditions could eventually trigger a relief bounce, the downward momentum suggests more weakness may be ahead. RSI readings below 40 often indicate bearish momentum, especially when accompanied by other negative signals.
The ADX registers 26, confirming a strong trend is in place. However, with the price declining, this strong ADX reading actually confirms the bearish trend's strength rather than supporting a bullish case. This is why technical analysts always examine ADX alongside price direction—a high ADX with falling prices indicates strong downward momentum.
ADA trades below both its 50-day and 200-day EMAs, with the indicators showing a concerning pattern. The price trading below both moving averages suggests the trend has shifted bearish across multiple timeframes. When shorter-term averages fall below longer-term ones, it typically indicates sustained selling pressure and loss of investor confidence.
The Squeeze Momentum Indicator shows "OFF" status with negative momentum, indicating recent volatility has been released to the downside and further compression may be limited. This often translates to continued directional movement—in this case, potentially more downside.
Key Levels:
- Immediate support: $0.5500 (psychological level and potential bounce zone)
- Strong support: $0.5000 (major psychological level)
- Immediate resistance: $0.5900 (must reclaim to signal recovery)
- Strong resistance: $0.6400 (50-day EMA area that would indicate trend reversal)
The views and opinions expressed by the author are for informational purposes only and do not constitute financial, investment, or other advice.
免责声明:本文章仅代表作者个人观点,不代表本平台的立场和观点。本文章仅供信息分享,不构成对任何人的任何投资建议。用户与作者之间的任何争议,与本平台无关。如网页中刊载的文章或图片涉及侵权,请提供相关的权利证明和身份证明发送邮件到support@aicoin.com,本平台相关工作人员将会进行核查。


