在日线图上,比特币在从112,000美元水平被拒绝后显示出明显的看跌偏向。在该高点附近形成的双顶形态导致了一系列持续的低高点和低低点,主导的卖出量进一步加强了下行趋势。目前的支撑位稳固在100,000到102,000美元区间,而阻力则重压在108,000到110,000美元附近。如果价格收盘低于100,000美元的阈值,将发出结构性破裂的信号,尽管目前价格走势表明谨慎的整合。
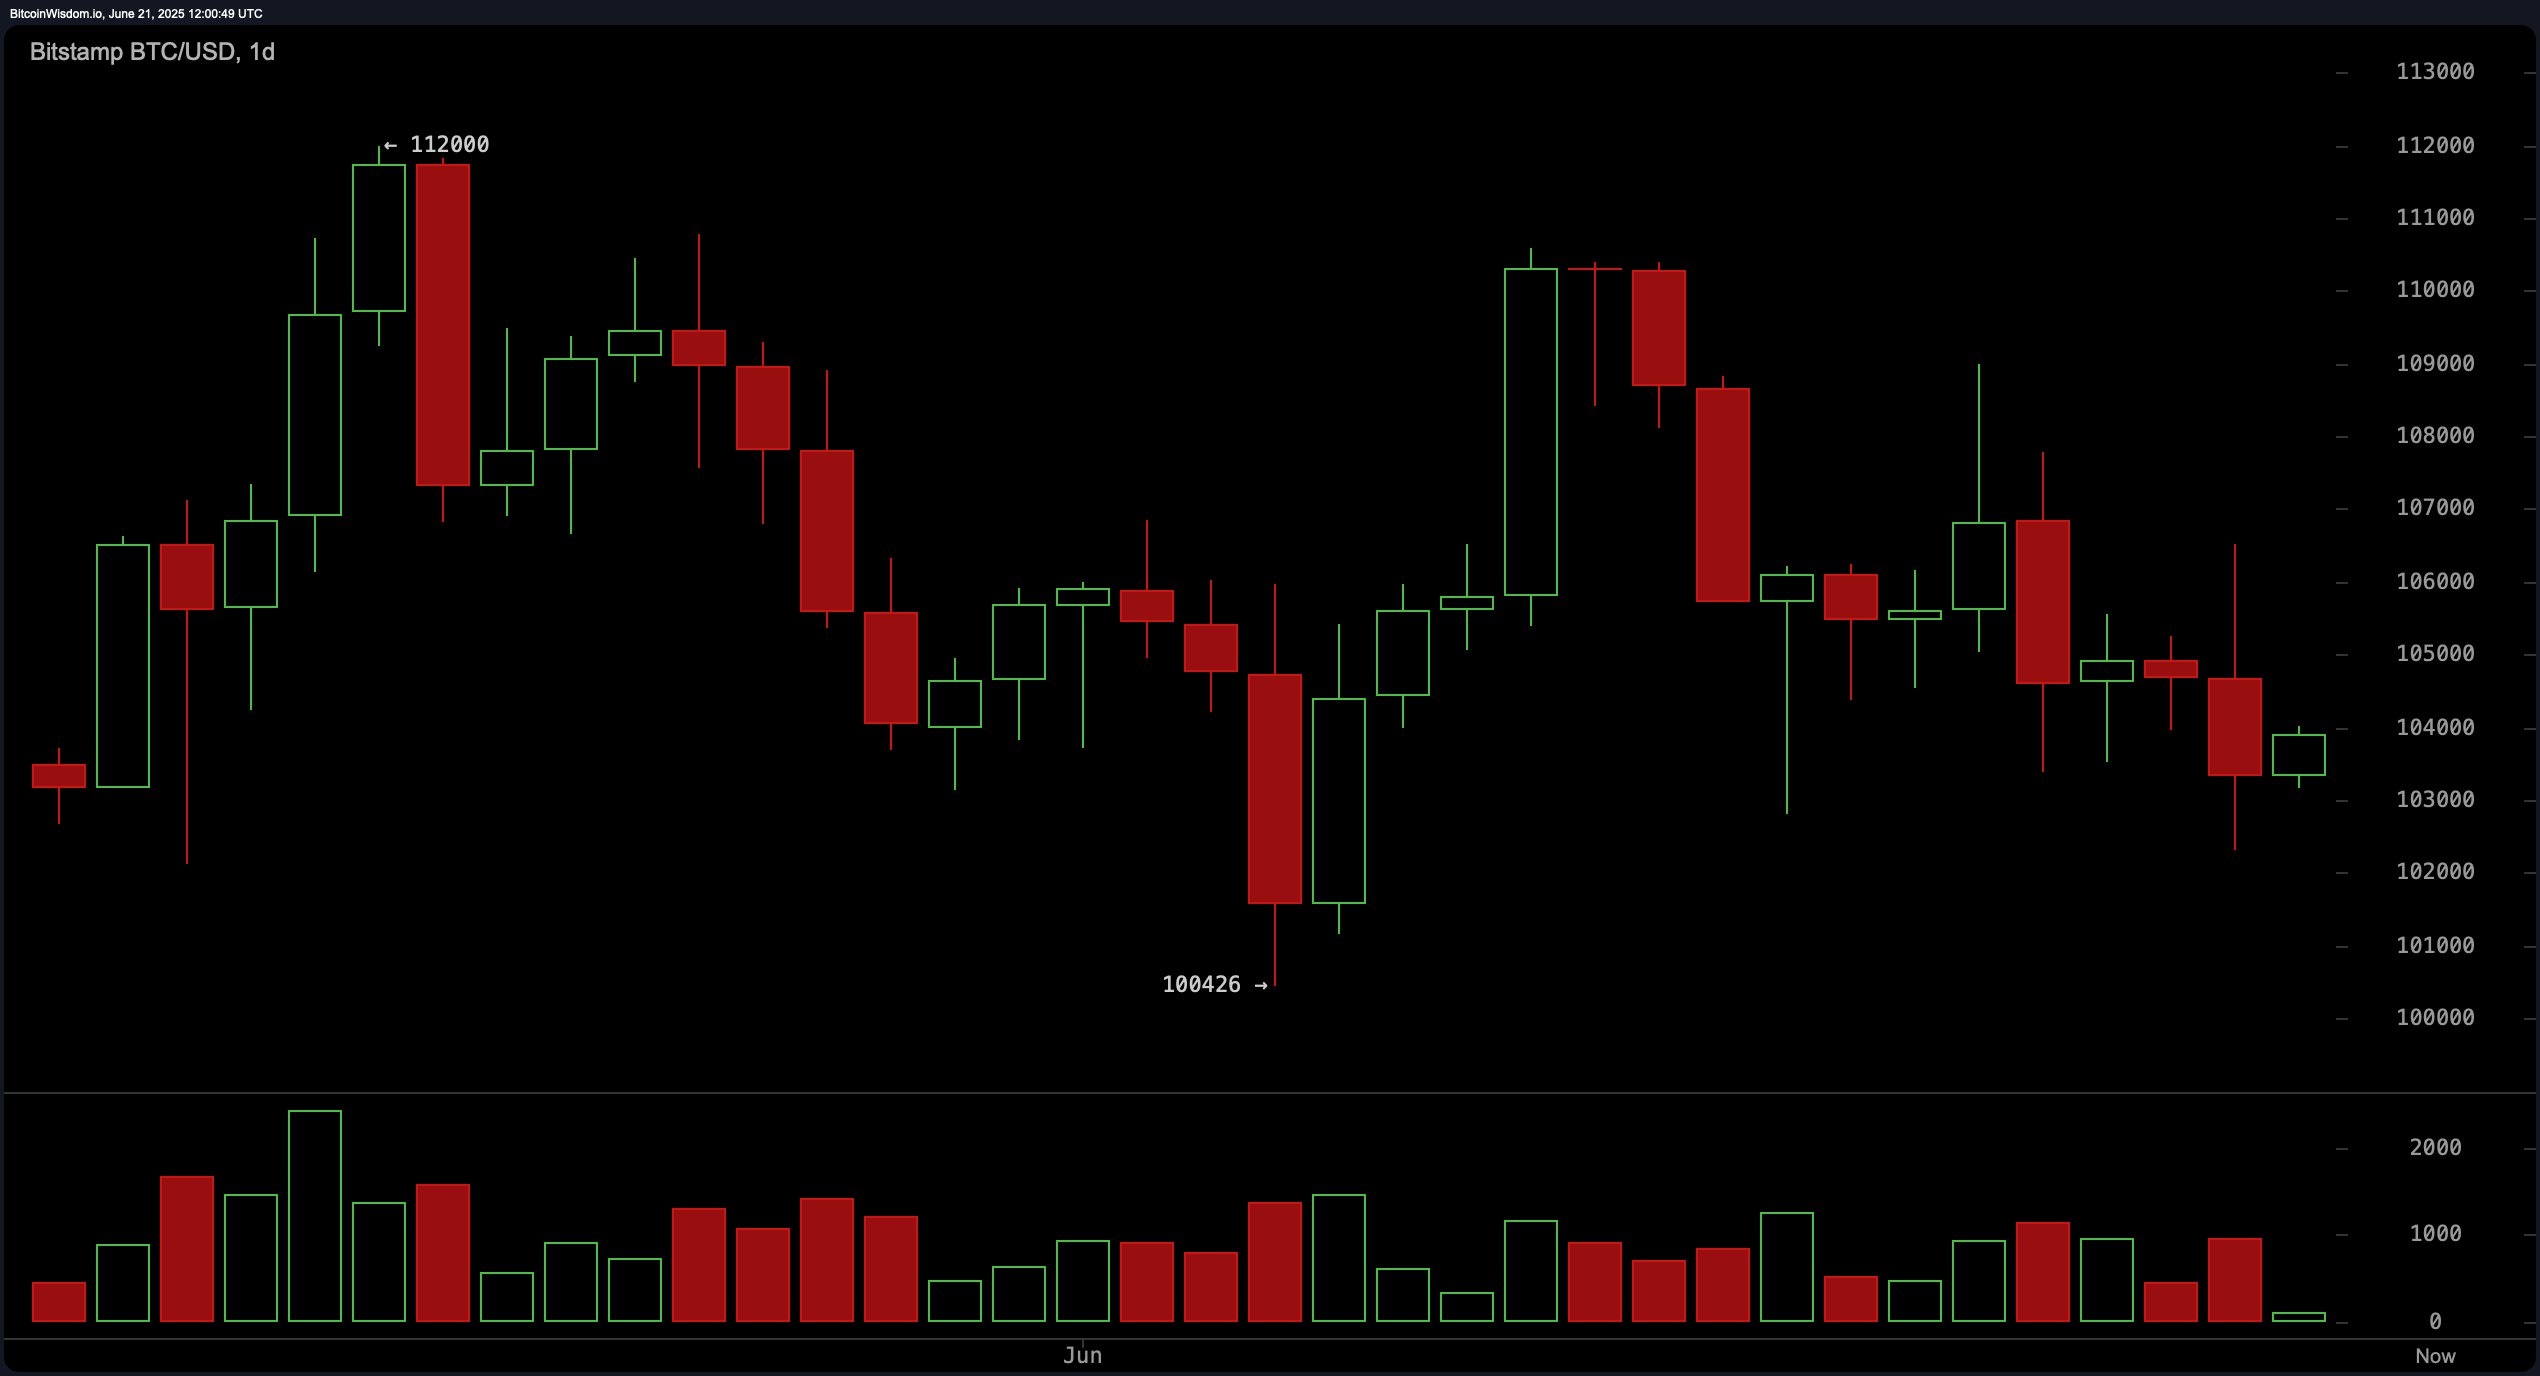
2025年6月21日通过Bitstamp的BTC/USD日线图。
从中期的4小时图来看,比特币在108,990美元附近被拒绝后继续描绘下行模式。它在102,309美元找到了暂时支撑,这一水平经历了几次防守。在这个时间窗口内的价格走势类似于熊旗或下行通道,这两者都暗示现有下行趋势的延续。卖出时的成交量激增表明了投降事件或基于清算的动作。交易者关注如果价格重新回到102,300–103,000美元的潜在反弹,尽管在106,000–107,000美元附近的上行仍然受到限制,除非成交量明确支持反转。
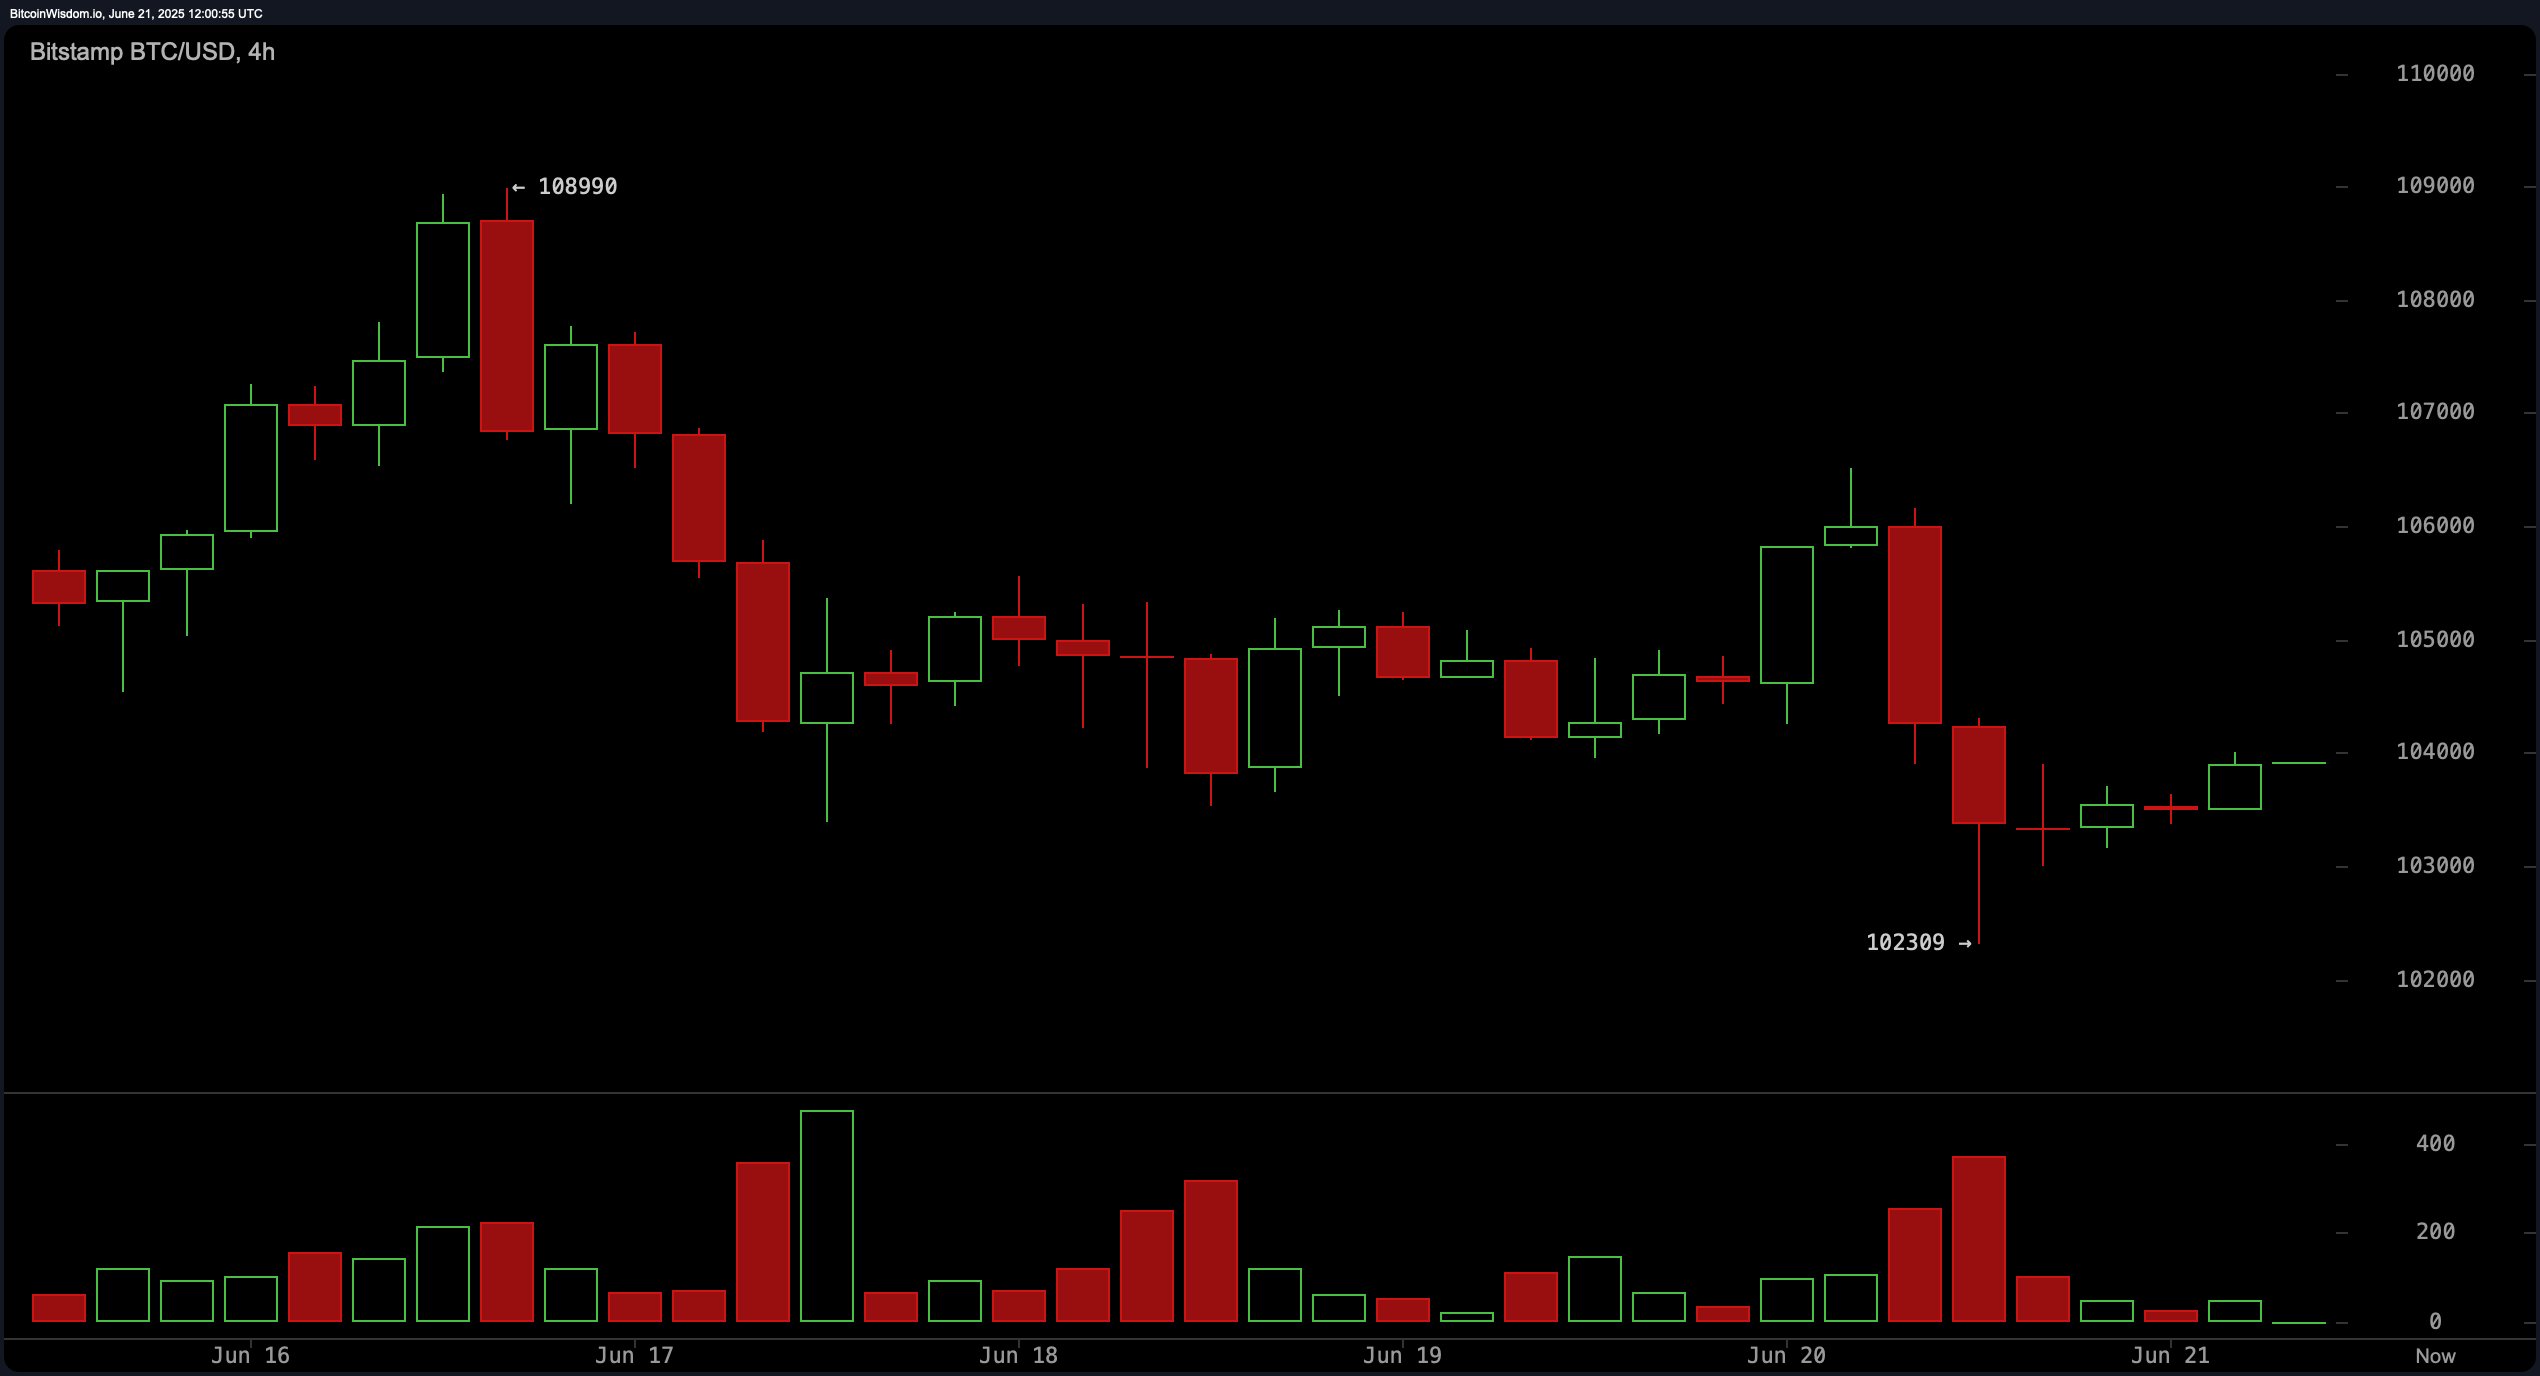
2025年6月21日通过Bitstamp的BTC/USD 4小时图。
在1小时比特币图表上反映的日内活动显示出停滞的区间交易。局部低点再次触及102,309美元,高点标记在106,521美元。动能显著减弱,价格在一个狭窄的区间内波动,没有明确的信心。随着成交量的减少,当前水平的多头和空头似乎都显得犹豫不决。短期内在102,500–103,000美元之间的回调可能会出现剥头皮机会,目标退出在104,000–105,000美元附近。然而,任何小时收盘低于103,000美元可能会使局势倾向于另一个看跌阶段。
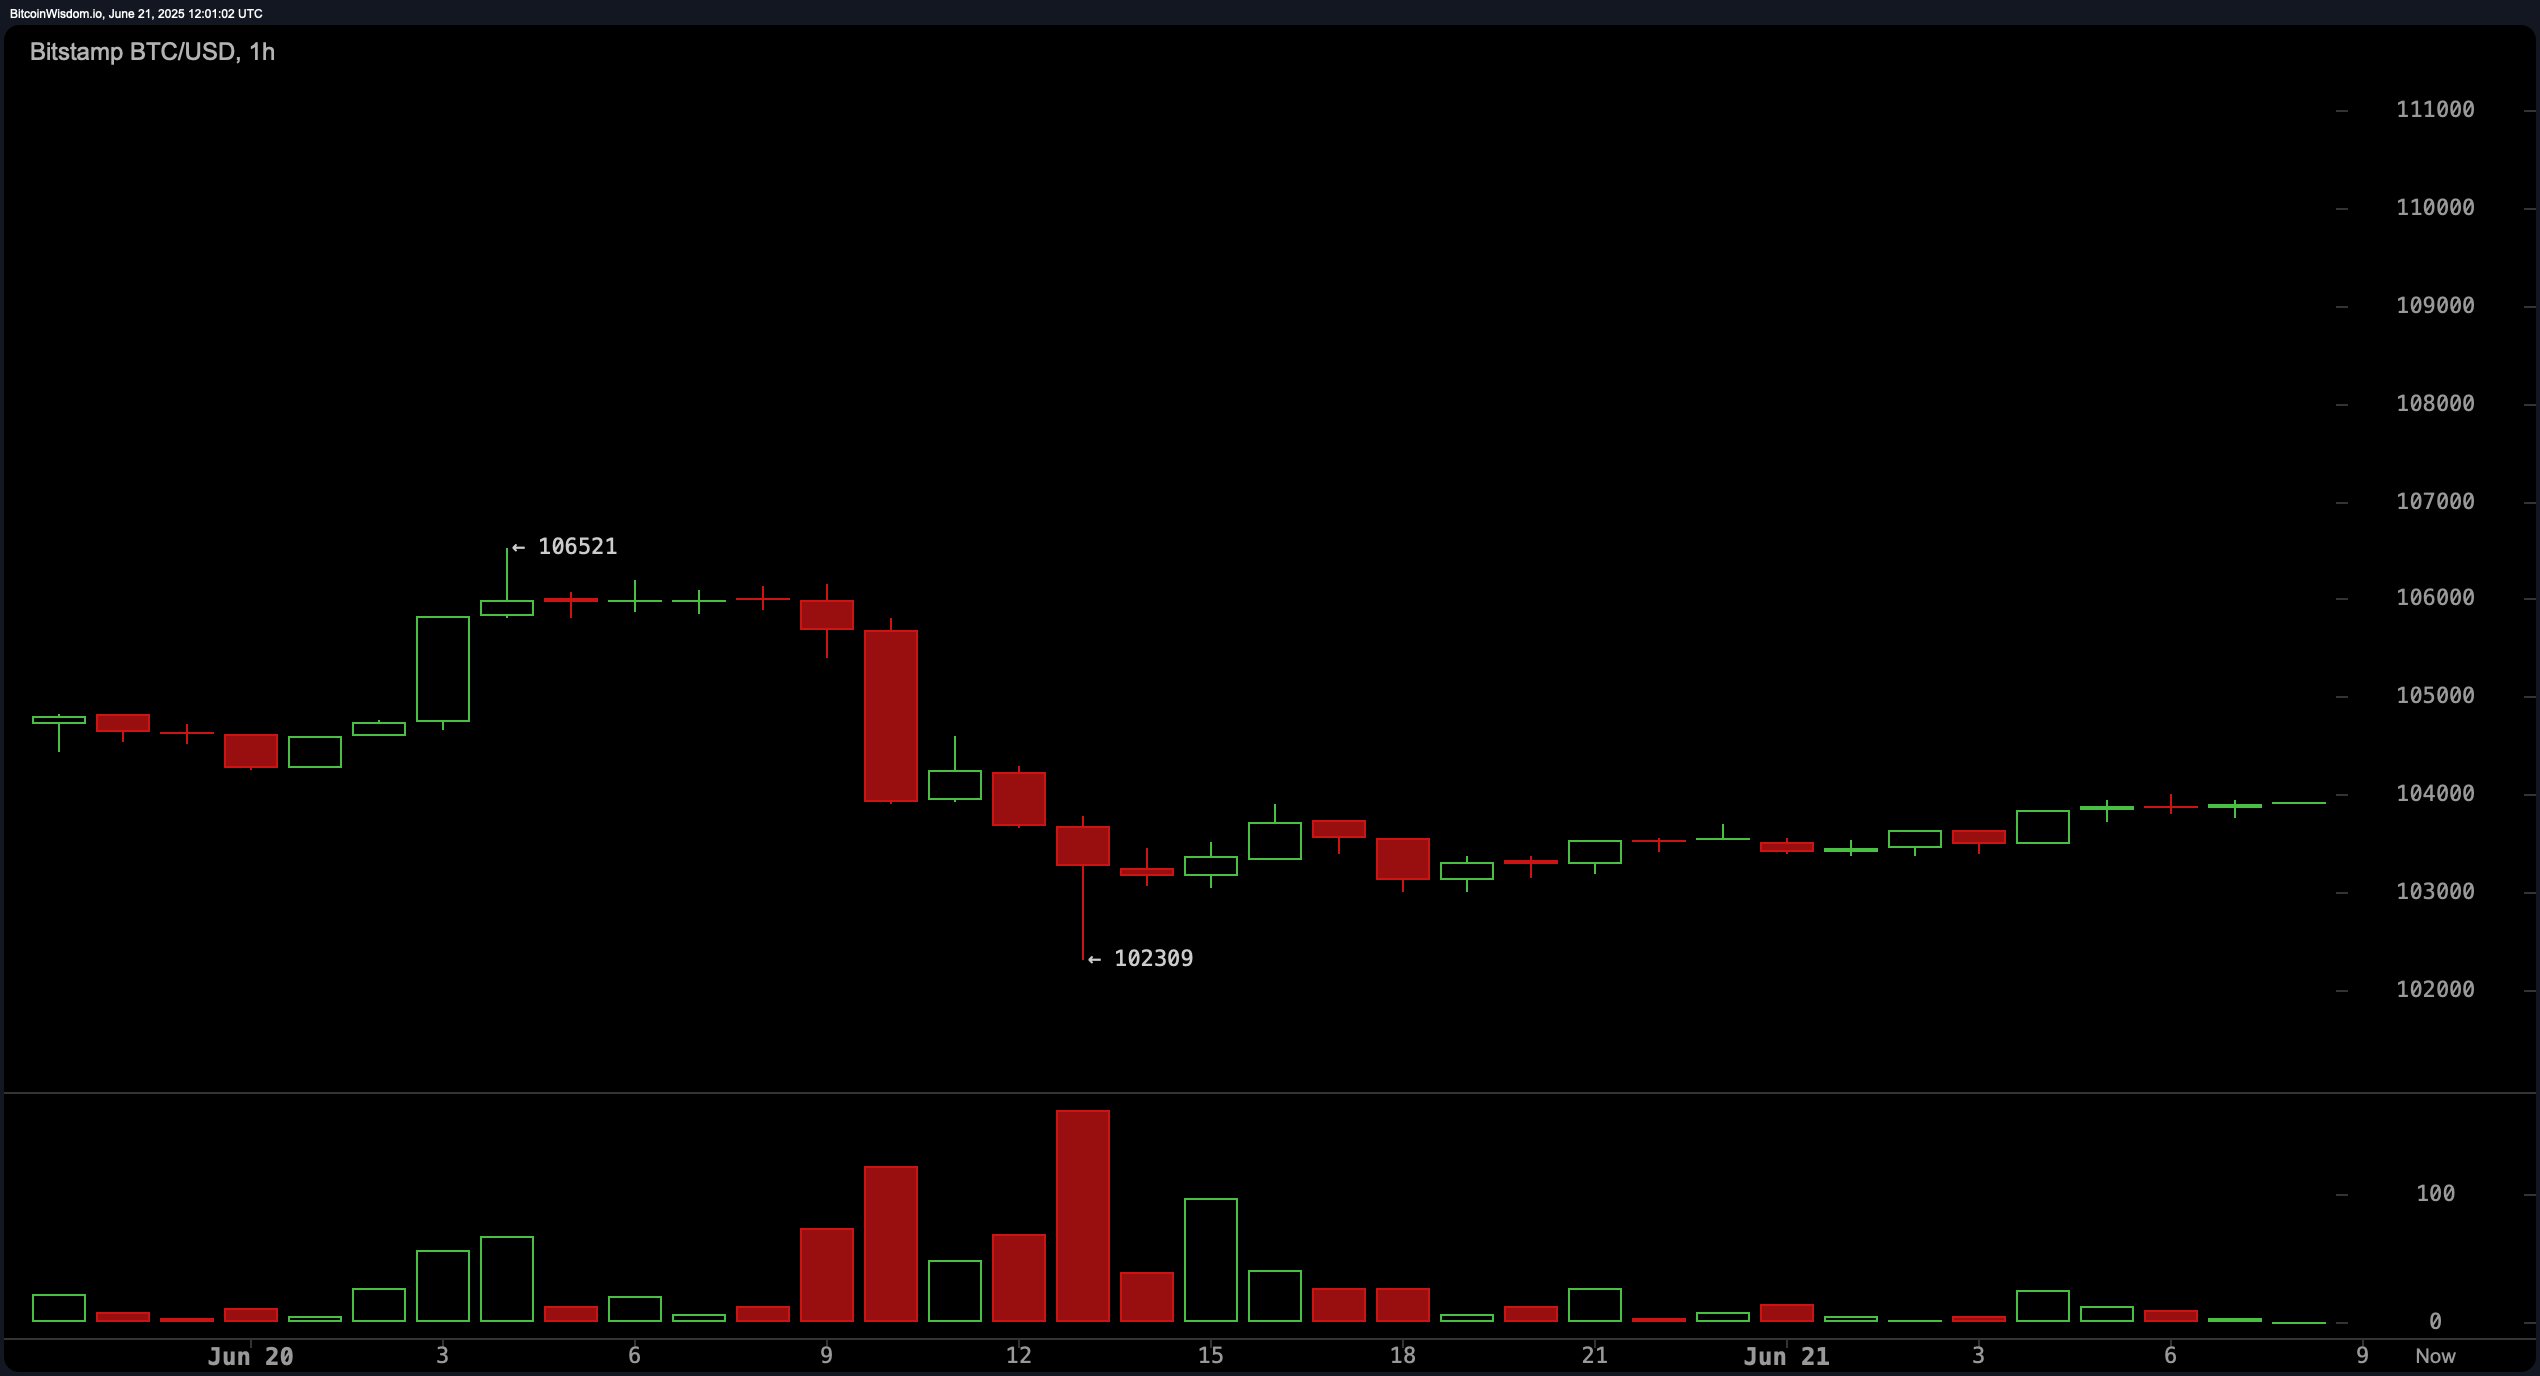
2025年6月21日通过Bitstamp的BTC/USD 1小时图。
振荡器传达出混合的前景。相对强弱指数(RSI)为46,表明中性立场。随机振荡器读数为23,商品通道指数(CCI)为−97,均为中性。同时,平均方向指数(ADX)为16,确认缺乏强趋势动能。惊人振荡器打印为−1,774,反映出看跌的基调。值得注意的是,动量振荡器读数为−4,801,显示出积极信号,而移动平均收敛发散(MACD)水平为−73,注册了负面信号。这种背离暗示着潜在的波动性,伴随相互矛盾的方向性信号。
整体来看,移动平均线(MAs)支持看跌前景。包括10日和20日指数移动平均线(EMA)及简单移动平均线(SMA)在内的短期指标均发出看跌信号,与更广泛的下行趋势一致。然而,50日、100日和200日指数移动平均线及简单移动平均线等长期指标则偏向看涨,大多数发出积极信号。这种背离突显了市场的过渡阶段,短期内的疲软存在于长期强势的更大框架内。
看涨判决:
为了重新获得看涨动能,比特币必须重新夺回并维持在106,000美元以上的水平,并伴随有说服力的成交量和结构。在此之前,做多头寸仍然是投机性的,任何上行都可能是在更广泛的整合区间内的修正。
看跌判决:
如果比特币在强成交量下收盘低于102,000美元,深度修正的可能性将越来越大。随着短期移动平均线与价格对立,振荡器显示出微弱的力量,看跌延续仍然是阻力最小的路径。
免责声明:本文章仅代表作者个人观点,不代表本平台的立场和观点。本文章仅供信息分享,不构成对任何人的任何投资建议。用户与作者之间的任何争议,与本平台无关。如网页中刊载的文章或图片涉及侵权,请提供相关的权利证明和身份证明发送邮件到support@aicoin.com,本平台相关工作人员将会进行核查。


